Pretest Analysis Of A 1:4-Scale Prestressed Concrete Containment Vessel Model
R. A. Dameron ~), Y. R. Rashid ~), V. K. Luk 2> and M. F. Hessheimer 2' 1) ANATECH, Corp., San Diego, CA, USA
2) Sandia National Laboratories, Albuquerque, NM, USA a
ABSTRACT
Sandia National Laboratories (SNL) is conducting a research program to investigate the integrity of nuclear containment structures. This program is co-sponsored by the Nuclear Power Engineering Corporation (NUPEC) of Japan and the US Nuclear Regulatory Commission (NRC). As part of the program NUPEC constructed a 1:4 scale model of the prestressed concrete containment vessel (PCCV) of a pressurized water reactor (PWR) plant. In 2000, Sandia instrumented and conducted an over-pressurization test of the model to failure. One of the key program objectives is to develop validated methods to predict structural performance of containment vessels when subjected to beyond design basis loadings, such as very high internal pressurization. The NRC-sponsored analysis effort to achieve this objective included 2D and 3D nonlinear finite element modeling of the PCCV model. Such analyses were performed using the nonlinear concrete constitutive model, ANACAP-U, in conjunction with the ABAQUS general purpose finite element code. The analysis effort is in three phases" 1) Preliminary Analysis, 2) Pretest Prediction, 3) Post-test Data Interpretation and Analysis. This paper describes the modeling approach and some results obtained in the Pretest Prediction phase of the analysis.
I N T R O D U C T I O N
The principal objectives of the pretest analyses were to (1) validate analytical methods for predicting global structural response of a prestressed concrete containment, (2) gain insight into potential structural failure modes of a prestressed concrete containment, and (3) support planning of test procedures and instrumentation. The high pressure "Limit State Test" (LST) of the NUPEC/Sandia 1:4 Scale PCCV Model was completed in September, 2000. The pretest prediction analyses were completed many months prior to this in order to document and publish the predictions prior to the test [1]. Because the pretest analysis predictions were needed well in advance, they did not include certain as-built features, actual measured prestressing and associated losses, nor creep and temperature effects. Prestress values, losses due to friction, anchor set, and concrete creep were approximated from the assumptions used in the PCCV model design.
A list of possible failure modes and failure locations was developed in the preliminary analysis phase prior to conducting the analyses [2]. Some of the potential failure modes were specifically addressed by the global analysis while others were addressed by local models. After the Preliminary Analyses, a liner failure at the midheight of the cylinder near a penetration and a shear/bending failure at the base of the cylinder wall were both found to have significant probability of occurrence. Recommendations were then made for the Pretest Analysis, including model refinements and development of local models that could better predict the sequence of competing failure modes that were identified. The local models developed for the Pretest Analysis were: the Equipment Hatch region, the Personnel Airlock region, and the Mainsteam Penetration region. A detailed 3D model of the entire cylinder midheight region (3DCM) was also developed to investigate tendon behavior in the cylinder and 3D effects that drive the local strain concentrations near the penetrations. A highly detailed representation of the wall-basemat juncture region was also added to the 2D axisymmetric model, so this made a total of five Pretest Analysis models. The Pretest Analyses described herein were also the basis of the SNL submittal to an international Round Robin Pretest Analysis exercise [3].
G L O B A L A X I S Y M M E T R I C ANALYSIS
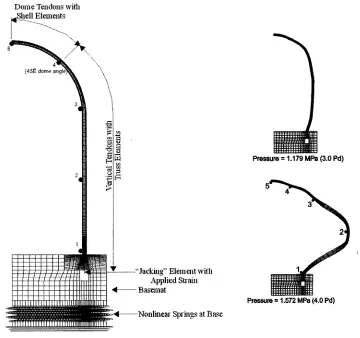
The Pretest axisymmetric model was developed from the Preliminary Analysis model, and modified to include more grid refinement at the wall-basemat juncture and explicit vertical tendon truss elements. The model represents the 135 ° azimuth which was assumed to be typical of a "free-field" azimuth, away from buttresses or penetrations. Figure 1 illustrates the model. The ABAQUS general purpose finite element program along with the ANACAP-U[4] concrete and steel
a Sandia is a multi program laboratrory operated buy Sandia Corporation, a Lockheed Martin Company, for the U.S.
Department of Energy under Contract Number DE-A CO4-94AL85000..
-1-
SMiRT 16, Washington DC, August 2001
Paper # 1271constitutive modeling program were used for all analysis [5]. Concrete cracking was simulated with the "smeared crack" approach where cracking is introduced at the finite element integration points. Tendons and their prestressing were modeled to replicate expected tendon stress-strain behavior and friction effects, but it should be noted that axisymmetric modeling does not allow tendon slip modeling for the hoop tendons. The revised axisymmetric grid had 12 elements through the wall thickness near the basemat. The concrete and liner were represented with 8-node quadrilateral elements (ABAQUS CAX8R) and 3-node axisymmetric shell elements, respectively. The total number of elements used was 2009.
The reinforcement in the structure was represented with ABAQUS rebar subelements. These subelement stiffnesses are overlaid onto their parent concrete elements in which they reside, but they do not have separate degrees of freedom, and so have strain compatibility with the concrete. The rebar stress-strain behavior is evaluated separately from the concrete, however. The bottom of the model is supported by nonlinear contact springs, with "zero" resistance to uplift and compression stiffness based on elastic stiffness of the concrete mudmat. The subgrade stiffness was not considered.
One complex aspect of the Pretest Analysis models (both global and local) was the tendon modeling. Significant effort was exercised in the tendon representation in order to:
1. Calculate the tendon stress distribution throughout the pressurization sequence including the effects of friction;
2. Calculate the displacements of the concrete wall correctly, since this drives the liner, and thereby refine the
prediction of liner strain concentrations.
The vertical tendons were modeled with 144 truss elements (with friction ties to adjacent concrete nodes) and 36 axisymmetric shell elements. Axisymmetric shells were used in the dome above an angle of 45 ° to represent the "smeared" hoop and vertical components of the hairpin tendons. Such modeling is reasonable because above 45 ° the tendons are all vertical (no hoop) and at the 135 ° azimuth they all intersect the model plane at +45 °. This avoided the mathematical difficulty of terminating tendon elements at the dome apex with finite cross-section area but zero radius. Hoop tendons were modeled as rebars, so they are always bonded to the concrete. The model was prestressed with the ABAQUS *INITIAL STRESS command in conjunction with the *PRESTRESS HOLD option (for the hoop tendons) that allows the model stresses to equilibrate, while forcing the hoop tendon stresses to remain at predetermined levels.
Pressure load was applied to all interior model surfaces over 161 increments. The ABAQUS feature
"DIRECT=NOSTOP" was used with five iterations per load step. The five iterations ensure that materials in the plastic range stay on a yield surface, but the "NOSTOP" parameter allows advancement of the solution before achieving full force convergence, which is difficult to achieve in cracked concrete elements. Instead of achieving force convergence, the displacement convergence at each increment was monitored to ensure the quality of the solution.
Some results of the axisymmetric analysis are plotted in Figures 2, 3, and 4. These figures show deformed shapes for two different pressure loads and radial displacements versus pressure at five points on the model. The vertical grid lines on the plot in Figure 3 represent multiples of design pressure, Pd = 0.39 MPa. Comparison of these curves shows the relative response levels of the different portions of the PCCV model. For radial response, different critical milestones can also be
noted by the changes in curve slope. Cylinder cracking coincides with the slope jump in the curves at about 1.7P d.
Progressive yielding of steel elements corresponds to the gradually increasing slope of the displacement curves.
Maximum principal strain contours plotted onto the deformed model shape are shown in Figure 4. The two primary damage locations are the cylinder midheight and the wall-basemat juncture. The largest strains tend to occur near the inner corner of the wall-basemat juncture, in the concrete, near the liner anchor embedment. Maximum principal strain of 0.10 is indicated at 3.4Pj, but this is very localized in the area of the re-entrant corner of the wall-basemat juncture. Most strains across the wall-base-section are less than 0.01 at this pressure, and a large portion of the cylinder experiences hoop strains of 0.01 at this pressure. A study of potential shear failure at the wall-basemat juncture showed that while wall-basemat outer surface concrete crushing is predicted to occur by 3.2Pj, a through-wall shear failure is not likely until at least 4.0P~; other failure modes were judged to be more likely prior to reaching this pressure.
3DCM M O D E L ANALYSIS
fine enough, however, to represent stiffness and yielding behavior of the liner in order to predictdisplacement versus pressure histories at the boundaries of local models. The primary objectives of the 3DCM model were to provide:
i. A 3D prediction of the radial displacement at the midheight of the cylinder;
ii. Prediction of complete tendon stress profiles for critical hoop tendons throughout the test pressure history; iii. Accurate displacement and "far-field" strain versus pressure prediction for applying boundary conditions to, and
ranking, the peak liner strains of local penetration studies.
The model consisted of 8-node brick elements, four through the wall thickness, 4-node shell elements for the liner, truss elements for tendons and friction ties, subelements for rebar, and 4-node shell elements for the hatch covers.
For any partial model of a pressure vessel, application of the boundary conditions is difficult, but critical to the modeling simulation. The strategy itemized below simulated the actual force conditions as closely as possible and applied the minimum of displacement constraints needed to prevent rigid body motion.
1. Apply internal pressure on all interior surfaces (including hatch covers).
2. Apply vertical stress Gz (equal to PR/2t) on the top "cut" surface.
3. Apply 00 = 0 at the top surface (i.e. zero rotation about tangential axis). (This condition was justified by the
results of axisymmetric analysis.)
4. Constrain Az = 0 at the concrete nodes on the bottom surface.
5. At three nodes near the mid-height of the 3DCM model (Elev. 6.823 m) constrain A0 = 0. Do not apply any
radial constraints.
The modeling of the hoop and vertical tendons is analogous to that described for the axisymmetric model vertical tendons. Each tendon is modeled with a truss element and with friction truss-ties to adjacent concrete nodes, as shown in Figure 5. The tie elements have length equal to the half-diameter of the tendon ducts. When the tendon is curved, the truss ties are oriented at an angle of tan-l(0.21), because the coefficient of angular friction used in the model design and assumed for its behavior was 0.21. By assigning this system of tendon elements small displacement theory, the friction truss-ties always transmit the exact amount of theoretical angular friction force from the tendon to the concrete. When the tendon segment being tied is straight, the tie element is oriented perpendicular to the tendon (no friction). Thus, wobble friction along straight runs of tendon is not considered. Wobble friction was considered, however, in estimating tendon stresses at the boundaries of the models. Anchor set losses were simulated by reversing the orientation of the friction truss elements over the anchor set loss zone, as shown in Figure 5. The length of this zone was predetermined from design calculations.
Because the model and tendons deform during prestress equilibration, the anchor stress application required several trial iterations to achieve the desired anchor stress at all tendons at the end of the prestress loading step. The vertical tendon stresses (1341 MPa) were applied to the tendon element "tails" at the bottom of the model. The target stress for vertical tendons away from penetrations was the design stress. (Friction along straight tendon segments was ignored). The target stress for tendons with any path deviation caused by penetrations was reduced from the design stress by the angular friction loss encountered between the base of the PCCV wall (Elev. 0) and the base of the 3DCM model. This theoretical loss along portions "outside" of the 3DCM model was performed by hand calculation.
After prestressing, pressure was applied to the model up to 3.8x the design pressure (3.8P,0. The distribution of strain in the hoop tendons of the 3DCM model is shown in Figure 6. The plot shows how tendon yielding starts first at the lower most tendons near the equipment hatch and starts at the peak stress locations about 30 ° away from the anchorages. This phenomenon is due to anchor set losses in the tendons. By 3.0P~, strains in the hoop tendon adjacent to the hatches have reached 1.4%, while strains elsewhere are generally between 0.006 and 0.010. At 3.5Pa, peak strains exceeded 5%, which is enough to rupture a tendon. Thus if model pressurization were not precluded by a liner failure/leakage, the 3DCM model predicts 3.5P~ as a structural limit state. (Note that this is lower than that predicted by 2D analysis alone.)
A deformed shape at 3.5Pd is shown in Figure 7. Important observations of the 3DCM model response follow:
a. The model deforms radially out more at 4.6752m (cylinder midheight) than at 8.9567m, which is the same trend
as in the axisymmetric model.
b. The largest hoop expansion occurs at the Equipment Hatch, and the "free-field displacement" (displacement at
0 ° and 180 °) are slightly less and are approximately equal to each other.
c. At pressures greater than 3.0Pd the radial displacements at 135 ° (and elsewhere) become somewhat larger in the
3DCM model than in the axisymmetric analysis, while below 3.0Pa, the axisymmetric analysis agrees well with the 135 ° azimuth of the 3DCM model.
d. There is significant local circumferential bending adjacent to each buttress.
e. There are significant strain concentrations at terminations or step-downs in rebar patterns.
f. There are significant strain concentrations near hatches and near the edges of wall embossments.
L O C A L ( P E N E T R A T I O N ) M O D E L ANALYSES
The concrete and liner model for the Pretest Analysis Equipment Hatch (E/H) study is illustrated in Figure 8. The grid was developed by generating a concrete mesh based on the tendon layout and then joining the embedded edges of the T- anchor webs to the concrete mesh with the ABAQUS *SURFACE attachment command. The upper quadrant around the hatch was selected for modeling in order to have a local model completely encompassed by the 3DCM Model. Five layers of concrete elements through the wall thickness were used, and the liner was modeled with shell elements so that liner bending and membrane behavior could be studied. Rebar in the concrete wall was modeled with rebar subelements, and tendons were modeled explicitly with truss elements and friction truss-tie elements as previously described.
To address the objective of "coupling" the results of the 3DCM model to that of the local E/H model, an algorithm was developed whereby the local E/H model was subjected to the same average hoop strain versus pressure history across the local model as was exhibited in the 3DCM model. This provided the pressure versus "boundary condition" correlation.
Liner strain plots from the E/H analysis showed elevated strains at 1) the juncture to the wall embossment, 2) locally near the termination of vertical stiffeners, and 3) near hoop stiffeners which terminate near the 3 o'clock position of the edge of the insert plate, as indicated in Figure 9. Strains near the vertical stiffener reached 17% at 3.25Pa, which became the best estimate failure pressure for the PCCV model.
The Personnel Airlock (A/L) is the second largest penetration in the PCCV model and it is located at the 62 ° azimuth, at elevation 4.525 m. As with the E/H, there are liner connection and anchorage details near the A/L that cause large strain concentrations; this makes the region near the A/L a candidate for a liner tearing failure mode. It was modeled and analyzed in similar fashion as the E/H.
The Mainsteam Penetration (M/S) is the third largest penetration, and it consists of a group of four penetrations located at the 180 ° azimuth. As with the E/H, there are liner connection and anchorage details near the M/S that cause strain concentrations, which makes the region near the M/S another candidate for liner tearing failure° The local M/S 3D model is illustrated in Figure 10. The modeling details for the local M/S model are similar to those developed for the Equipment Hatch model. The liner-anchor interaction (shear force deflection behavior of the anchors) is modeled identically to the E/H, as is the method of attaching the liner/anchor mesh to the concrete mesh.
Unlike the E/H and A/L models, which were given symmetry boundary conditions on both vertical boundary planes, the M/S model was loaded directly with displacement versus pressure histories at every node along the boundaries of the model. These pressure histories (different at every node and in all three degrees of freedom) were obtained directly from the 3DCM model. The end result of the average hoop strain correlation approach used for the E/H and A/L is believed to be nearly the same as with the direct application of displacements to nodes used in the M/S model° Some liner strain results for the M/S are shown in Figure 11. The "hot spots" for this region are near the vertical T-anchor terminations and near the thickened insert plate surrounding the penetration group. Peak strains at 3.5Pd are only about 5%, and these are generally lower than for the E/H.
C O N C L U S I O N S AND F A I L U R E P R E D I C T I O N S F R O M T H E P R E T E S T ANALYSIS
The Pretest Analysis phase of the PCCV model test program has refined and demonstrated finite element and material modeling methods and a systematic process for developing pressure response predictions from global 2D, semi- global 3D, and local 3D analysis models. Tendon modeling tasks described herein demonstrated the utility of a new tendon modeling approach in which friction losses are explicitly represented by friction truss tie elements. Improved tendon stress distributions at various pressures are provided as benchmarks of expected tendon behavior. Capturing the tendon stress distributions in more detail has refined the prediction of displacement response and liner strains, especially, near the E/H where this distribution is very complex. The 3DCM model with its detailed tendon representation, predicted rupture of hoop tendons closest to the E/H at a model pressure of about 3.5P d. However, this mode was predicted to be precluded by the liner tearing and leakage failure mode.
Using a strain-based failure criteria that considers the triaxiality of stress and a reduction in ductility in the vicinity of a weld, the liner failure strain was 0.16. The failure pressure at which a local analysis computed effective plastic strain that reached the failure strain, was 3.2Pj, or 1.3MPa. The location for this liner-tearing failure was near the Equipment Hatch (E/H), adjacent to a vertical liner anchor that terminated near the liner insert plate transition. Other local models showed other candidate liner tear locations, several of which were predicted to occur during the pressure range 3.2P~ to 3.5P,, if they are not precluded first by the growth of the first tear and subsequent depressurization of the vessel. A significant candidate tear location was also found near the 90 ° buttress where hoop strains are elevated due to circumferential bending, and weld seams
with hoop stiffener "rat-holes" are coincidentally located. Failure at such locations was predicted to occur shortly after the E/H location.
While the scope and objectives of the pretest analysis work for the l:4-scale PCCV did not include a formal probabilistic risk assessment of the failure (leakage) pressure prediction. The final probability of liner tearing/leakage versus pressure was described in probabilistic terms with reference to the final list of candidate tearing locations. Combining probabilities and locations produced the following leakage pressure predictions and confidence intervals which were published prior to the test: Best estimate
(Prehability--0.5),
P~e,k,,g~=3.2Pd=l.3 MPa; Upper bound(Prehability=0.9),
P~eak,g~=3.5Pd=l.4 MPa; Lower bound(Prehability'-0.1),
Pl~,k,ge=2.75Pd= 1.1 MPa.REFERENCES
1. Dameron, R. A., L. Zhang, Y.R. Rashid and M.S. Vargas, Pretest Analysis of a l:4-Scale Prestressed Concrete
Containment Vessel Model, NUREG/CR-6685, SAND2000-2093 Albuquerque, NM: Sandia National Laboratories.
August, 2000.
2. Dameron, R. A., Rashid, Y. R., Luk, V. K. and Hessheimer, M. F. "Preliminary Analysis of a 1:4 Scale Prestressed Concrete Containment Vessel Model," Proceedings of the 14th International Conference on Structural Mechanics in
Reactor Technology, Vol. 5, pp 89-96, Lyon France, August 17-22, 19970
3. Luk, V. K, Pretest Round Robin Analyses of a Prestressed Concrete Containment Vessel Model. NUREG/CR-6678, SAND00-1535. Albuquerque, NM: Sandia National Laboratories. August, 2000.
4. ANACAP-U User's Manual, Version 2.5, September, 1997. San Diego, CA: ANATECH Corp.
5. ABAQUS Users Manual, Version 5.8, 1998. Providence, RI: Hibbitt, Karlsson & Sorensen, Inc.
Dome Tendons with ~t~Shell Elements
\
\
\
... "'Jacking" Elemealt with Applied Strain Baseznat
Springs at Base
LzI-.-L~J ...
. . . , ; • ; • ] ; : : , , _ _ , o , , . ~ , , , . ; •
:: ... :: ::::~: r:
Pressure = 1,179 MPa (3.0 Pd)
Pressure = 1.572 MPa (4.0 Pd)
Figure 1. Axisynunetric Model of Prestressed Concrete
Contaimnent Vestal (PCCV) and Locations for Plotted Output
Figure 2. Defonned Shapes, Displaceanents magnified by 50
.~.:
_~.s-:~:
-Si----
!i~i;
./i.<,._---
...
"-~.~\..
\.
/"
'
k
:~.
i--1:7
.i:!:;-~
\'
.
..i
...
":~~-:~:~
-:-:G-...~
~
--...
h
\
\,
\
'\\
....
2
o
.~
//"
~
i/
~N
~1
IN
¢0
qt
I~l
i;+ii
fw
-.---.
~
i
I
~
qll
tN
0
(~)
o,
tmmow1:clrJTa
1:wTPw'4
i
I
I ~
i
|
|
I
i
,-,-
r-r
-~1 ~~i
!!
1
... ....-:-;;- ,~. ...0
"%{;;~:-.;:. • ~., ~ "I.=~
/
~
I~
--/
,~.~
i:i <'> ,/"i E)i
i::::I
w!
r'i:-,. I ®". ," o, / -J ~iV ~ -~ .~- _. _._._--- ~?- \ -\ E \ Ew
\
w
\ i:'<-:i Z:: :::/ ';:S:S:: :-i,~~::t;'~ ~; !~:: 'i;':~'~:::i~'~::.'-:: :::":::<' ::-"~~-:-~~ :i!:!V: •. :+..~%~ L_ t- O'i .__ t- i, )t G"~.~
'--'~ ~. .~i' i:: .~ "7 :ii:: :17 ~i" ii:: !i~ i! ii{: .i!i i7 i:: i{.ii!.ii:ii~i!i ! 7i :ii 7~ ~ii ii: 7 ~ ii !~: iii~ !i. :ii :i!i :!i :ii~ !i{ ::i::: ~ .-r-h i? i{~ i~::!? i ~
i? il ~
ii: ii
ii ::!!
i7 ii:
~i!' ,i!:i:i!
ii~- ii i:
~ :"ii. ~ii~ 1i ::iii i~ ':i, ii: !i: ?!i~ '~-i~. !ii
:!~,~ :i ~,
~ii, !i~, :ii~: !; !i~i:, 2 ,--i :i7 :i~ ~ :! i{: ~:i'~ iii 7 il ,i ~ ii: ii: ii iiiii::~ iiii .9o 7:, ii{ ~ ii ~: 7: i !i !ii iii !ii !i ::ii: ii ii: :::. {i ii:~i, t:3-4 0
~'<>.,:,i
iii
i!~ii',iiiiii:iiiiii?i!:iiiii:?i
,i
!i?ii
',~!il
ii!
iiTi
~iiii
::
~
Ii"
-,,-, ~ ii 7, i-ii! ii ii ! ii{ {i~ !i i:: i:i i{i~ii :',ii!',{ ~ !', i', :i: iii: i!i: ii ! ii ': ~ :!!': il i',~ iii i:: ~:: i: :i .,.., I~ i, ~ !{~ ii :~i !i ii: i i:~ il ~-~i:: i: !,~i !i :!ilili ii ~ i: i! i,. i{ i{, !i< ii: ii iii! ~i i.. i i i i{ :i i o 7 ~: ~i:. i~ ii: :i. iii ~i ::il !i i!: !i: ii ~i. i::ii~i: ~!~:ii ~ ii ~ if! .!~ i~ ~ ii~ ii 7 ii ~i ,7 i! ii il :i: :ii ii~ .~ i::: r-D ~i- ::-~:'~{i,. ~. !i: !i: ~'ii. {: !i ~{7 -ii~ '~i !i; ~!i, 7!i:::'!:.:!(~::,: :~{~ i!' i! .i!:,i ~ .~
:-i ~ ...i!
i!:
.~i ~:
~i '{ ~!
~i~ : ii"
x~
,,,
,
,
,
,
,
,
!
!
\
"--...
-~
...
~",\
i~I
'
+
."
o4
~!!i
iii!iiiil-i!
,i
r-
t~
m
0,_
t"d
__I
~
e-
Z
[]
i
i
.
,,~
~,-
~
~
!!i
Ii~
!
°
"W~-',-
-¢~
'"
"-7
Q
Ji
~'"
r-~