GIS Based Bi-variate Statistical Approach for
Landslide Susceptibility Mapping of South
District, Sikkim
Chandrashekhar Azad Vishwakarma1, Harshita Asthana1, Deepali Singh1, Manoj Pant1, Ratan Sen1, Saumitra
Mukherjee2
Ph.D. Student, School of Environmental Sciences, Jawaharlal Nehru University, New Delhi, India1
Professor, School of Environmental Sciences, Jawaharlal Nehru University, New Delhi, India2
ABSTRACT: Geologically diverse, Sikkim Himalaya is one of the vulnerable zones in terms of natural hazards. Being in Earthquake zone-IV and high rainfall area, the South districtis considered as one of the landslide susceptible zones of the state. The study is based on the Geo-statistical approach by using geospatial data analysis in ArcGIS software for landslide susceptibility mapping. The important factors for landslide susceptibility had been identified and thethematic mapswere prepared in GIS. Various datasets like satellite image, topographic maps and some published maps were used to generate these thematic layers. The numerical valueswere calculated from the thematic layers by using information value model. A landslide susceptibility map of the study area hadbeen generated by integrating all the layers in GIS (Geographic Information System) environment. Five categories of landslide susceptible zones in a part of South Sikkim have been generated i.e. very high, high, moderate, low and very low. This output result has been validated by reported landslide events and by using field survey of the study area.
KEYWORDS: Landslide susceptibility, Bi-variate statistics, Information value model (IVM), GIS, Sikkim.
I. INTRODUCTION
Sikkim is a part of Eastern Himalayas, and theentire state is hilly with an elevation range of 230 to 8583 meters.Landslide occurrences are very common in the Sikkim Himalayas causing lots of damages due to calamities every year(Bhasin et al., 2002). Due to its hydro-meteorological condition, Sikkim is the highest rainfall zone in India and receives more than 2500mm rainfall. Rainfall is the major triggering factor for landslide. Along with this, there are some other factors which make the state more prone towards themass movement. The steep slope, earthquakes and ruggedness are also some major factors for landslide occurrence in Sikkim. The landslide in Sikkim is not only due to natural phenomenon, but it is also due to anthropogenic activities like road cutting, deforestation etc. (Gupta et al., 2009).
The state is divided into four districts i.e. East, West, North and South. The area under investigation was South district. It is surrounded by two major rivers Teesta and Ranjit which flow from north to south direction. Namchi is the headquarter of South district and due to its natural beauty, it is developing rapidly. Due to population and tourism pressure, the construction of roads and buildings are going on, and as a result, the hilly slopes are getting disturbed day by day (Sarkar et al., 2008). The intense rainfall in the study area trigger the slope failure mainly in monsoon season and causes debris slide, rock slide and earth creep. It is found that 90% of losses due to landslide can be ignored if the probability of occurrence is known before the landslide occurrence (Pardeshi et al., 2013). Therefore, it is needed to characterize the responsible factors contributing for landslide and provide an informative landslide susceptible map for policy makers. This study will be helpful before starting any new developmental project.
triggering variables. In simple language, the preparatory variables prepare the condition to make the slope susceptible to failure without actually initiating this process. The factors like geology, landuse landcover (LULC), slope, elevation, aspect, distance to drainage, distance to fault, vegetation cover etc. comes under preparatory variables. The triggering factors are those which shift the slope from a stable to unstable condition and initiate the failure of thesusceptiblearea and these are heavy rainfall and earthquakes. With this discussion, it is clear that both the variables are responsible for landslide occurrences. In this study, only preparatory factors have been taken into account and hence the susceptibility map was prepared which define the possibility of occurrence of landslide events (Dai, 2002). Various methods have been used todelineate the landslide susceptible zoneand plenty of research papers are published for this work. The heuristic approach, inventory based mapping, probabilistic assessment, deterministic approach, statistical analysis and multi-criteriadecision-making approachand many methods had been developed for landslide hazard zonation (LHZ) mapping (Pardeshi et al., 2013). Nowadays the statistical approach is preferably used in various research papers. This method is grouped under two category 1. Bivariate statistical analysis and 2. Multivariate statistical analysis. The bivariate statistical approach is used for landslide susceptibility zonation based on theinfluence of each variable on the occurrence of landslide and the variablesare combined by a unique equation (Nandi et al., 2010). There are various methods used for bivariate statistical approach i.e. information value model (IVM), frequency analysis approach, weights of evidence model, weighted overlay model etc. (Pardeshi et al., 2013). The information value model is preferably used due to its statistical and numerical approach in the study area.The present study had been done in geographic information system (GIS) environment. Various thematic raster layers of all corresponding factors were generated and analyzed in GIS environment for landslide susceptibility mapping of South Sikkim. The susceptibility map had classified into five categories i.e. very high, high, moderate, low and very low susceptible zones of landslides.
II. STUDY AREA
Sikkim is the second smallest state of India having ageographical area of about 7096 sq. km (Map of India, 2017; State report). It is bounded by latitude 27° 04’ N to 28° 07’ N and longitude 88° 0’ E to 88° 55’ E and it shares aninternational border with three countries China, Bhutan and Nepal and in thesouth it touches the border of West Bengal in India (Figure 1). The present studyis focusedon the part of South District of Sikkimwhich shares the state boundaries with North, West and East districts of the state itself and in thesouth it touches the border of West Bengal. The Headquarter of South district is Namchi which is 78 km away from the capital of Sikkim. Area-wise, South Sikkim is the smallest district of Sikkim which is about 750 sq. km while population-wise it comes at thesecondposition. According to IMD, whole state is come under earthquake zone IV. The annual average rainfall in South Sikkim is 1625 mm and the maximum temperature varies from 17 to 27 C while minimum temperature varies from 02 to 21 C.
III. MATERIAL AND METHODS
3.1 Satellite data:
Table 1:List of satellite data used in this study
Years Satellite Sensor Resolution Data acquisition date WRS Path/row
1997 Landsat 5 TM 30 m 07/10/1997 139/41
2000 Landsat 7 ETM+ 30 m 26/09/2000 139/41
2005 Landsat 5 TM 30 m 13/10/2005 139/41
2008 Landsat 5 TM 30 m 21/10/2008 139/41
Shuttle Radar Topographic Mission (SRTM) DEM (Digital Elevation Model) data, 30m Resolution
3.2 Software used:
ERDAS Imagine 9.1 used to preprocess the satellite data
ArcGIS 9.3 for generation of thematic layers and Susceptibility map generation
3.3 Ancillary data:
1:50000 scale Survey of India (SOI) topographic sheet no. 78A6, 78A7 and 78A8 used to geo-rectification of Satellite data
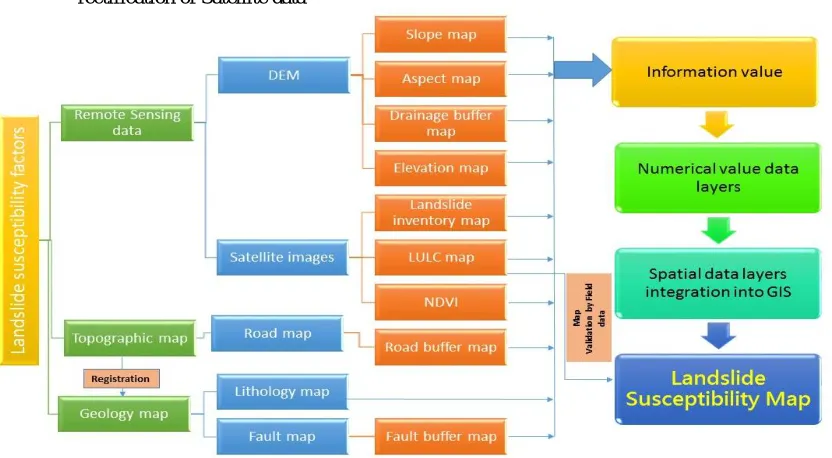
Figure. 2 Flow chart of Landslide susceptibility map zonation methodology
Therefore the statistical approach was used in this study. The bivariate statistical approach was applied where the numerical values were calculated using Information value model.
This information value was based on the relationship between the landslide occurrence and related parameters. After calculation of numerical values for all the causative factors, the raster layers with the numerical values were generated. After integration of all the layers into GIS environment, a landslide susceptible map was prepared. The flowchart of the methodology was shown in Figure. 2.
IV. RESULTS AND DISCUSSION
The landslide susceptibility zonation map were prepared from various spatial data layers. These layers were integrated into GIS environment using bivariate statistical technique. The landslide susceptible zones were generated and validate by field data.
4.1 Spatial data layers:
4.1.1 Landslide inventory maps
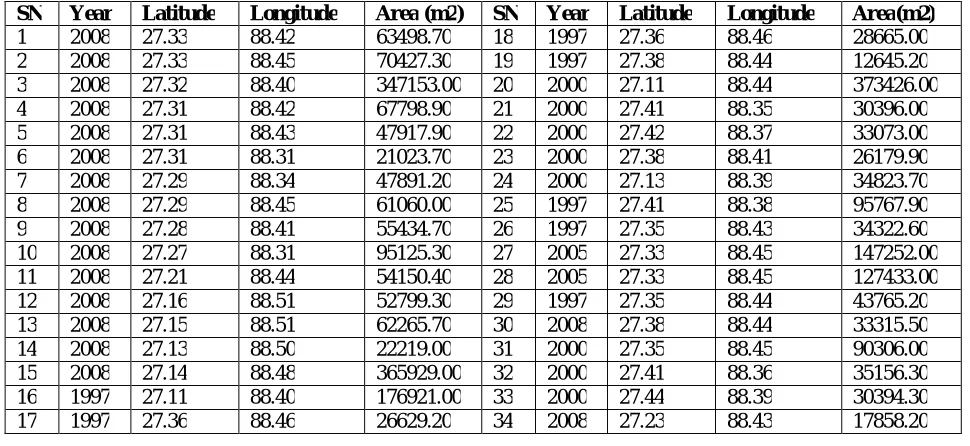
The study of landslide hazard primarily focuses on landslide inventory because these inventories are very important for most of the landslide susceptibility mapping techniques. It can be prepared by collecting the information from historical events of landslides or aerial photographs followed by field checking (Dai, 2002). There were various sites present in the study area where the landslide occurrence wasseen. Out of these sites, 17 sitesare reported by Sikkim State Disaster Management Authority in Inventory and GIS mapping of Landslide in North, East, West and South Sikkim and its Mitigation, 2007. These pointswere used for validation of landslide susceptibility map.The aerial photographs play very significant role in theidentification of landslide area (Guzzetti et al., 2012). The satellite images of four different years were selected for the identification of areas of landslide occurrences which depends upon the reflectance of the area (Table 1). The identification ofthese areas were very clear because the spectral response was different from its surroundings. The irregular shape of landslide areas also helped in the visual identification. Due to slides, the vegetation cover gets destroyed exposing the surface. This region shows high reflectance in the image and the irregular shape confirms the landslide events (Karungo et al., 2009). With the help of ArcGIS software, the inventory map had been generated and 34 landslide spots were identified from all the satellite images (Table 2).
Table 2:List of identified landslide spot collected from different year of satellite images.
SN Year Latitude Longitude Area (m2) SN Year Latitude Longitude Area(m2)
1 2008 27.33 88.42 63498.70 18 1997 27.36 88.46 28665.00 2 2008 27.33 88.45 70427.30 19 1997 27.38 88.44 12645.20 3 2008 27.32 88.40 347153.00 20 2000 27.11 88.44 373426.00 4 2008 27.31 88.42 67798.90 21 2000 27.41 88.35 30396.00 5 2008 27.31 88.43 47917.90 22 2000 27.42 88.37 33073.00 6 2008 27.31 88.31 21023.70 23 2000 27.38 88.41 26179.90 7 2008 27.29 88.34 47891.20 24 2000 27.13 88.39 34823.70 8 2008 27.29 88.45 61060.00 25 1997 27.41 88.38 95767.90 9 2008 27.28 88.41 55434.70 26 1997 27.35 88.43 34322.60 10 2008 27.27 88.31 95125.30 27 2005 27.33 88.45 147252.00 11 2008 27.21 88.44 54150.40 28 2005 27.33 88.45 127433.00 12 2008 27.16 88.51 52799.30 29 1997 27.35 88.44 43765.20 13 2008 27.15 88.51 62265.70 30 2008 27.38 88.44 33315.50 14 2008 27.13 88.50 22219.00 31 2000 27.35 88.45 90306.00 15 2008 27.14 88.48 365929.00 32 2000 27.41 88.36 35156.30 16 1997 27.11 88.40 176921.00 33 2000 27.44 88.39 30394.30 17 1997 27.36 88.46 26629.20 34 2008 27.23 88.43 17858.20
4.1.2 Lithology
The geological information was collected from the report of Geology and Mineral Resource of Sikkim, Geological Survey of India, 2012. First of all the geology map was rectified using ERDAS Imagine software. This geo-rectified image was brought into GIS environment and the whole image was then digitized and saved as vector file. The geology of South Sikkim shows that most of the region is dominated by Gorubathan formation followed by Kanchenjunga Gneiss, Reyong formation and Damuda group. Many other formations were also identified in less dominant form. Chlorite, Schist, Phyllite, quartzite were dominant in most of the part of the study area, whereas the northern part which is usually covered with glaciers were dominated by Kyanite, Biotite, Mica Schist etc. Phyllite, Dolostone and cherty Phyllite were dominated towards the western side of the study area. Sandstone, phyllite and chlorite schist rocks were found more prone to landslides.
4.1.3 Land use/land cover (LULC)
aa
Figure. 3 (a) Landslide inventory map of study area generated from the multitemporal satellite datasets (b) The lithology map of south sikkim collected from Geological survery of India (c) Landuse/landcover of South Sikkim with seven major classes.
4.1.4 Normalized difference vegetation index (NDVI):
Normalized difference vegetation index (NDVI) is a most widely used index for monitoring green cover from remote sensing images. It is calculated using two wavelengths i.e. Red and Near-infrared (NIR). It is the ratio of the difference of near infrared (NIR) and red bands by their addition which gives the effective measurement of photosynthetic biomass (Huete et al., 1997; Singh et al., 2016). The chlorophyll pigment in plant leaves strongly absorbs visible light (from 0.4 to 0.7 µm) for photosynthesis. On the other hand, the cell structure of the leaves strongly reflects near-infrared light (from 0.7 to 1.1 µm) (Earth Observatory, 2016). Therefore, these two bands are very useful to estimate the vegetation health.
( ) = (1)
NDVI ranges from -1 to +1. This value shows the vegetation health. Higher the NDVI value indicate healthier vegetation whereas the lower value indicates the sparse or unhealthy vegetation (Singh et al., 2016).
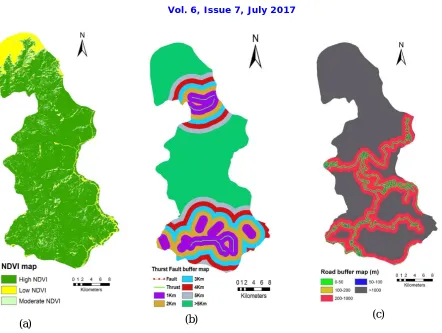
In the study area, the NDVI value ranges from -0.40 to 0.79. On the basis of these values, the image had been classified into three categories i.e. low, moderate and high NDVI (Humboldt State University, 2016). The low NDVI values were found in no vegetation zones like snow, rocky or barren areas. Sparse or less vegetation areas such as shrubs and
grasslands showed low positive NDVI values which were placed in moderate NDVI category. And the high NDVI values correspond dense vegetation which was dominant in the study area.
4.1.5 Thrust and Normal Fault
The whole state of Sikkim belongs to some parts of Lesser Himalayas, Higher Himalayas and Tibetan Plateau. Main boundary thrust (MBT) passes through the southern part of West Bengal-Sikkim boundary. Main Central Thrust (MCT) passes through the central part of the state and normal fault passes through the northern part of the state. There are a number of small thrusts and NW and NE trending faults as well. Among them some faults still appear as active faults (GSI, 2012). Thrust and faults are a type of fractures in which horizontal or vertical displacement along the fault plane can range between few centimeters to thousands of kilometers (Crawford Mark J., 1998). In the present study the thrust and fault map was extracted from Geology and mineral map of GSI. It was digitized and converted as raster layer in GIS environment. The buffer zone map was created by taking a buffer distance of 1km, 2km, 3km, 4km, 5km and >5km. The areas near the fault and thrust lines were found out to be more prone to landslides. Some of the landslide events were even recorded away from the buffer zone. It was indicating the influence of some other factors as well.
4.1.6 Road buffer map
Figure 4 (a) Normalized Difference Vegetation Index (NDVI) after classification into High, Low and Moderate NDVI (b) Thrust Fault buffer map with buffer zone of 1km, 2km, 3km, 4km, 5km and more than 5km. (c) Road map of South Sikkim with buffer zone of 50m, 100m, 200m, 1000m and more than 1000m.
In this study, the road map was digitized using a topographic map. After getting the road map, the buffer map of the road network was generated in ArcGIS software. Various buffer distances were taken from the road having intervals 50m, 100m, 200m, 1000m and >1000m. During GIS analysis, it was found that the buffer zone which was closer to the road was more vulnerable than those which were far away from the road.
4.1.7 Digital elevation model (DEM) and its derivatives
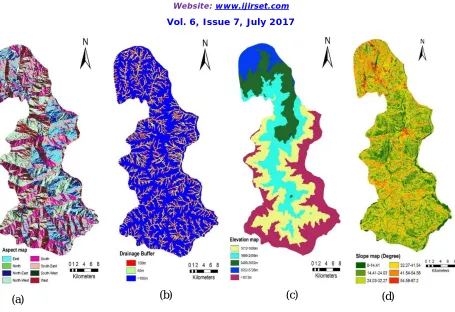
Digital elevation model (DEM) is the representation of the regular array of elevation points (Chang,2014). Most of the GIS users prepare DEM of the study area using contour information given in the topographic map. There are other sources of DEM also such as satellite images, radar data and LIDAR (Light detection and ranging) data. In this study, Shuttle Radar Topographic Mission (SRTM) data with a resolution of 1arc-second (30 meters)was used. After preprocessing the images into GIS, slope, aspect, drainage and elevation mapswere generated. Drainage buffer was prepared using the drainage map.
Figure 5 Derived images extracted from SRTM data. (a) Aspect map of South Sikkim (b) Extracted drainage map from a SRTM data with buffer zone of 50m, 100m and more than 100m. (c) Elevation map of South Sikkim in meter. (d) Slope map of South Sikkim in degree
The elevation ranges from 1012m to 5728m in the study area and it had been categorized into five classes. The study shows that the lowest elevated part of the study area was very much prone to landslide eventswhereas the elevation ranging from 2499m to 3552m was less prone. Aspect is the directional measure of the slope. The aspect mapwas prepared from hydrology tool of ArcGIS software. The slope direction towards north, north-east, south-west, west and north-west are less prone areas whereas those which lies in east, south-east and south were more prone for landslide events. The drainage map was also prepared from the DEM data. The first, second, third, fourth and fifth order drainageswere taken into consideration to prepare a drainage buffer map. For drainage buffer map preparation, 50m, 100m and more than 100m widths from drainage network were taken. The area whichwas found near the drainage network was more prone to landslide.
4.2 Landslide susceptibility analysis using statistical approach
Dictionary meaning of Susceptibility is the state of being susceptible from some external factors. In this study slope, aspect, elevation, drainage buffer, lithology, fault buffer and land use land cover wereconsidered as external factors for landslide events.30m resolution TM satellite data was used for mapping of landslide inventory. Likewise, the LULC map was generated from same data to avoid the error that comes due to resolution. The SRTM DEM data having resolution 1 arc second (30m) was used. The digitized maps such as lithology,drainage and thrust fault buffermaps were resampled to cell size 30mX30m.
The selection of methods for landslide susceptibility depends on the available datasets and their importance in the study area. In this study, theStatistical approach has been chosen to obtain information based on the relationship between the causative factors responsible for instability and landslide distribution. The statistical approach isgroupedinto two parts i.e. bivariate statistical analysis and multivariate statistical technique. The bivariate statistical analysis depends on each
thematic layers in comparison with existing landslide layers. The calculation of weight value for each responsible factor depends on the landslide density. All the layers were overlaid on landslide inventory data layers and the landslide densities were calculated for each of the instability causing factors (Kanungo et al., 2009). There are various bivariate methods available for landslide susceptibility analysis. Among them, Information value model was found to be most suitable for the analysis and the study.
4.2.1 Information Value Model (IVM)
This method was developed by van Westen (1997) for landslide hazard zonation which determines the occurrence of landslides in a specific area. This method is known as the simplification of Yin and Yan (1988) method (Saha et al., 2002). Landslide potential values were defined using information value method by Jade and Sarkar (1993) (Lin et al., 2004). The information value model was found out to be very useful to determine the individual effect of responsible factors for landslide occurrence (Pardeshi et al., 2013). The information valueIi for each parameter can be calculated as:
= log /
/ (2)
In which: N = total number of grid cell, S = number of grid cells with landslide, Si = number of grid cells with parameter i and containing landslide, Ni = number of grid cells with the parameter i.
The total information value in a grid cell j is:
=∑ (3)
Here, Xji is the value of parameter i; J = 1,2,….N and i = 1,2,…..M; Xji = 1, if parameter i exists in grid cell j; Xji = 0, if
parameter i does not exist in grid cell j; M =number of parameters considered.
By using above model, the information values for different categories of the responsible factors were calculated. After summation of all the information values of each cell of all the categories of each factors, the landslide susceptibility index was calculated. This indexgenerated the landslide susceptibility map. The landslide susceptibility index showeda range of numerical values.These values are directly proportional to the degree of landslide susceptibility. Lower the information value lower will be the susceptibility while higher the information value higher will be the susceptibility.
4.2.2 Landslide susceptibility analysis in GIS Environment
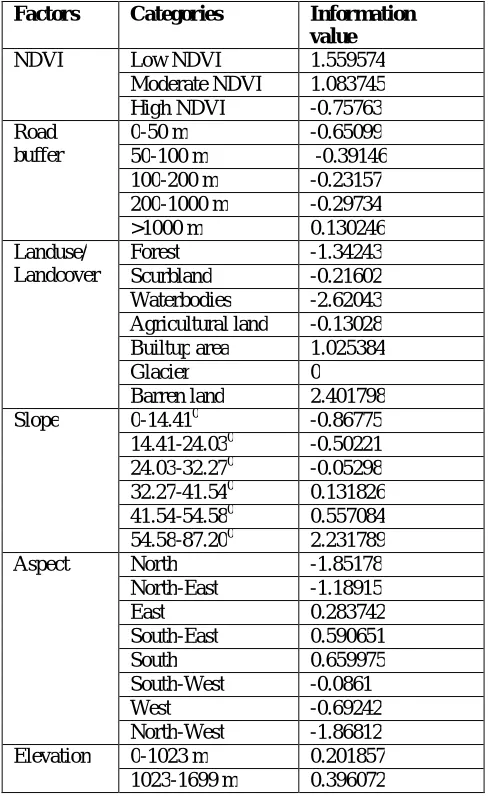
As mentioned above, nine thematic layerswere generated with a cell size of 30m X 30m. The total number of cells present in the study area is 808576. Out of these cells, 3170 cells belong to the landslide events. The cells containing landslides were extracted from each parameter of each factor.To carry out this process, each layer was joined with landslide inventory map to extract the landslide pixels of each corresponding parameters. Along with this, the total no. of cells for each class of each layerwas also calculated. The information value was calculated from equation 1 for each of the classes of each layer.
al., 2008; Saha et al., 2002), the steepest slope was found more responsible for landslide occurrence rather than a gentle slope.
The present study also showed the same result where the slope angle more than 540 had highest information values and lower slope angles had lower information values which affects less on landslide occurrence. The direction of the slope i.e. aspect also influences the landslide susceptibility (Dai et al., 2001). In this study, the south and south-east direction had highest information values. It can be seen from the above table that the frequency of landslide was highest in south and southeast facing slopes. Various lithological units demonstrate thevarious active geomorphological processes. Therefore, the geology is a very important factor for landslide study. One important factor of geology is weathering degree of the units (Karsli et al., 2009). In this study, Greywacke rocks show high information value for landslide susceptibility. Greywacke comprises of deformed forms of sandstone that metamorphosed into greywacke semischist or schist (Allen at al., 2011). In the vicinity of the drainage channel, the possibility of landslide occurrence is very high in most parts of the study area. The present study also shows similar results where the 0-50m buffer has highest information values. It was found out that the areas which were nearest to the thrust had high information values. As the distance from the thrust increases, the possibility of occurrence of landslides also decreases.
Table 3:Information value of all factors categories
Factors Categories Information
value
1699-2499 m -0.02933 2499-3552 m -1.95018 3552-5728 m 0 Geology Phyllite 0 Schist 0 Dolostone 0 Quartzite 0 Shale 0 Greywacke 1.338333 Chlorite 0.299154 Sandstone -0.46658 Gneiss 0 Drainage
buffer
0-50 m 0.560576 50-100 m 0.098605 >100 m -0.28146 Thrust fault
buffer
0-1 km -0.6659 1-2 km 0.630145 2-3 km -0.00905 3-4 km -0.12228 4-5 km -0.75418 >5 km -0.02741
Factors Categories Information
value
NDVI Low NDVI 1.559574 Moderate NDVI 1.083745 High NDVI -0.75763 Road
buffer
0-50 m -0.65099 50-100 m -0.39146 100-200 m -0.23157 200-1000 m -0.29734 >1000 m 0.130246 Landuse/
Landcover
Forest -1.34243 Scurbland -0.21602 Waterbodies -2.62043 Agricultural land -0.13028 Builtup area 1.025384 Glacier 0 Barren land 2.401798 Slope 0-14.410 -0.86775
14.41-24.030 -0.50221 24.03-32.270 -0.05298 32.27-41.540 0.131826 41.54-54.580 0.557084 54.58-87.200 2.231789 Aspect North -1.85178
North-East -1.18915 East 0.283742 South-East 0.590651 South 0.659975 South-West -0.0861 West -0.69242 North-West -1.86812 Elevation 0-1023 m 0.201857
There were nine major factors considered to categorize the landslide susceptible zones. Overall 52 various classes were extracted from these major categories. By information values, top ten important factors were identified and decreasing order of information values of these factors are; barren land, 540 – 870 slope, low NDVI, Greywacke rocks, Moderate NDVI, Built up area, South aspect and 1-2 km thrust fault buffer. From this data, it was clear that the LULC, lithology, slope and NDVI were major contributing factors for landslide occurrence in the study area.
After getting the information values of each layer from equation 2, all these thematic layers were integrated into ArcGIS software. The raster calculator of spatial analyst tool was used to get the final landslide susceptibility map. After integration of all the raster layers, the landslide susceptibility index value of each cell was generated. It ranged from -7.69 to 9.06. On the basis of these values, the study area had been classified into five categories. These were very low, low, moderate, high and very high as shown in table no. 4 Area-wise, moderate landslide susceptible zones were dominant in the study area. The northern part of the study area is mostly covered with snow and glaciers lacking vegetation. Rest of the area comes under high to very high category due to the high slope, low vegetation and lithological factors.
Figure 5 Landslide susceptibility map
Table 4 Landslide susceptibility index of all susceptible zones
Landslide susceptibility class Area (Km2) Area (%) Landslide susceptibility index
4.3 Landslide susceptibility map validation:
The landslideswere grouped under five classes i.e. high, very high, moderate, low and very low susceptible zones. These zones were superimposed on landslide inventory map and it is validating the area which was identified on inventory map. The mapwasalso validated by the existing landslide points available in the report. On the basis of these points, the accuracy assessment had been done.The Kappa analysis is a discrete multivariate technique used in accuracy assessment. The result of Kappa analysis is a KHAT statistic. The value of KHAT statistic ranges from +1 to -1 (Congalton and Green, 2008). The value of KHAT falls under three categories: values greater than 0.80 (>80%) shows strong agreement; between 0.40 and 0.80 (40-80%) for moderate agreement; and values below 0.40 (<40%) represent poor agreement(Landis and Koch, 1977).
The accuracy assessment was done using ERDAS Imagine 9.1 software. The overall classification accuracy for the landslide susceptibility map is 82.35% and the Kappa statistics was 0.73. This kappa value shows strong agreement validating that the landslide susceptibility map has been correctly classified.
V. CONCLUSION
The present study aims at determining the landslide susceptibility mapping using geospatial techniques. GIS played a significant role to analyze all the causative factors governing the slope failure in the study area. All the factors pertained a significant importance for slope failures therefore a significant value needs to be determined. A well-known technique had been used to calculate the importance of all the factors called as Information value model. It was a bivariate statistical technique which was supported by various researchers and scientists. It helped to find the weightage of each parameter and a susceptible map had prepared.
The susceptible map had been preparedon the basis of landslide inventory map. There were various points identified from the Government reports which was collected from official websites of South Sikkim. These points were overlaid on the landslide susceptibility map and verified by using accuracy assessment method in ERDAS Imagine software. A strong correlation was found in between the points and landslide susceptible zones which were shown by Kappa statistics. Most of the areas which lie near the vicinity of river, drainage and less vegetated areas such as barren land and scrubland were found to be in high susceptible zones.
The present study was an attempt to demarcate the whole study area into various landslide susceptible zones. However, more thorough analysis is required with more inputs of data such as earthquake and rainfall to give more accurate results. This type of analysis is very much useful to those people and stakeholders who are planning for any residential or developmental projects in the future.
REFERENCES
1. Allen, Simon K., Simon C. Cox, and Ian F. “Owens. Rock avalanches and other landslides in the central Southern Alps of New Zealand: a regional study considering possible climate change impacts”. Landslides 8.1, 33-48, 2011
2. Ambazamkandi P, Thyagarajan G, Sambasivan S, et al. “Shelter Design for Different Livestock from a Climate Change Perspective”. In
Climate Change Impact on Livestock: Adaptation and Mitigation (pp. 399-424). Springer India. 2015.
3. Bhasin, R., Grimstad, E., Larsen, J.O., Dhawan, A.K., Singh, R., Verma, S.K. and Venkatachalam, K. “Landslide hazards and mitigation measures at Gangtok, Sikkim Himalaya.”Engineering Geology, 64(4), pp.351-368.2002
4. Chang, Kang-tsung. “Introduction to geographic information systems”. Boston: McGraw-Hill Higher Education, fourteen edition. 2014 5. Congalton, Russell G., and Kass Green. “Assessing the accuracy of remotely sensed data: principles and practices.” CRC press. 2008. 6. Dai, F. C., C. F. Lee, and Y. Yip Ngai. “Landslide risk assessment and management: an overview.” Engineering geology, 65-87. 2002 7. Dai, F.C., Lee, C.F., Li, J. and Xu, Z.W.“Assessment of landslide susceptibility on the natural terrain of Lantau Island, Hong Kong”.
Environmental Geology, 40(3), pp.381-391, 2001.
8. Dhakal, Amod S., Takaaki Amada, and Masamu Aniya. “Landslide hazard mapping and its evaluation using GIS: an investigation of sampling schemes for a grid-cell based quantitative method.”Photogrammetric Engineering and Remote Sensing 66.8: 981-989. 2000.
9. Earth explorer, United States Geological Survey (USGS). https://lta.cr.usgs.gov/citation accessed on 01 October, 2016.
10. Gawande, K., Kapur, D. and Satyanath, S. “Renewable Natural Resource Shocks and Conflict Intensity: Findings from India’s Ongoing Maoist Insurgency”. Journal of Conflict Resolution, 61(1), pp.140-172, 2017.
11. Geology and Mineral Resources of Sikkim, Geological Survey of India. Miscellaneous Publication, No. 30, Part XIX, Sikkim, 2012.
13. Gupta, Mousumi, M. K. Ghose, and L. P. Sharma. “Application of remote sensing and GIS for landslides hazard and assessment of their probabilistic occurrence—a case study of NH31A between Rangpo and Singtam.” J Geomatics 3.1: 13-17. 2009
14. Guzzetti, F., Mondini, A.C., Cardinali, M., Fiorucci, F., Santangelo, M. and Chang, K.T. “Landslide inventory maps: New tools for an old problem.”Earth-Science Reviews, 112(1), pp.42-66, 2012.
15. Huete, A.R., Liu, H.Q., Batchily, K. and Van Leeuwen, W.J.D.A. “A comparison of vegetation indices over a global set of TM images for EOS-MODIS.”Remote sensing of environment, 59(3), pp.440-451, 1997.
16. Introduction To The State And Its Capital, City Development Plan-Gangtok City, Section 2, pages 2-7
17. Kanungo, D.P., Arora, M.K., Sarkar, S. and Gupta, R.P. “Landslide Susceptibility Zonation (LSZ) Mapping–A Review”. 2012.
18. Karsli, F., Atasoy, M., Yalcin, A., Reis, S., Demir, O. and Gokceoglu, C. “Effects of land-use changes on landslides in a landslide-prone area (Ardesen, Rize, NE Turkey)”. Environmental monitoring and assessment, 156(1), pp.241-255, 2009.
19. Landis, J. Richard, and Gary G. Koch.“An application of hierarchical kappa-type statistics in the assessment of majority agreement among multiple observers”. Biometrics: 363-374, 1977.
20. Lin, Meei-Ling, and Chi-Che Tung. “A GIS-based potential analysis of the landslides induced by the Chi-Chi earthquake”. Engineering
Geology 71.1: 63-77, 2004.
21. Mark J. Crawfors M.S, Physical Geology, First edition, ISBN 0-8220-5335-7, 1998.
22. Mehrotra, G., Kanungo, D., &Mahadeviah, K. “Landslide hazard assessment—a need for environmental management”. In Proc. 7th
international symposium on landslides (pp. 315–320). Norway: Trondheim, 1996.
23. Mondal, Sujit, and Ramkrishna Maiti.“Landslide susceptibility analysis of Shiv-Khola watershed, Darjiling: a remote sensing & GIS based Analytical Hierarchy Process (AHP)”.Journal of the Indian Society of Remote Sensing 40.3: 483-496, 2012
24. Nandi, A., and A. Shakoor.“A GIS-based landslide susceptibility evaluation using bivariate and multivariate statistical analyses.”Engineering
Geology 110.1: 11-20, 2010.
25. Normalized Difference Vegetation Index (NDVI), Vegetation indices, Humboldt State University.
http://gsp.humboldt.edu/OLM/Courses/GSP_216_Online/lesson5-1/NDVI.html accessed on 05 Jan, 2017.
26. Pardeshi, Sudhakar D., Sumant E. Autade, and Suchitra S. Pardeshi, 2013. Landslide hazard assessment: recent trends and techniques. SpringerPlus2.1: 1.
27. Saha, A. K., R. P. Gupta, and M. K. Arora.“GIS-based landslide hazard zonation in the Bhagirathi (Ganga) valley, Himalayas”. International
Journal of Remote Sensing 23.2: 357-369, 2002.
28. Saha, A.K., Gupta, R.P., Sarkar, I., Arora, M.K. and Csaplovics, E. “An approach for GIS-based statistical landslide susceptibility zonation— with a case study in the Himalayas”. Landslides, 2(1), pp.61-69, 2005.
29. Sarkar, S., Kanungo, D., Patra, A. and Kumar, P. “Disaster mitigation of debris flows, slope failures and landslides. GIS based landslide susceptibility mapping-a case study in Indian Himalaya”. 2006.
30. Sarkar, S., Kanungo, D.P., Patra, A.K. and Kumar, P. “GIS based spatial data analysis for landslide susceptibility mapping”. Journal of Mountain Science, 5(1), pp.52-62, 2008
31. Sikkim Action Plan on Climate Change (2012-2030), March, 2011
32. Sikkim map, Map of India.http://www.mapsofindia.com/maps/sikkim/. Accessed on 03 February, 2017
33. Sikkim state disaster management authority. http://www.ssdma.nic.in/resources%20publications.php. Accessed on 06 November, 2016 34. Singh, N., Asthana, H., Vishwakarma, C.A., Sen, R. and Mukherjee, S.“Soil chemical analysis of gangetic delta plain by combined use of
multispectral imagery and XRF spectroscopy”. International Journal of Advanced Geosciences, 4(2), pp.92-103. 2016.
35. Sorriso Valvo, M.“Landslides from inventory to risk. Landslides proceedings of the international conference on landslides”. Balkema,
Rotterdam. 2002.
36. South Sikkim, the official website of Sikkim. http://www.southsikkim.nic.in/ accessed on 13 November 2016. 37. State industrial profile of Sikkim 2009-10.
38. Vishwakarma, C.A., Thakur, S., Rai, P.K., KAMAL, V. and MUKHERJEE, S. “Changing Land Trajectories: A Case Study From India Using A Remote Sensing Based Approach”. European Journal of Geography, 7(2), pp.61-71, 2016.