ABSTRACT
WRIGHT, NATALIE ANN. New Strategy, Old Question: Using Multidimensional Item Response Theory to Examine the Construct Validity of Situational Judgment Tests. (Under the direction of Dr. Adam W. Meade).
Situational judgment tests (SJTs) are common in many organizational selection systems, as they have demonstrated high criterion-related validity in predicting job
performance (e.g., Chan & Schmitt, 2002; Christian, Edwards, & Bradley, 2010; Clevenger, Pereira, Wiechmann, Schmitt, & Harvey, 2001; McDaniel, Morgeson, Finnegan, Campion, & Braverman, 2001; Motowidlo, Dunnette, & Carter, 1990; Weekley & Jones, 1999).
However, much of the research on SJTs has failed to take a construct-based focus, which has led to a lack of understanding of what constructs SJTs measure (Christian et al., 2010). To complicate efforts at SJT construct validation, SJTs are multidimensional, even at the level of response options (Schmitt & Chan, 2006), and factor analyses of SJT data are generally uninterpretable (Chan & Schmitt, 2002). As pointed out by Cronbach and Meehl (1955), determining the internal structure of a measure is one of the criteria needed for evaluating construct validity. Thus, the inability to evaluate the internal structure of SJTs via factor analytic techniques has severely hampered SJT construct validation attempts.
Multidimensional item response theory (MIRT) holds promise in evaluating SJT construct validity, as can account for within-item multidimensionality better than factor analysis. The present study used both MIRT and factor analysis to analyze SJT data from 1,012 test takers. MIRT and factor analysis were compared in terms of convergent validity of recovered
dimensions with personality and cognitive ability scores, interpretability of recovered
by
Natalie Ann Wright
A dissertation submitted to the Graduate Faculty of North Carolina State University
in partial fulfillment of the requirements for the degree of
Doctor of Philosophy
Psychology
Raleigh, North Carolina 2013
APPROVED BY:
_______________________________ ______________________________
Adam W. Meade, Ph.D. Mark A. Wilson, Ph.D.
DEDICATION
BIOGRAPHY
Natalie Wright grew up in Loveland, Colorado, and graduated from Thompson Valley High School. After spending a year at Lewis and Clark College in Portland, Oregon, she
ACKNOWLEDGEMENTS
I’d like to thank all my friends, family, colleagues, and professors for their guidance and support during graduate school and during the writing of this dissertation. Thank you to my advisor, Dr. Adam Meade, for his advice and mentoring during my time at NC State. He provided me with a wealth of guidance not only on my dissertation, but on my master’s thesis and other research projects as well. Thank you also to my committee members, Drs. Mark Wilson, Bart Craig, and Bob Pond both for their invaluable suggestions on this research, and their excellent teaching and support during my graduate school career.
I owe a debt of gratitude to my parents, Eric and Teri, for their love and support. Throughout my life, they’ve encouraged me to live up to my potential. Without them, I would have never had the motivation to get a Ph.D.
TABLE OF CONTENTS
LIST OF TABLES ... vi
INTRODUCTION...1
SJT validity ...2
Multidimensional item response theory ...7
Research questions ...11
METHOD ...13
Participants ...13
Measures ...14
Analysis ...16
RESULTS ...23
Descriptive statistics and item screening ...23
MIRT model dimensionality ...24
Evaluating presence of testlet effects ...24
CFA model estimation ...25
Construct and criterion-related validity ...27
DISCUSSION ...31
Limitations ...37
Directions for future research ...38
Conclusion ...40
LIST OF TABLES
Table 1. Descriptive statistics ...50
Table 2. Orthogonal versus oblique MIRT model comparisons ...51
Table 3. MIRT model dimensionality determination ...52
Table 4. Three-dimensional MIRT model item parameter estimates ...53
Table 5. Testlet screening model fit results ...54
Table 6. CFA model fit comparisons ...55
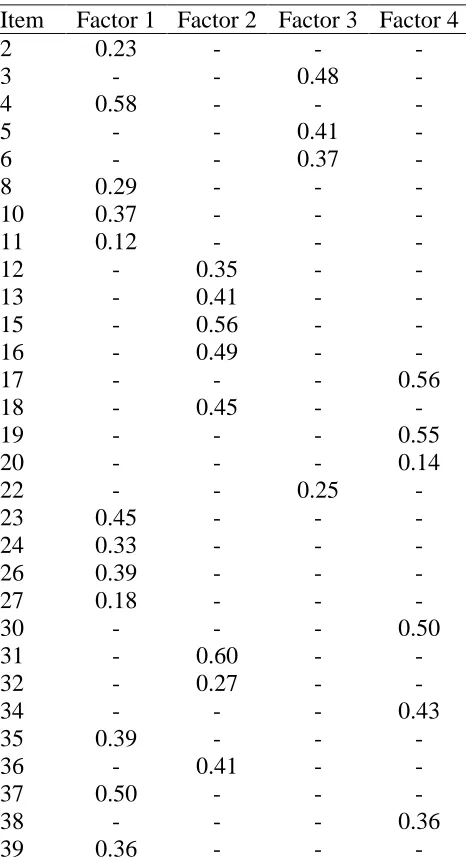
Table 7. CFA standardized factor loadings for 4-factor model...56
Table 8. MIRT dimension construct and criterion-related validity ...57
Table 9. CFA factor construct and criterion-related validity ...58
Table 10. MIRT dimension-CFA factor correlations ...59
Table 11. Hierarchical regression examining prediction of job performance using CFA and MIRT SJT scores ...60
Table 12. Relative weight analysis for CFA and MIRT scores predicting job performance...62
Table 13. Hierarchical regression examining prediction of job performance including overall SJT score ...63
INTRODUCTION
Situational judgment tests (SJTs) are a popular feature of many organizational selection systems, and have accordingly generated a large amount of research. SJTs are “measurement methods that present respondents with work-related situations and ask them how they would or should handle the situations” (Ployhart & MacKenzie, 2011, p. 237). SJTs have relatively high validity for predicting job performance (e.g., Chan & Schmitt, 2002; Christian, Edwards, & Bradley, 2010; Clevenger, Pereira, Wiechmann, Schmitt, & Harvey, 2001; McDaniel, Morgeson, Finnegan, Campion, & Braverman, 2001; Motowidlo, Dunnette, & Carter, 1990; Weekley & Jones, 1999). Despite demonstrating high criterion-related validity, the question of construct validity has continually plagued SJT research and development. SJTs are multidimensional and tend to demonstrate significant correlations with cognitive ability and personality measures (e.g., Chan & Schmitt, 2002; Christian et al., 2010; Clevenger et al., 2001; McDaniel et al., 2001; Weekley & Ployhart, 2005). To further complicate matters, SJTs may be multidimensional not only across items, but within a given item. As Chan and Schmitt (2002) noted, factor analyses of SJTs are generally
uninterpretable, and Schmitt and Chan (2006) suggested that SJTs may be multidimensional even at the level of the item response options. Establishing internal structure is one of the criteria for evaluating a measure’s construct validity (Cronbach & Meehl, 1955). Due to difficulties in evaluating the internal structure of SJTs, the examination of SJT construct validity has been fraught with difficulty.
multidimensional. Although cross-loaded confirmatory factor analysis (CFA) strategies have been proposed for assessing SJT constructs (Ployhart, 2006; Schmitt & Chan, 2006), factor analyses which allow items to cross-load on factors can be difficult to interpret (Schmitt & Chan, 2006). A more appropriate strategy to assess SJT construct validity may be found in multidimensional item response theory (MIRT). Although MIRT is popular in educational applications, it has rarely been applied to problems faced in organizational research and applications (for an exception, see Li, 2010). MIRT assesses the relationship between items and test-takers across multiple dimensions and can account for within-item
multidimensionality (Reckase, 2009). Because of these features, MIRT holds promise in examining the internal structure of SJTs. Thus, the purpose of this study was to investigate the application of MIRT to the evaluation of SJT construct validity.
SJT validity
Criterion-related and incremental validity. Across numerous studies, SJTs have fared well in terms of criterion-related and incremental validity. In the first primary study of SJT criterion-related validity in the industrial-organizational psychology literature,
Motowidlo et al. (1990) found that SJT scores correlated moderately (.28-.37) with
Construct validity. Because SJTs have been shown to be a useful predictor of job performance, there has been a long-standing interest in determining what exactly SJTs measure so that their relationship with job performance can be better understood. Most researchers today are in agreement that SJTs are a method that can be used to measure a variety of different constructs, rather than an indicator of a particular construct (Arthur & Villado, 2008), although Schmitt and Chan (2006) suggest that SJTs might be both constructs and methods. Thus, some differences in the constructs measured across SJTs are expected. However, research has shown substantial commonalities across the constructs measured by SJTs. Most studies that have examined the construct-related validity of SJTs have focused on SJTs’ convergent validity with cognitive ability, the Big Five personality traits (especially conscientiousness, agreeableness, and emotional stability), and practical intelligence or judgment, the results of which will be elaborated upon below.
Cognitive ability. SJT scores have been found to correlate positively with cognitive
ability. Via meta-analysis, McDaniel et al. (2001) concluded that the value for the population correlation between SJT scores and cognitive ability test scores is .46, and McDaniel et al. (2007) found a mean correlation of .32 (uncorrected=.28). In both meta-analyses, there was a substantial amount of variance around this value. To illustrate this variability, consider the correlations between SJT scores and cognitive ability test scores from several primary studies: .42 and .48 (Weekley & Jones, 1999), .36 (Weekley & Ployhart, 2005), and -.02 (Chan & Schmitt, 2002).
Conscientiousness. SJTs have consistently demonstrated moderate, positive
matching approach, found that many SJTs are designed to measure conscientiousness. McDaniel et al. (2007) reported a meta-analytic correlation of .27 (uncorrected = .23) between SJTs and conscientiousness, although there was a significant amount of variability around this estimate. By way of example, reported correlations between SJTs and
conscientiousness range from .33 (O’Connell et al., 2007) to .23 (Chan & Schmitt, 2002) to .13 (Weekley & Ployhart, 2005).
Agreeableness. SJTs demonstrate a moderate correlation with agreeableness.
McDaniel et al. (2007) found a meta-analytic correlation between SJTs and agreeableness of .25 (uncorrected = .22). As is the case with cognitive ability and conscientiousness, this correlation varies significantly across the primary studies investigating the relationship. For example, Weekley and Ployhart (2005) found a correlation of .06 between SJTs and
agreeableness, while Chan and Schmitt (2002) found an SJT-agreeableness correlation of .29. Emotional stability. Along with conscientiousness and agreeableness, emotional
stability has been shown to be related to SJT scores. McDaniel et al. (2007) reported a meta-analytic correlation of .22 (uncorrected = .19) between SJTs and emotional stability. Much like conscientiousness and agreeableness, this correlation is relatively constant across studies. For example, Chan and Schmitt (2002) found a correlation of .20 between SJTs and
emotional stability, while Weekley and Ployhart (2005) found a correlation of .17 between SJTs and emotional stability.
Practical intelligence. Motowidlo et al. (1990) argued that SJT criterion-related
responding to SJT situations is a function of practical intelligence, defined by Schmitt and Chan (2006) as “the ability or expertise to effectively respond and successfully adapt to a variety of practical problems or situational demands” (p. 150). Chan and Schmitt (2002) also suggested that SJTs, although multidimensional, assess practical intelligence to some extent. They also noted that SJTs appear to measure something that is not accounted for by
personality, cognitive ability, and job knowledge measures. In factor analyzing SJT data, they found support for a single factor, but this factor only accounted for a very small
percentage of the variance in SJTs (16% for one SJT version, and 18% for another). Stemler and Sternberg (2006) argue that this factor is practical intelligence. Schmitt and Chan (2006) suggest that this factor might be a method factor, or situational judgment, or practical
intelligence, but acknowledge that it is unclear exactly what the nature of the single factor is. Lingering questions about SJT construct validity. SJTs are generally considered to
be a measurement method rather than a measure of one particular construct (e.g., Arthur & Villado, 2008; McDaniel & Nguyen, 2001). However, it is very difficult to determine what construct(s) a particular SJT is measuring. One potential complication in determining construct validity is that SJTs are low-fidelity simulations (Lievens & Patterson, 2011) made of critical incidents (McDaniel & Nguyen, 2001; Weekley, Ployhart, & Holtz, 2006; Ployhart & MacKenzie, 2011) for the job in question. Jobs differ widely in the knowledge, skills, and abilities required to perform them adequately. As such, an SJT created using critical
is a result of the way in which previous SJT research has been conducted. As noted by Christian et al. (2010), many SJT researchers do not report construct-relevant information, and focus only on SJT-performance relationships. Additionally, although SJTs are viewed as a method rather than a construct, Christian et al. (2010) point out that little work to date has been done to separate construct variance from method variance in SJT scores. They suggest that future SJT research should take a construct, rather than a method, approach to the development of SJTs, both by reporting convergent and discriminant validity evidence and by developing SJTs to measure a particular construct. Even if researchers were to heed this advice, however, the inherent multidimensionality of SJTs makes construct validity
examination extremely difficult. As suggested by Schmitt and Chan (2006), job performance is multidimensional, and as a result SJTs created to accurately sample this criterion will also tend to be multidimensional. Schmitt and Chan (2006) suggest that situational judgment requires multiple traits and abilities, and this multiplicity of traits and abilities required manifests itself on SJTs at the level of the response option.
Unfortunately, most common analysis techniques do a poor job of handling
measuring more than one construct (in other words, SJTs are factorially complex; McDonald, 1999). Incorporating cross-loading items is not an ideal solution, though, as interpreting factors when cross-loaded items are present is difficult (e.g., Judge & Welbourne, 1994; Schmitt & Chan, 2006). Furthermore, generating a substantive interpretation of factors with cross-loaded items has the potential to become very ambiguous if items cross-load on more than two dimensions, or if some items cross-load on only two dimensions while other items cross-load on three or four dimensions. Given the ambiguity associated with interpreting factor analyses that incorporate cross-loaded items, it is clear that this is a less-than-ideal approach for modeling SJT responses. Additionally, as pointed out by Ackerman, Gierl, and Walker (2003) and Embretson and Reise (2000), CFA models often confound difficulty with dimensionality for dichotomous items. This occurs because in factor analysis, the highest correlations between items are observed when items are of equal difficulty (Gulliksen, 1945). Thus, items which are very difficult or very easy will correlate with other items of similar difficulty to a greater extent that than with the other items in the scale, even if the items are all measuring the same underlying dimension. The possibility of these artifactual factors can make it difficult to determine the number of substantive dimensions underlying the data. In order to appropriately model SJTs, it is necessary to use techniques which can model the factorially complex nature of SJT items and responses. Multidimensional item response theory is one analytical technique which can accomplish this.
Multidimensional item response theory
when the items are located along more than one latent dimension (Reckase, 1997). MIRT models are used to model the interaction between test takers and items when an item response requires test takers to use more than one skill or ability (Ackerman, 1994). As discussed by Reckase (1997), MIRT can be viewed as either an extension of unidimensional IRT models, or an extension of factor analysis. MIRT models differ from unidimensional IRT models in that rather than having a single θ-coordinate, they have a linear combination (vector) of θ-coordinates (Reckase, 2009). Lord and Novick (1968) are generally credited with detailing the basic requirements for a MIRT model (Reckase, 2009). These basic requirements included a complete latent space summarized by a θ vector, and local independence in a multidimensional θ space such that the response to one item is independent of the responses to any other item after controlling for item parameters and dimensions in the θ vector (Reckase, 2009).
into a set of common factors, while MIRT does not aim to reduce and group data in this way (Reckase, 2009). MIRT also has the advantage of putting item and person parameters on a common metric to facilitate cross-sample and cross-measure comparisons, which is a feature that factor analysis does not have (Reckase, 2009).
MIRT models can be divided into two classes: those that require simple structure (between-item dimensionality), and those that allow items themselves to be multidimensional (within-item multidimensionality). As discussed by Hartig and Hӧhler (2008), between-item multidimensionality occurs when the test is multidimensional, yet each item only measures one dimension. Within-item multidimensionality occurs when items in the test each measure more than one dimension. Such items are also called factorially complex (Ackerman et al., 2003). Choice of a within-item or between-item model is generally driven by theoretical considerations. If there is reason to believe that more than one skill or ability is required to answer the item, then the within-item model is the preferred choice (Hartig & Hӧhler, 2008).
Parts of MIRT models. A basic representation of a MIRT model is presented by Reckase (2009):
( | ) ( ) (1)
This model demonstrates that the probability of responding to an item (U) given a vector of abilities (θ) is a function of parameters describing the test item (η), and the possible
assumption is seen in the traditional S-shaped curve, which shows the increasing probability of a correct response to an item as θ increases; and this relationship depends on item location (b), item discrimination (a), and the guessing parameter (c). In MIRT models, this
assumption is seen in the item characteristic surface. As MIRT models include more than one θ dimension, the item cannot be represented in two-dimensional space, and must instead be represented by a multidimensional surface, where the number of dimensions are
dependent on the number of elements in the θ vector. Second, item responses are dependent only on a test taker’s θ-vector and the parameters of the item (η), not on the answers to any other item in the test (the local independence assumption; Reckase, 2009).
MIRT models item discrimination (a). Because this parameter is extended into multidimensional θ-space, however, it is conceptualized somewhat differently. MIRT models still incorporate the a parameter, also known as the slope or discrimination parameter (Reckase, 2009), as an indicator of how well the item distinguishes between test takers of different levels of theta. In MIRT, however, a parameters “indicate the orientation of the equiprobable contours and the rate that the probability of a correct response changes from point to point in the θ-space” (Reckase, 2009, p. 89). In other words, MIRT a parameters index how much the probability of answering an item correctly increases as an element in the θ vector increases, and this discrimination is contingent on the direction being travelled in θ space. As is the case with θ parameters, each item in MIRT has a vector of a parameters.
model, as it does not provide a unique location parameter for an item because there are several locations in the θ space which would yield the same result (Reckase, 2009). The
following equation provided by Reckase (2009) summarizes the function of the d parameter:
(2)
In this equation, k is equivalent to the exponent in a MIRT equation. If this exponent is set to 0, then this equation defines the line in θ space along which all locations with a .5 probability of answering the item correctly lie (Reckase, 2009).
MIRT model fit. As with all analytic models, it is necessary to assess the fit of MIRT models. Various global fit indices for MIRT models have been proposed, such as the application of the Akaike Information Criteria and the Bayesian Information Criteria (Bolt & Johnson, 2009), and χ2 difference tests (Yao & Schwarz, 2006). McDonald (2000) suggested that model dimensionality should be determined by substantive or theoretical considerations, but questions about the appropriateness of a specific dimensionality can be answered by testing increasingly complex models until a more complex model either cannot be identified or cannot be interpreted. Ackerman et al. (2003) recommended assessing MIRT model fit by comparing chi square values, or comparing MIRT model fit to unidimensional model fit. Research questions
Research has repeatedly demonstrated that SJTs are multidimensional measurement methods (e.g., Chan & Schmitt, 2002; Christian et al., 2010; Clevenger et al., 2001;
McDaniel et al., 2001; Weekley & Ployhart, 2005). Determining what constructs SJT items measure is of primary importance for using SJTs for personnel selection. Many SJT
McDaniel & Nguyen, 2001; Schmitt & Chan, 2006) have called for more construct-focused SJT research. This construct focus is important for several reasons. First, it is important to understand how and why a predictor relates to job performance (Arthur & Villado, 2008; Christian et al., 2010; Messick, 1995). Second, as demonstrated by Christian et al. (2010), SJTs demonstrate higher criterion-related validity when theory is used to match SJT content to the criterion of interest. Thus, obtaining estimates for test taker ability at the construct level is necessary in order to accurately match SJTs with criteria of interest. A better examination of SJT constructs at the item level would allow for this issue to be examined. Taking a construct-focused approach to SJT research is problematic, however, as SJT items contain within-item multidimensionality which cannot be easily accounted for by factor analysis (Schmitt & Chan, 2006).
MIRT, on the other hand, is a promising analytic method for assessing SJT dimensionality. MIRT can easily incorporate within-item multidimensionality (Hartig & Hӧhler, 2008). However, despite the clear advantages that MIRT offers to SJT researchers, to date little research has incorporated MIRT analyses as a way to investigate the constructs measured by SJTs. One exception is the work of Li (2010), who evaluated MIRT as a method of modeling SJTs. Although Li (2010) found that MIRT was not needed to correctly model SJT data, the model used treated the SJT as measuring a single judgment dimension and several testlet dimensions. No work has been done developing MIRT models which treat SJTs as measures with multiple substantive dimensions. Hence, this study seeks to
Research Question 1. How do the dimensions recovered by MIRT analyses relate to test takers’ scores on cognitive ability and personality measures? That is, do the dimensions recovered by MIRT map onto constructs known to be measured by SJTs, and are they interpretable as such?
Research Question 2. When used to analyze SJT data, how does MIRT compare to factor analytic techniques in terms of the interpretability of recovered factors? Which method offers more useful, interpretable results?
Research Question 3. Do MIRT-based ability estimates yield higher criterion-related validity than a) overall SJT scores, and b) factor analytically-derived factor scores?
METHOD Participants
Data was collected as part of a concurrent validation study for a series of managerial selection measures in 2007 and 2008. Participants included 1,799 front line managers currently employed in the financial, insurance, medical services, automotive, and
problems in the MIRT analyses, all respondents with missing data for the SJT were removed. This resulted in a final sample size of 1,012 participants.
Measures
Situational judgment test. The SJT used in this study was developed specifically for front-line managerial positions, and assesses how effectively managerial personnel interact in coaching situations with their direct reports (SHL, 2008). The stimuli in the SJT were
presented to test takers in a video-based format, and the instructions were knowledge-based. There were 39 SJT items, which were embedded within six scenarios. For each scenario, test takers were presented with a written description of a problem. After reading the scenario, the test takers proceeded onto the associated items. Each item had a short videoclip
these items. To prevent problems in model estimation, score categories with fewer than 20 respondents were collapsed into the next category.
Cognitive ability. The cognitive ability proxy measures used included two inbox (in-basket) assessments targeted specifically toward managerial and supervisory personnel (SHL, 2008). The inbox assessments measure managerial decision-making and monitoring skills. They are a technologically advanced version of in-basket assessments, which are a common type of simulation used in assessment centers. As previous research (e.g., Goldstein, Yusco, Braverman, Smith, & Chung, 1998) has demonstrated a positive correlation between in-basket scores and cognitive ability test scores, scores on the inbox assessments are an
acceptable substitute for cognitive ability scores. During the inbox assessments, participants were told to assume the role of a leader as they respond to requests and information via technological communication methods, such as email.
Personality. The personality test used in this study is a computer adaptive measure targeted specifically toward professional, supervisory, and managerial personnel (SHL, 2009). Because it is computer adaptive, the number of items presented to any one test taker varies, but the maximum number of items that can be presented to a test taker is 300. The test measures achievement, collaboration, composure, confidence, flexibility, independence, influence, innovation, reliability, self-development, sense of duty, sociability, and
thoroughness. These facets can be rationally grouped onto each of the Big Five dimensions of personality in the following way: Conscientiousness (sense of duty, achievement,
independence, thoughtfulness), openness to experience (innovation, self-development, flexibility), and extraversion (sociability, influence).
Job performance. Job performance was assessed via respondents’ supervisory ratings of performance. All ratings of performance were made using the same rating instrument. Job performance was assessed via twenty-seven items assessing specific facets of job performance. These facets included areas such as conflict resolution, teambuilding, problem analysis, leadership, and integrity.
Analysis
MIRT Model. As the SJT in this study required test takers to choose both the best response and the worst response from the options presented, it was necessary to use a partial credit model. This was needed because a test taker could, for example, choose the correct response for the best response but choose the incorrect response for the worst response. Partial credit models can account for situations such as this. The model that was be used to analyze the SJT data in this study was the multidimensional generalized partial credit (MGPC) model. This model is compensatory, such that a high level of one ability can compensate for a low level of another ability (Reckase, 2009; Yao & Schwarz, 2006). The equation for this model as presented by Reckase (2009) is:
( | ) ∑ ∑ ∑
(3)
discrimination parameters, and v represents a θ-vector (Reckase, 2009). One notable feature of this model is β, which is a scalar parameter which functions as a combination of intercept (d) and threshold parameters. Threshold parameters describe the location in θ space at the intersection of two score categories (for example, between earning a score of 1 on the item and earning a score of 2 on the item; Embretson & Reise, 2000). Thus, the difficulty parameters cannot be separated from the threshold parameters in the model, and cannot be subtracted from θ (Reckase, 2009).
Item screening. Prior to the analyses, poor quality items were excluded from the MIRT and CFA models. This screening was done independently for each set of analyses, such that excluded items were not the same for the MIRT analyses and the CFA analyses. To identify poor items for the MIRT analyses, a unidimensional generalized partial credit IRT model was generated. Ten items had a-parameter estimates of less than 0.20. These items also did not meet the assumptions of IRT analyses, as the likelihood of responding to an item in a particular way did not depend on theta. These items were excluded from subsequent analyses. To identify poor items for the CFA analyses, a unidimensional CFA model was conducted. Eight items had non-significant loadings on the single factor and were excluded from further analysis. A ninth item was later removed, as it did not demonstrate significant loadings on final CFA model factors.
display simple structure. Although the program has several options for model estimation, the Metropolis-Hastings Robbins-Monro algorithm (Cai, 2010) was used to estimate the models in the present study. This algorithm is well-suited for estimating models in which there are a large number of dimensions, as it converges faster than other estimation procedures, such as the Markov Chain Monte Carlo method (Cai, 2010). Expected a posteriori (EAP) estimation was used to generate person-level θ estimates.
measuring, 0.20 was a reasonable estimation of the correlation between factors. After an initial run in which all items were allowed to load on all dimensions, each model was refined. First, all negative loadings were fixed to 0. Second, each dimension was defined by ensuring that there were at least two items which loaded solely on that factor, as this improves model estimation (McDonald, 2000). For dimensions in which there were not two naturally-occurring simple structure items, items which had high loadings on that dimension and low loadings on the other dimensions had loadings for the low-loading dimensions fixed to 0. Three different criteria were used to determine the number of dimensions. First, the Akaike Information Criterion (AIC) and the Bayesian Information Criterion (BIC) values were examined, as suggested by Bolt and Johnson (2009) and Yao (2003). Decreasing AIC and BIC values with the addition of an additional dimension are suggestive of improved fit with the additional dimension. Second, likelihood ratio (-2LL) tests, with degrees of freedom equal to the difference between the number of free parameters between the two models being evaluated (de Mars, 2012), were used to examine model fit. Third, model convergence was used as a final indicator of model fit, as McDonald (1999) stated that dimensions can be added one at a time to MIRT models until the model fails to identify.
Screening of SJT data for testlets. The items within the SJT were nested, as items were arranged around six video-based scenarios. This nesting created testlets, or items which shared a common scenario (de Mars, 2012). The common scenario between the items may add additional variance, and this shared variance between items may create nuisance
parameter estimates (e.g., de Mars, 2006; Ip, 2010; Rijmen, 2010). To date, no work has been done in developing models which account for testlets in measures which demonstrate within-item multidimensionality. The bifactor model, discussed by de Mars (2006, 2012) and Rijmen (2010) was determined to hold some promise in being able to account for within-item multidimensionality and testlets. Under the bifactor model, each within-item loads on two dimensions: a substantive dimension, and a single testlet dimension. Loadings on all other testlet dimensions are fixed to zero. Covariances between dimensions are also fixed to zero (de Mars, 2006). Following this logic, an alteration to the model was made to allow for within-item multidimensionality by allowing items to load on multiple substantive dimensions, but allowing each item to load only on one testlet dimension and restricting loadings on all other testlet dimensions to zero.
It is not always necessary to model testlet effects. As noted by de Mars (2012), testlet effects are sometimes very small, and modeling negligible testlet effects can capitalize on error variance and bias parameter estimates. To determine whether it was necessary to account for testlets in the MIRT model, a procedure developed by de Mars (2012) was used. In this procedure, a full bifactor model in which all testlets are accounted for is generated. Then, a second series of all-but-one bifactor models are generated. In this series of models, in each model one of the testlets is omitted from the model while all other testlets are
omitted testlet is significant. To conduct this analysis, a full bifactor model with all testlets included was modeled based on the results of the best-fitting MIRT model identified in the model estimation process. Then, a series of six all-but-one bifactor models were generated. Each of these models was then compared to the full bifactor model.
CFA model estimation and fit. All factor analytic models were estimated using Mplus version 5.21 (Muthén & Muthén, 2007). As with the MIRT model, dimensionality of the SJT data could not be estimated a priori. Thus, as with the MIRT model, model
incorrect response option for the least effective action. A test taker could also earn a score of 3 on an item by choosing the second best option for the most effective action and choosing the second-worst option for the least effective action.
Job performance model estimation and fit. As the dimensionality of the job performance ratings was unknown, an EFA utilizing a promax rotation was conducted using one-third of the data to determine dimensionality. As with the SJT analyses, determination of dimensionality was made by examining the eigenvalues and fit statistics for each EFA model. After using the EFA to determine dimensionality, a CFA was conducted on the remaining two-thirds of the data using the dimensionality and factor loadings identified by the EFA model, and factor loadings were adjusted until an adequately-fitting model was obtained. Model fit was evaluated using the chi square goodness of fit value, CFI, TLI, and RMSEA values.
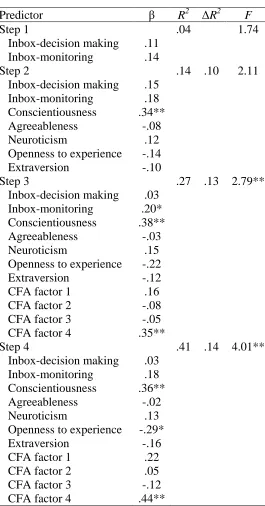
monitoring scores, and Big Five personality scores were added in the second step. CFA factor scores were added in the third step, and MIRT θ scores were added in the fourth step. The second regression analysis was identical for the first two steps, but added overall SJT scores in the third step, CFA factor scores in the fourth step and MIRT θ scores in the fifth step. To further investigate the contributions of each predictor in explaining variance in job performance, relative weight analyses were conducted for both regression models. Relative weight analysis is useful in examining the variance in the dependent variable explained by each predictor when the predictors are correlated (e.g., Tonidandel &LeBreton, 2011). These analyses were completed in the R statistical software program, using code developed by Tonidandel and LeBreton (2011).
RESULTS Descriptive statistics and item screening
MIRT model dimensionality
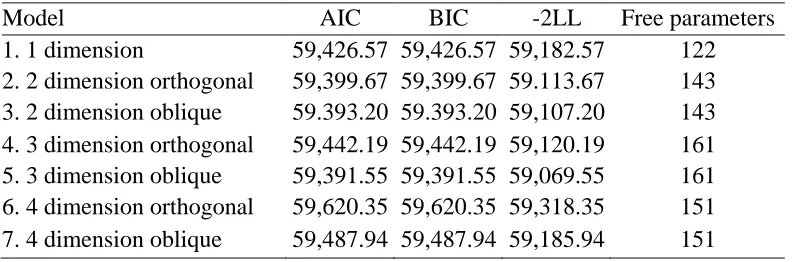
A series of seven multidimensional generalized partial credit (MGPC) models were generated. Models two, four, and six were orthogonal models, in which the covariance between each dimension was fixed to 0. Models three, five, and seven were oblique models, in which the covariance between each dimension was fixed to 0.2. Means were fixed to 0 and variances were fixed to 1 in all models. To determine whether the data was best represented by a model with oblique or orthogonal dimensions, comparisons between orthogonal and oblique models for each type of model were made using the -2LL, AIC and BIC values (note that degrees of freedom between orthogonal and oblique models did not differ, preventing -2LL difference testing). As can be seen in Table 2, -2LL, AIC, and BIC values were lower for the oblique models as compared to the orthogonal models. Thus, oblique models were determined to most accurately model the data.
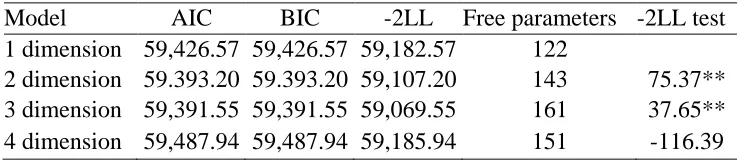
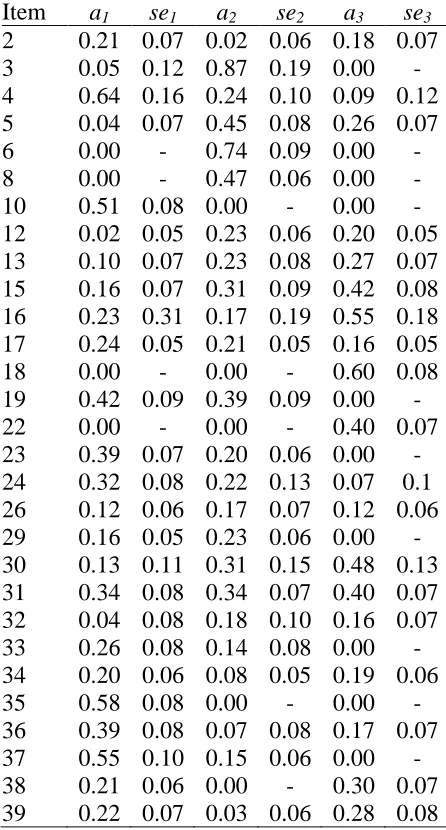
Since oblique models were determined to be a better fit to the data than orthogonal models, oblique models were used to evaluate dimensionality. Several criteria were used to evaluate model fit, including AIC and BIC values, -2LL test values, and convergence. All four models converged on a solution. As can be seen in Table 3, the three-dimensional model was the best fit to the data. Item parameters for the three-dimensional model can be found in Table 4.
Evaluating presence of testlet effects
all testlets included and six all-but-one models which successively eliminated one testlet from each model. Each all-but-one model was compared to the full bifactor model to evaluate model fit (see Table 5). Note that a negative value for the -2LL value indicated a better fit for the full bifactor model, although for the purpose of testing fit this number was changed to a positive value. In three cases, the full bifactor model was a significantly better fit than the all-but-one model, although this difference was only significant for the
comparison with the all-but-one model which was missing testlet one. In the other three cases the all-but-one model was a better fit than the full bifactor model, and this difference was significant for the comparisons with the all-but-one model missing testlet two and the all-but-one model missing testlet five. Because the full bifactor model was a significantly better fit for only one of the full bifactor model - all-but-one model comparisons, it was determined that testlet effects were not significantly large to justify accounting for them in the MIRT model. As pointed out by de Mars (2012), accounting for negligible testlet effects adds unnecessary complexity to the model, and can also bias parameter estimates.
CFA model estimation
EFA. A four-factor model was determined to be the best fit to the data. The
insufficient number of potential indicators. Because of this, the four-factor model was deemed to be a better fit to the data.
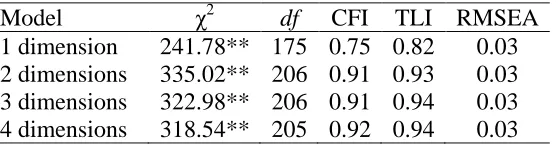
CFA. To verify the fit of the four-dimensional solution identified from the EFA, four different CFA models were fit to the data in the holdout sample: a single factor model, a two-factor model, a three-two-factor model, and a four-two-factor model. The significant two-factor loadings identified from the EFA models were used as a starting point to determine which items loaded on which factor(s), and these were modified until model fit could no longer be improved upon. Fit statistics for the models can be found in Table 6. Although the chi-square value was lowest for the one-factor model, CFA and TLI indices were very low, indicating that the model was a poor fit to the data. The two-factor, three-factor, and four-factor models all fit the data adequately. However, as there was a slight improvement in fit (as evidenced by chi-square and TLI values) between the two-dimensional model and the three-dimensional model, and between the three-dimensional model and the four-dimensional model, the four-dimensional model was determined to be the best fit to the data. Factor loadings for each item in the final four-factor model can be found in Table 7.
Job performance. A single-factor EFA was determined to be the best fit to the data. The eigenvalue for the factor was 16.23. The model was a somewhat poor fit to the data, χ2
(324) = 1,358.48, p < .001, RMSEA=0.06. However, as the eigenvalue for the second factor was only 1.23, additional factors were deemed unnecessary. A single-factor CFA was conducted using the holdout sample. Although the model fit was marginal, χ2(324) =
significant loadings on the factor. Thus, scores on all 27 items were averaged to create a single job performance score.
Construct and criterion-related validity
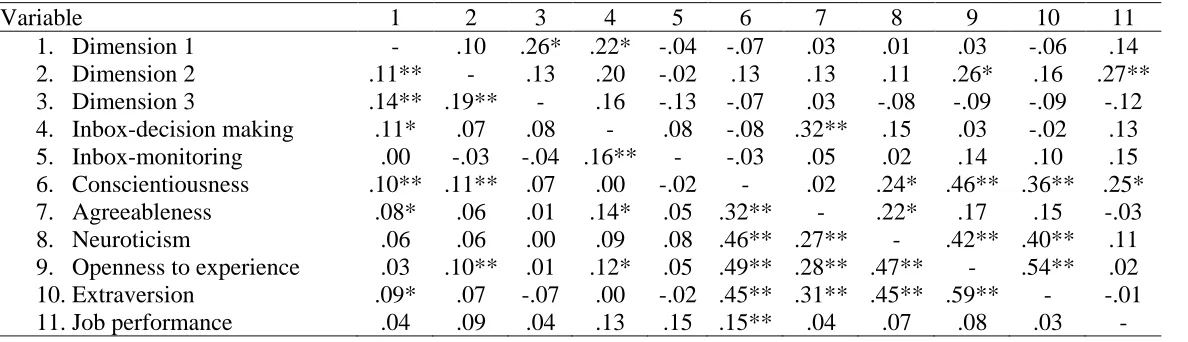
MIRT dimensions. Pearson product-moment correlations were used to evaluate the relationship between θ scores on the dimensions recovered by MIRT analysis and cognitive ability, personality, and job performance (see Table 8). As there were a number of
individuals in the sample without job performance scores, inbox, or personality scores, two different sets of correlations are reported: correlations using pairwise deletion, and
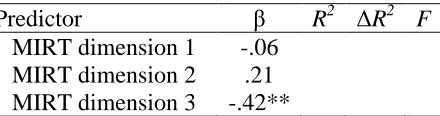
correlations using the more conservative listwise deletion. Examining the pairwise deletion correlations, scores on the first MIRT dimension were significantly correlated with inbox decision-making scores, conscientiousness, agreeableness, and extraversion. Scores on the second MIRT dimension were significantly related to conscientiousness and openness to experience, and scores on the third MIRT dimension were not significantly correlated with any of the inbox or personality variables. None of the MIRT dimension scores were
significantly related to job performance. By comparison, when listwise removal of missing data was used, scores on the first MIRT dimension were significantly related to inbox decision-making scores only, scores on the second MIRT dimension were significantly correlated only with openness to experience, and scores on the third MIRT dimension were not related to any of the personality or inbox variables. Scores on the second MIRT
dimension were also significantly related to job performance.
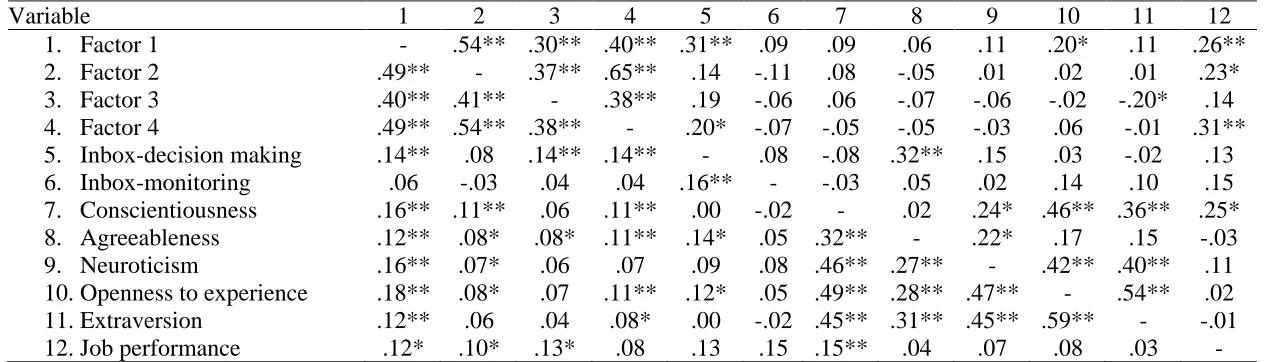
ability, personality scores, and job performance scores (see Table 9). Note that factor scores were created by multiplying the score on each item by its factor loading, summing these scores for all items related to the factor, and then dividing by the number of items which loaded on the factor. Because a number of individuals in the sample were missing job performance, inbox, and/or personality data, correlations using pairwise and listwise deletion are reported. When pairwise deletion was used, there were a number of significant
correlations between factor scores and personality and cognitive ability scores. Scores on the first factor were significantly correlated with all five personality variables and the inbox decision-making scores, scores on the second factor were significantly correlated with conscientiousness, agreeableness, neuroticism, and openness to experience, scores on the third factor were significantly correlated with inbox decision-making scores and
The differences in correlations across the listwise and pairwise deletion results suggest that the relationships between these variables were not homogeneous across all individuals in the sample; that is, there were subgroups within the sample. Clearly,
individuals who were not missing inbox, personality, or job performance data differed in a meaningful way from those who were missing this data. Of the 96 individuals in the sample who were not missing data on any of the assessments, 87 of these individuals were from two organizations. Both of these organizations were involved in customer support for
telecommunication products and services. Thus, the different relationships observed in the listwise correlation results as compared to the pairwise correlation results are likely due to organizational membership. For the two telecommunication customer support organizations, the SJT in this study was predictive of job performance, but did not relate strongly to the inbox and personality variables. It is possible that, due to differences in needed job qualifications, job tasks, and organizational culture, individuals in the telecommunication customer support organizations interpreted the situations presented in the SJT differently than did individuals from the other organizations. Interestingly, despite low correlations with personality and inbox scores, the SJT was more predictive of job performance for individuals from the telecommunication customer support organizations. For these individuals, the SJT may have been measuring a different construct, such as practical intelligence, which was related to job performance.
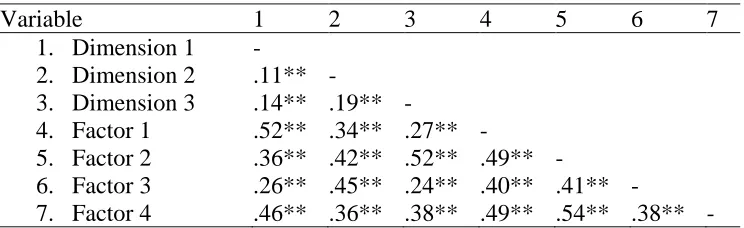
analysis, allowing for the examination of the correlation between dimensions without the attenuation caused by missing data. Table 10 indicates that all MIRT dimensions and CFA factors were significantly correlated with one another.
the R2 value in the third step, the R2 value in the third step to the R2 value in the fourth step, and the R2 value in the fourth step to the R2 value in the fifth step. The addition of the overall SJT scores to the regression model significantly improved the model’s ability to account for variance in job performance, F(1,86) = 9.54, p < .01. The addition of the four CFA factors to the model did not significantly improve the model’s ability to predict job performance above and beyond the overall SJT score, F(4,82) = 1.15, p = .33. However, the addition of the three MIRT dimensions to the model significantly improved the model’s ability to predict job performance above and beyond both overall SJT scores and the four CFA factors, F(3,79) = 6.42, p < .001. The relative weight analysis for the second hierarchical regression model (see Table 14) showed that overall SJT scores were not significant predictors of variance in job performance, but the fourth CFA factor and the third MIRT dimension, along with
conscientiousness, were significant predictors of variance in job performance. DISCUSSION
2006), there is still considerable debate as to what SJTs actually measure. A large part of this debate stems from issues in evaluating the internal structure of SJTs. SJT items are
multidimensional. This within-item multidimensionality makes traditional factor analytic techniques problematic, as the only way to account for within-item dimensionality in factor analysis is to allow items to cross-load on multiple factors (Schmitt & Chan, 2006).
Unfortunately, factors with cross-loaded items are difficult to interpret, and because of this factor analyses of SJT items are difficult to interpret (e.g., Chan & Schmitt, 1997; Chan & Schmitt, 2002; Schmitt & Chan, 2006). The difficulty of interpreting factor analyses of SJTs has made it nearly impossible to determine the internal structure of SJTs. This has in turn hampered researchers’ ability to examine SJT construct validity. Unlike factor analysis, MIRT can easily accommodate within-item multidimensionality (e.g., Hartig & Hӧhler, 2008). MIRT has been shown to be useful in the examination of constructs measured by multidimensional measures (e.g., Schilling, 2007). Because of this, it offers a potentially new analysis method for the evaluation of SJT construct validity.
Results were partially supportive of the mapping of the dimensions recovered by MIRT onto personality and cognitive ability measures. When pairwise deletion was used to account for missing data, test takers’ θ scores on the MIRT dimensions were related to inbox decision- making scores and personality scores. Based on these findings, SJT dimensions exhibited convergent validity with cognitive ability and personality variables, an expected finding given the plethora of research demonstrating relationships between SJT scores, cognitive ability, and personality. However, when listwise deletion was used to account for missing data, the number of correlations between MIRT θ scores and inbox and personality variables was greatly reduced. Test takers’ θ scores on the first MIRT dimension were related to only to inbox decision-making scores, and θ scores on the second MIRT dimension were related only to openness to experience. One potential explanation of these findings is that individuals who were included in the analyses when listwise deletion was used
interpreted the situations presented in the SJT differently, resulting in the measurement of different constructs for these individuals. Listwise deletion reduced the sample size to 96, and these individuals were predominantly from two telecommunication customer support organizations. These individuals may have interpreted the situations presented in the SJT differently than other individuals in the sample due to differences in their job tasks and the culture of their respective organizations, leading to a difference in the construct(s) measured by the SJT. However, because SJT scores for individuals in these organizations were related to job performance, this potential difference in interpretation of the scenarios was not
Schmitt and Chan (2006) suggested that the practical intelligence measured by SJTs is likely distinct from other constructs such as personality and cognitive ability. If MIRT dimensions for this subgroup were in fact related to practical intelligence, then it is not surprising that they were generally unrelated to cognitive ability and personality scores.
Similar differences between correlations using different missing data handling
measuring one or more aspects of practical intelligence in the sample of telecommunications customer support supervisors.
The criterion-related validity of the MIRT dimensions was low when pairwise deletion was used to account for missing data. None of the three MIRT dimensions was significantly related to job performance. A similar situation occurred with scores on the CFA factors, as three of the four CFA factors were only weakly predictive of performance when pairwise deletion was used. However, when listwise deletion was used, θ scores on the second MIRT dimension were significantly related to job performance, and the correlations between scores on three of the CFA factors and job performance increased substantially. Supporting the relationship between CFA and MIRT dimensions and job performance, the results of the first hierarchical regression (which used listwise deletion) demonstrated that both the CFA factor scores and the MIRT θ scores added incremental validity to the
prediction of job performance beyond the inbox and personality test scores. This regression was replicated including overall SJT scores in the third step and CFA factor scores and MIRT θ scores in the fourth and fifth steps, respectively. The R2
value increased
incremental validity to the prediction of job performance above overall SJT scores, personality, and cognitive ability.
Because the SJT dimensions, whether they were obtained via MIRT or CFA, were more predictive of job performance when listwise deletion was used, this suggests that the SJT used in this study was a better match to the job skills required by these individuals than it was for the rest of the sample. The high criterion-related validity observed for both MIRT and CFA dimensions, coupled with the low correlations between MIRT and CFA dimensions and inbox and personality variables, suggests that the SJT may have measured practical intelligence for individuals in the listwise deletion sample. A replication of this research utilizing a practical intelligence or other judgment measure in addition to cognitive ability and personality measures would allow for the evaluation of this possibility.
are incumbents, its construct and criterion-related validity can vary greatly across
organizations. Because SJTs are poorly understood in terms of what constructs they measure (e.g., Christian et al., 2010), care should be taken to gather validity evidence prior to using an SJT for a position or an organization different from that in which it was originally developed and validated. Third, the convergent and criterion-related validity results when listwise deletion was used to account for missing data indicate that SJTs may, at least in some contexts, measure practical intelligence. Despite their lack of interpretability, both CFA factors and MIRT dimensions explained significant variance in job performance when included in a regression model. This, coupled with the convergent validity results, suggests that the SJT in this study was measuring one or more aspects of practical intelligence in the listwise deletion sample. Previous research has offered strong arguments both for (e.g., Schmitt & Chan, 2006; Sternberg & Hedlund, 2002) and against (e.g., McDaniel & Whetzel, 2005) SJTs measuring practical intelligence. The results of the present study offer some support for the idea that SJTs measure practical intelligence.
Limitations
analysis of this complexity. Yao and Broughton (2007) found that when using MCMC estimation methods, parameter recovery was poor when sample sizes were less than 1000. At 1,012, the sample size used in this study was only slightly above that threshold. Thus, it is possible that item parameters may have differed had a larger sample size been used. Third, the job performance measure may have been deficient. Many models of job performance (e.g., Borman & Brush, 1993; Borman & Motowidlo, 1997; Campbell, McCloy, Oppler, & Sager, 1993) conceptualize job performance as being multidimensional. Because the items in the measure used in this study were all indicators of a single job performance construct, the measure likely did not cover the complete criterion space. However, a meta-analysis by Viswesvaran, Schmidt, and Ones (2005) found evidence for a general factor of job
performance in job performance ratings. Based on this finding, Viswesvaran et al. (2005) suggested that utilizing a single, overall measure of job performance is theoretically
justifiable. Thus, the unidimensionality of the job performance measure was unlikely to have greatly influenced the criterion-related validity results obtained in the present study. Finally, job performance, personality, and inbox scores were not available for all individuals in the sample. This affected the correlations between CFA and MIRT SJT dimensions and personality and cognitive ability, and between CFA and MIRT SJT dimensions and job performance.
Directions for future research
The results of this study point to several fruitful avenues for future research. First, the issue of testlets in MIRT, particularly when the model includes within-item
incorporate testlets, such as the bifactor model (de Mars, 2006; de Mars, 2012; Rijmen, 2010), the testlet model, and the second order model (Rijmen, 2010), but these models have been used only with measures which demonstrate simple structure; that is, each item loads only on one primary dimension. There are no existing methods to account for testlets when the measure includes several primary dimensions, and items demonstrate within-item multidimensionality. In the present study, the bifactor model was modified to allow for multiple primary dimensions and within-item multidimensionality. These models converged normally, although the acceptance rate of draws from the Markov chain during the estimation process for these modified bifactor models was below the accepted range of values (0.20-0.30) for the MH-RM algorithm (Cai, 2010). Future simulation studies should be conducted to evaluate under what conditions the modified bifactor model performs adequately in terms of parameter recovery, convergence, and quality of the solution.
In regards to SJTs, one promising direction for future research is to evaluate SJTs as a sample of work performance, rather than as a predictor of performance. Previous research has treated SJTs as predictors of performance. However, SJTs are better viewed as low-fidelity simulations (e.g., Lievens & Patterson, 2011), and measure elements of performance because they are generated using critical incidents (Chan & Schmitt, 2002; Schmitt & Chan, 2006). Thus, SJTs may be measuring performance dimensions, rather than predictor
Conclusion
REFERENCES
Ackerman, T.A. (1994). Using multidimensional item response theory to understand what items and tests are measuring. Applied Measurement in Education, 7, 255-278. doi: 10.1207/s15324818ame0704_1
Ackerman, T.A., Gierl, M.J., & Walker, C.M. (2003). Using multidimensional item response theory to evaluate educational and psychological tests. Educational Measurement: Issues and Practice, 22, 37-53. doi: 10.1111/j.1745-3992.2003.tb00136.x
Arthur, W., & Villado, A.J. (2008). The importance of distinguishing between constructs and methods when comparing predictors in personnel selection research and practice. Journal of Applied Psychology, 93, 435-442. doi: 10.1037/0021-9010.93.2.435 Bolt, D.M., & Johnson, T.R. (2009). Addressing score bias and differential item functioning
due to individual differences in response style. Applied Psychological Measurement, 33, 335-352. doi: 10.1177/0146621608329891
Borman, W.C., & Brush, D.H. (1993). More progress toward a taxonomy of managerial performance requirements. Human Performance, 6, 1-21. doi:
10.1207/s15327043hup0601_1
Borman, W.C., & Motowidlo, S.J. (1997). Task performance and contextual performance: The meaning for personnel selection research. Human Performance, 10, 99-109. doi: 10.1207/s15327043hup1002_3
Cai, L. (2010). Metropolis-Hastings Robbins-Monro algorithm for confirmatory item factor analysis. Journal of Educational and Behavioral Statistics, 35, 307-335. doi:
Cai, L., du Toit, S.H.C., & Thissen, D. (2011). IRTPRO: Flexible, multidimensional, multiple categorical IRT modeling. Chicago, IL: Scientific Software International. Campbell, J.P., McCloy, R.A., Oppler, S.H., & Sager, C.E. (1993). A theory of performance.
In N. Schmitt & W.C. Borman (Eds.), Personnel Selection in Organizations (pp. 35-70). San Francisco, CA: Jossey-Bass.
Chan, D., & Schmitt, N. (1997). Video-based versus paper-and-pencil method of assessment in situational judgment tests: Subgroup differences in test performance and face validity perceptions. Journal of Applied Psychology, 82, 143-159. doi: 10.1037/0021-9010.82.1.143
Chan, D., & Schmitt, N. (2002). Situational judgment and job performance. Human Performance, 15, 233-254. doi: 10.1207/S15327043HUP1503_01
Christian, M.S., Edwards, B.D., Bradley, J.C. (2010). Situational judgment tests: Constructs assessed and a meta-analysis of their criterion-related validities. Personnel
Psychology, 63, 83-117. doi: 10.1111/j.1744-6570.2009.01163.x
Clevenger, J., Pereira, G.M., Wiechmann, D., Schmitt, N., & Harvey, M.S. (2001).
Incremental validity of situational judgment tests. Journal of Applied Psychology, 86, 410-417. doi: 10.1037/0021-9010.86.3.410
Cronbach, L.J., & Meehl, P.E. (1955). Construct validity in psychological tests. Psychological Bulletin, 52, 281-302. doi: 10.1037/h0040957
De Mars, C.E. (2012). Confirming testlet effects. Applied Psychological Measurement, 36, 104-121. doi: 10.1177/0146621612437403
Embretson, S.E., & Reise, S.P. (2000). Item Response Theory for Psychologists. Mahwah, NJ: Lawrence Erlbaum Associates, Inc.
Finch, H. (2011). Multidimensional item response theory parameter estimates with nonsimple structure items. Applied Psychological Measurement, 35, 67-82. doi: 10.1177/0146621610367787
Gessner, T.L., & Klimoski, R.J. (2006). Making sense of situations. In J.A. Weekley & R.E. Ployhart (Eds.), Situational Judgment Tests: Theory, Measurement, and Application (pp. 13-38). Mahwah, NJ: Lawrence Erlbaum Associates, Inc.
Goldstein, H.W., Yusco, K.P., Braverman, E.P., Smith, D.B., & Chung, B. (1998). The role of cognitive ability in the subgroup differences and incremental validity of
assessment center exercises. Personnel Psychology, 51, 357-374. doi: 10.1111/j.1744-6570.1998.tb00729.x
Gulliksen, H. (1945). The relationship of item difficulty and inter-item correlation to test variance and reliability. Psychometrika, 10, 79-91.
Hartig, J., & Hӧhler, J. (2008). Representation of competencies in multidimensional IRT models with within-item and between-item multidimensionality. Journal of Psychology, 216, 89-101. doi: 10.1027/0044-3409.216.2.89
Judge, T.A., & Wellbourne, T.M. (1994). A confirmatory investigation of the dimensionality of the Pay Satisfaction Questionnaire. Journal of Applied Psychology, 79, 461-466. doi: 10.1037/0021-9010.79.3.461
Li, T. (2010). IRT modeling situational judgment tests: Items vs. testlets. Paper presented at the 7th Conference of the International Test Commission, Shatin, Hong Kong.
Lievens, F., & Patterson, F. (2011). The validity and incremental validity of knowledge tests, low-fidelity simulations, and high-fidelity simulations for predicting job performance in advanced-level high-stakes selection. Journal of Applied Psychology, 96, 927-940. doi: 10.1037/a0023496
Lord, F.M., & Novick, M.R. (1968). Statistical theories of mental test scores. Reading, MA: Addison-Wesley.
Lorr, M. (1957). Orthogonal versus oblique rotations. Journal of Consulting Psychology, 21, 448-449.
MacKenzie Jr., W.I., Ployhart, R.E., Weekley, J.A., & Ehlers, C. (2010). Contextual effects on SJT responses: An examination of construct validity and mean differences across applicant and incumbent contexts. Human Performance, 23, 1-21. doi:
10.1080/08959280903400143
McDaniel, M.A., Hartman, N.S., Whetzel, D.L., & Grubb, W.L. (2007). Situational judgment tests, response instructions, and validity: A meta-analysis. Personnel Psychology, 60, 63-91. doi: 10.1111/j.1744-6570.2007.00065.x
of the literature. Journal of Applied Psychology, 86, 730740. doi: 10.1037//0021 -9010.86.4.730
McDaniel, M.A., & Nguyen, N.T. (2001). Situational judgment tests: A review of practice and constructs assessed. International Journal of Selection and Assessment, 9, 103-113. doi: 10.1111/1468-2389.00167
McDaniel, M.A., & Whetzel, D.L. (2005). Situational judgment test research: Informing the debate on practical intelligence theory. Intelligence, 33, 515-525. doi:
10.1016/j.intell.2005.02.001
McDonald, R.P. (1999). Test Theory: A Unified Approach. Mahwah, NJ: Lawrence Erlbaum Associates, Inc.
McDonald, R.P. (2000). A basis for multidimensional item response theory. Applied Psychological Measurement, 24, 99-114. doi: 10.1177/01466210022031552 Messick, S. (1995). Validity of psychological assessment: Validation of inferences from
persons’ responses and performances as scientific inquiry into score meaning. American Psychologist, 50, 741-749. doi: 10.1037/0003-066X.50.9.741
Motowidlo, S.J., Dunnette, M.D., & Carter, G.W. (1990). An alternative selection procedure: The low-fidelity simulation. Journal of Applied Psychology, 75, 640-647. doi:
10.1037/0021-9010.75.6.640
Muthén, L.K., & Muthén, B.O. (2007). Mplus version 5.21. Los Angeles, CA: Muthén & Muthén.
performance. International Journal of Selection and Assessment, 15, 19-29. doi: 10.1111/j.1468-2389.2007.00364.x
Ployhart, R.E. (2006). The predictor response process model. In J.A. Weekley & R.E. Ployhart (Eds.), Situational Judgment Tests: Theory, Measurement, and Application (pp. 83-105). Mahwah, NJ: Lawrence Erlbaum Associates, Inc.
Ployhart, R.E., & MacKenzie Jr., W.I. (2011). Situational judgment tests: A critical review and agenda for the future. In S. Zedeck (Ed.), APA Handbook of Industrial and Organizational Psychology, Volume 2: Selecting and Developing Members for the Organization (pp. 237-252). Washington, D.C.: American Psychological Association. Reckase, M.D. (1997). The past and future of multidimensional item response theory.
Applied Psychological Measurement, 21, 25-36. doi: 10.1177/0146621697211002 Reckase, M.D. (2009). Multidimensional Item Response Theory. New York, NY: Springer. Rijmen, F. (2010). Formal relations and an empirical comparison among the bi-factor, the
testlet, and a second-order multidimensional IRT model. Journal of Educational Measurement, 47, 361-372. doi: 10.1111/j.1745-3984.2010.00118.x
Schilling, S.G. (2007). The role of psychometric modeling in test validation: An application of multidimensional item response theory. Measurement: Interdisciplinary Research and Perspective, 5, 93-106. doi: 10.1080/15366360701487021
SHL (2008). Front line manager and supervisor standard solutions technical manual. Roswell, GA: Author.
SHL (2009). Fact sheet: Global Personality Inventory. Roswell, GA: Author.
Stemler, S.E., & Sternberg, R.J. (2006). Using situational judgment tests to measure practical intelligence. In J.A. Weekley & R.E. Ployhart (Eds.), Situational Judgment Tests: Theory, Measurement, Application (pp. 107-131). Mahwah, NJ: Lawrence Erlbaum Associates, Inc.
Sternberg, R.J., & Hedlund, J. (2002). Practical intelligence, g, and work psychology. Human Performance, 15, 143-160. doi: 10.1207/S15327043HUP1501&02_09
Tonidandel, S., & LeBreton, J.M. (2011). Relative importance analysis: A useful supplement to regression analysis. Journal of Business and Psychology, 26, 1-9. doi:
10.1007/s10869-010-9204-3
Tonidandel, S., & LeBreton, J.M. (2011). Relative importance analysis: Programs for calculating relative weights in in multivariate and logistic regression. Retrieved January 16, 2013 from
http://relativeimportance.davidson.edu/multipleregression.html.
Van der Linden, D., te Nijenhuis, J., & Bakker, A.B. (2010). The general factor of personality: A meta-analysis of Big Five intercorrelations and a criterion-related validity study. Journal of Research in Personality, 44, 315-327. doi:
Veselka, L., Just, C., Jang, K.J., Johnson, A.M., & Vernon, P.A. (2012). The general factor of personality: A critical test. Personality and Individual Differences, 52, 261-264. doi: 10.1016/j.paid.2011.10.007
Viswesvaran, C., Schmidt, F.L., & Ones, D.S. (2005). Is there a general factor in ratings of job performance? A meta-analytic framework for disentangling substantive and error influences. Journal of Applied Psychology, 90, 108-131. doi:
10.1037/0021-9010.90.1.108
Weekley, J.A., & Jones, C. (1997). Video-based situational testing. Personnel Psychology, 50, 25-49. doi: 10.1111/j.1744-6570.1997.tb00899.x
Weekley, J.A., & Jones, C. (1999). Further studies of situational tests. Personnel Psychology, 52, 679-700. doi: 10.1111/j.1744-6570.1999.tb00176.x
Weekley, J.A., & Ployhart, R.E. (2005). Situational judgment: Antecedents and relationships with performance. Human Performance, 18, 81-104. doi:
10.1207/s15327043hup1801_4
Weekley, J.A., Ployhart, R.E., & Holtz, B.C. (2006). On the development of situational judgment tests: Issues in item development, scaling, and scoring. In J.A. Weekley & R.E. Ployhart (Eds.), Situational Judgment Tests: Theory, Measurement, and
Application (pp. 157-182). Mahwah, NJ: Lawrence Erlbaum Associates, Inc. Yao, L., & Broughton, K.A. (2007). A multidimensional item response modeling approach
Table 1
Descriptive statistics
Variable N Mean SD
Overall SJT score 1,012 216.27 13.42 CFA score factor 1 1,012 1.69 0.15 CFA score factor 2 1,012 1.70 0.25 CFA score factor 3 1,012 1.66 0.19 CFA score factor 4 1,012 1.70 0.29 MIRT score dimension 1 1,012 0.05 1.01 MIRT score dimension 2 1,012 -0.02 1.03 MIRT score dimension 3 1,012 -0.02 0.96 Inbox decision-making 523 4.30 0.63
Inbox monitoring 523 2.24 0.49
Conscientiousness 757 6.16 0.52
Agreeableness 757 6.10 0.65
Neuroticism 757 5.89 0.55
Openness to experience 757 6.10 0.55
Extraversion 757 6.00 0.62
Job performance 391 4.74 1.05
Table 2
Orthogonal versus oblique MIRT model comparisons
Model AIC BIC -2LL Free parameters
1. 1 dimension 59,426.57 59,426.57 59,182.57 122 2. 2 dimension orthogonal 59,399.67 59,399.67 59.113.67 143 3. 2 dimension oblique 59.393.20 59.393.20 59,107.20 143 4. 3 dimension orthogonal 59,442.19 59,442.19 59,120.19 161 5. 3 dimension oblique 59,391.55 59,391.55 59,069.55 161 6. 4 dimension orthogonal 59,620.35 59,620.35 59,318.35 151 7. 4 dimension oblique 59,487.94 59,487.94 59,185.94 151
Table 3
MIRT model dimensionality determination
Model AIC BIC -2LL Free parameters -2LL test 1 dimension 59,426.57 59,426.57 59,182.57 122
2 dimension 59.393.20 59.393.20 59,107.20 143 75.37** 3 dimension 59,391.55 59,391.55 59,069.55 161 37.65** 4 dimension 59,487.94 59,487.94 59,185.94 151 -116.39
Table 4
Three-dimensional MIRT model item parameter estimates Item a1 se1 a2 se2 a3 se3
Table 5
Testlet screening model fit results
Model BIC -2LL Free parameters -2LL test
Full bifactor model 59,434.75 59,054.75 190
Missing testlet 1 59,436.98 59,066.98 185 -12.23* Missing testlet 2 59,413.65 59,039.65 187 15.10** Missing testlet 3 59,430.74 59,064.74 183 -9.99 Missing testlet 4 59,425.21 59,053.21 186 1.54 Missing testlet 5 59,412.43 59,040.43 186 14.32** Missing testlet 6 59,420.76 59,054.76 183 -0.01