Galaxies
Thesis by David J. Sand
In Partial Fulfillment of the Requirements for the Degree of
Doctor of Philosophy
California Institute of Technology Pasadena, California
2005
c
2005
David J. Sand
Acknowledgements
There are many, many people to thank for this thesis and without them it would
not have been possible.
I have been lucky to have a great advisor in Richard Ellis. During my first
year when I was looking for a research group, he was the only one eager to talk
with me and to offer me a position. Richard was always there to give praise and
sage advice at the right times. He always has the big picture in mind, something
that is easy to miss when you’re buried in data. And he is always out advertising
your work to others. He would also light a fire under my ass when necessary.
One of my greatest mentors here at Caltech has been Tommaso Treu. His
importance can not be overstated. From my first moments joining Richard Ellis’
group until the day before my thesis defense, Tommaso has been there to hear
my concerns, to focus my thoughts, and to calm me down. He has taught me
nearly everything I know about doing science and astronomy. More than that, he
has been a great friend. He and his wife, Stefania Tutino, have always provided
wonderful food and conversation. Thank you so much Tommaso and Stefania. I
hope we stay close.
A separate mention is due to my office mates Kevin Bundy and Stanimir
Metchev, along with my pseudo-office mate Josh Eisner. Thank you for the good
times and the friendship these last several years. I am confident that I have made
life-long friends. I would like to deeply and dearly thank Vivian Castro for her
love during my first year of graduate school and her support ever since. I wish
great things for her. Russel White always gave me the call, with an occasional
chili burger and many, many drinks behind us. I wish to thank Alice Shapley for
always being available to talk, gossip and give advice, even many years after she
left Caltech. I would like to thank Mike Santos and Alison Farmer for many nights
of hours-long conversation. Farmer John, you weren’t a bad roomate either. It
was excellent grabbing coffee and having scientific discussions with Graham Smith.
this thesis could happen. Little Dan and Brian are always up for a chat or some
lunch or even a 40 oz. Good luck, don’t work too hard. Melissa Enoch has always
been a good friend to me, despite the hard time that I give her. Pizza and a movie
was always so great or even a quick run to In n’ Out. We have had our ups and
downs, but hopefully we will continue to be friends.
Thanks go to my thesis committee: Andrew Blain, John Mulchaey and Marc
Kamionkowski. John was always supportive and allowed me to come up to Carnegie
whenever for a quick chat. Marc was the one who encouraged me to switch to
an observational cosmology group and to work with Richard Ellis in particular.
Thanks Marc, I owe you one. Keep listening to hip-hop.
This acknowledgement section would not be complete if I did not thank Ernie
and Ernesto’s lunch truck, who kept my belly happy with good food and were
always friendly. The lunch trucks in Tucson will pale in comparison.
My family deserves particular thanks. My parents have been incredibly
sup-portive all these years. Even though I don’t call enough or let them visit enough,
my love is strong. The free meals were always appreciated as well as the advice
you gave on life in general. Thank you for encouraging me to go to grad school,
for whatever reasons I had.
Finally, I am deeply grateful to my sunshine, Eva Rose Murdock. Thank you
so much for popping into my life out of no where. You have supported and loved
On the Distribution of Dark Matter in Clusters of Galaxies
by
David J. Sand
In Partial Fulfillment of the
Requirements for the Degree of
Doctor of Philosophy
Abstract
The goal of this thesis is to provide constraints on the dark matter density profile
in galaxy clusters by developing and combining different techniques. The work
is motivated by the fact that a precise measurement of the logarithmic slope of
the dark matter on small scales provides a powerful test of the Cold Dark Matter
paradigm for structure formation, where numerical simulations suggest a density
profileρDM ∝r−1 or steeper in the innermost regions.
We have obtained deep spectroscopy of gravitational arcs and the dominant
brightest cluster galaxy in six carefully chosen galaxy clusters. Three of the clusters
have both radial and tangential gravitational arcs while the other three display only
tangential arcs. We analyze the stellar velocity dispersion for the brightest cluster
galaxies in conjunction with axially symmetric lens models to jointly constrain the
dark and baryonic mass profiles jointly. For the radial arc systems we find the inner
dark matter density profile is consistent with ρDM ∝ r−β, with hβi = 0.52+0−0..0505
(68% CL). Likewise, an upper limit on β for the tangential arc sample is found
to be β <0.57 (99% CL). We study a variety of possible systematic uncertainties,
including the consequences of our one-dimensional mass model, fixed dark matter
scale radius, and simple velocity dispersion analysis, and conclude that at most
these systematics each contribute a ∆β∼0.2 systematic into our final conclusions. These results suggest the relationship between dark and baryonic matter in cluster
Recognizing the power of our technique, we have performed a systematic search
of the Hubble Space Telescope Wide Field and Planetary Camera 2 data archive
for further examples of systems containing tangential and radial gravitational arcs.
We carefully examined 128 galaxy cluster cores and found 104 tangential arcs and
12 candidate radial arcs, each of whose length to width ratio exceeds 7.
Twenty-four additional radial arc candidates were identified with smaller length to width
ratios. In order to confirm the nature of these radial arc candidates, we obtained
Keck spectroscopy of 17 candidate radial arcs, suggesting that the contamination
rate from non-lensed objects is ∼30-50%. With this catalog of gravitational arcs, we use the number ratio of radial to tangential arcs as a statistical measure of the
inner logarithmic dark matter slope, β, in galaxy cluster cores. This abundance
ratio is fairly constant across various cluster subsamples partitioned according to
X-ray luminosity and optical survey depth. Using two-component mass models
for cluster cores, we show that the arc statistics in our survey are consistent with
β ∼< 1.6, depending on various assumptions, the most important of which is the stellar mass associated with the brightest cluster galaxy.
Finally, in order to refine and confirm the analysis technique presented for the
six galaxy clusters with gravitational arcs and brightest cluster galaxy dynamics,
and to address several comments on our earlier work, we present a more elaborate
two dimensional lens model of the cluster MS2137 using a newly upgraded
gravita-tional lensing code. We combine these two-dimensional lens model constraints with
the velocity dispersion data of the brightest cluster galaxy to constrain the dark
and baryonic mass profiles jointly. We find the inner dark matter density profile to
be consistent with a distribution with logarithmic inner slopehβi= 0.25+0−0..3512(68% CL) in agreement with the axially symmetric model presented earlier for MS2137
(hβi = 0.57+0−0..1108) with simpler assumptions. However, we do find a significant degeneracy remains between the scale radius,rsc, and inner logarithmic slope,β,
which might be resolved with further lensing data at larger radii. Notwithstanding
this limitation, we conclude that our technique of combining gravitational lensing
clus-ters and that, most likely, a discrepancy remains between numerical predictions in
Contents
1 Introduction 1
1.1 Observational Evidence for Dark Matter . . . 2
1.2 Predictions from Simulations of Structure Formation . . . 6
1.3 The Dark Matter Density Profile on the Dwarf and Normal Galaxy Scale . . . 10
1.4 Measuring the Dark Matter Density Profile in Clusters . . . 13
1.4.1 Gravitational Lensing . . . 14
1.4.2 X-ray measurements of the ICM . . . 18
1.4.3 Dynamics . . . 22
1.5 Goals of this Thesis & Thesis Overview . . . 24
2 The Dark Matter Density Profile of the Lensing Cluster MS2137-23: A Test of the Cold Dark Matter Paradigm∗ 29 2.1 Introduction . . . 30
2.2 Observations . . . 31
2.2.1 Keck Spectroscopy . . . 31
2.2.2 Hubble Space Telescope Imaging . . . 33
2.3 Luminous and Dark Matter Distribution . . . 33
2.3.1 Mass Model . . . 33
2.3.2 Gravitational Lensing . . . 36
2.3.3 Lensing + Dynamics . . . 37
3 The Dark Matter Distribution in the Central Regions of Galaxy
Clusters: Implications for CDM 43
3.1 Introduction . . . 44
3.2 Sample Selection . . . 48
3.3 Imaging Data and Analysis . . . 49
3.3.1 Optical Data . . . 50
3.3.2 Near–Infrared Data . . . 53
3.3.3 Surface Brightness Fitting . . . 54
3.3.4 Critical line determination . . . 56
3.4 Spectroscopic Data and Analysis . . . 56
3.4.1 Data Reduction . . . 57
3.4.2 Redshift Measurements and Stellar Kinematics . . . 59
3.5 Analysis and Results . . . 63
3.5.1 Mass Model and Overview of the Fitting Procedure . . . . 64
3.5.2 Radial Arc Results . . . 66
3.5.3 Tangential Arc Results . . . 69
3.5.4 Summary of Results . . . 71
3.6 Systematics . . . 76
3.6.1 Impact of Cluster Substructure and Ellipticity . . . 76
3.6.2 Velocity Dispersion Measurements & Modeling . . . 82
3.6.3 Other Assumptions and Measurement Uncertainties . . . . 85
3.6.4 Summary of Systematics . . . 87
3.7 Discussion . . . 87
3.7.1 Comparison with Simulations . . . 87
3.7.2 Is the DM Slope Universal? . . . 90
3.8 Summary . . . 90
3.9 Appendix:Analysis Technique . . . 91
3.9.1 Lensing . . . 91
4 A Systematic Search for Gravitationally-Lensed Arcs in the
Hub-ble Space Telescope WFPC2 Archive 97
4.1 Introduction . . . 98
4.2 Cluster Selection . . . 101
4.2.1 Uniform Cluster Subsamples . . . 101
4.2.2 WFPC2 Data Reduction . . . 104
4.3 The Arc Sample . . . 106
4.3.1 Arc Identification . . . 106
4.3.2 Arc Photometry . . . 107
4.3.3 Arc Length-to-Width Ratio . . . 108
4.3.4 Spectroscopic Follow-Up . . . 109
4.3.5 Arc Statistics: A Summary . . . 112
4.4 Deriving Mass Distributions from Arc Statistics . . . 114
4.4.1 Methodology . . . 114
4.4.2 Mass Models . . . 119
4.4.3 Summary of Systematic Effects . . . 124
4.4.4 The Arc Number Ratio . . . 124
4.5 Results . . . 126
4.5.1 Constraints on the Inner DM Slope and the Role of the BCG 126 4.5.2 Additional Uncertainties and Sample Selection Effects . . . 128
4.6 Summary and Prospects . . . 130
4.7 Appendix . . . 131
4.7.1 The Cluster Catalog . . . 131
4.7.2 The Arc Catalog . . . 131
4.7.3 Radial Arc Finding Charts . . . 131
5 Constraints on the DM Halo in MS2137 Using the BCG Velocity Dispersion Profile and a 2D Lensing Analysis 151 5.1 Introduction . . . 152
5.2.1 A Generalized NFW Implementation in LENSTOOL . . . . 155
5.2.2 The Mass Model and Lens Modeling Method . . . 157
5.2.3 Incorporating the Dynamical Constraints . . . 159
5.3 Observational Results . . . 160
5.3.1 Cluster galaxy geometry and fitting . . . 160
5.4 Results . . . 161
5.4.1 MS2137 Multiple Image Interpretation and Final Free Pa-rameter Set . . . 162
5.4.2 Comparison with Sand et al. (2004) . . . 165
5.4.3 Wide Scale Radius Prior . . . 167
5.5 Remaining Systematics . . . 170
5.6 Summary & Future Work . . . 170
5.7 Appendix: Lensing Formalism & the Pseudo-Elliptical gNFW Im-plementation . . . 171
5.7.1 Limitations of Pseudo-Elliptical Treatment . . . 174
6 Future Work 179 6.1 What Theorists Can Do . . . 182
List of Figures
1.1 Dark Matter in Spiral Galaxies . . . 5
1.2 An illustration of the generalized NFW form and numerical simula-tions . . . 8
1.3 A schematic illustrating gravitational lensing . . . 17
1.4 The ACS lensing results for Abell 1689 . . . 19
1.5 The basic observables and results typical for X-ray analyses of clus-ter mass distributions. . . 26
1.6 Galaxy dynamics results for the galaxy cluster Abell 2199 . . . 27
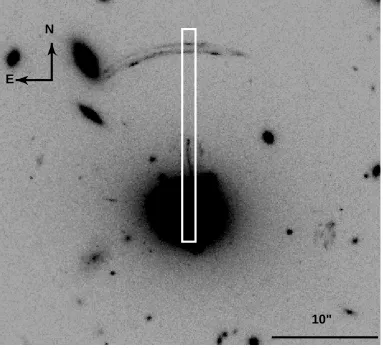
2.1 HST F702W image of MS2137-23. . . 34
2.2 Spectroscopic results for MS2137-23 . . . 35
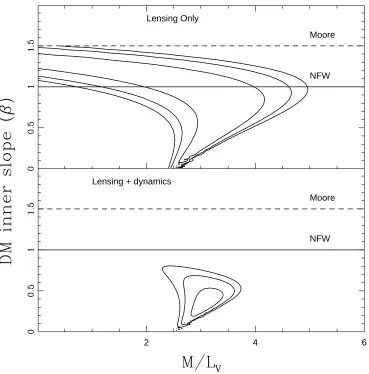
2.3 Likelihood contours (68%, 95%, and 99%) obtained for the mass modeling of MS2137-23 . . . 38
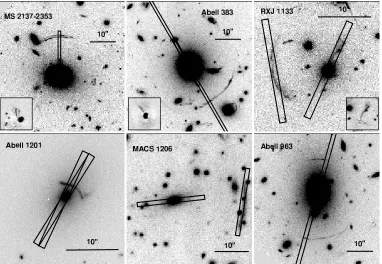
3.1 Images of the six galaxy clusters on which we performed the lensing and dynamical analysis . . . 51
3.2 Surface brightness profile of the BCGs. . . 55
3.3 New gravitational arc redshift measurements. . . 61
3.4 Likelihood contours (68%, 95% and 99%) obtained for the radial arc sample and the tangential arc sample . . . 65
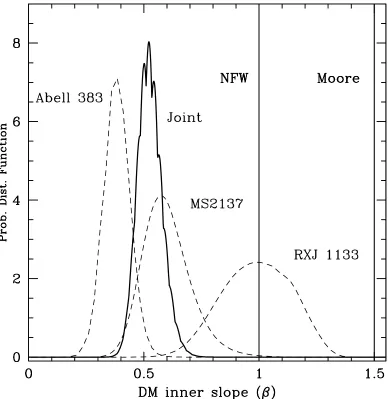
3.5 Probability distribution function of the DM inner density slope for the radial arc sample. . . 67
3.7 The measured velocity dispersion profile for each BCG along with
the best-fitting velocity dispersion profile . . . 72
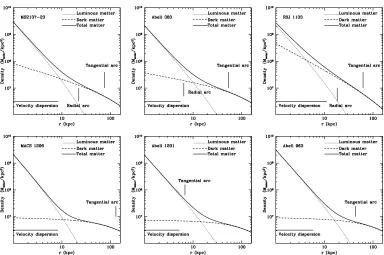
3.8 Best-fitting total density profile for the entire sample. . . 75
3.9 The central region of Abell 383 as seen with HST WFPC2 with overlaidlenstool analysis . . . 78
3.10 Comparison between the 1D models and the 2D check performed with thelenstool software package. . . 81
3.11 Some systematic tests of the mass model for Abell 383 . . . 83
4.1 Histogram illustrating the number of clusters in the sample as a function of redshift. . . 102
4.2 An example of galaxy subtraction performed to secure photometry and length to width ratio for the arcs in Abell 383. . . 105
4.3 New gravitational arc redshift measurements. . . 113
4.4 An illustration of how the tangential arc cross section is found. . . 116
4.5 The radial arc cross section as a function of source size. . . 118
4.6 The radial to tangential cross section ratio as a function of back-ground source redshift while varying the concentration parameter of the DM halo. . . 120
4.7 The radial to tangential arc cross section ratio as a function of back-ground source redshift while varying the BCG mass and inner slope of the DM profile. . . 122
4.8 Constraints on the inner DM profile, β, as a function of the BCG mass. . . 125
4.9 Radial arc finding charts . . . 133
5.1 PIEMD fit to the MS2137-23 surface brightness profile . . . 162
5.2 Multiple image interpretation of the cluster MS2137. . . 164
5.4 Uniform prior on scale radius, 50-200 kpc. Constraints on β when a
larger prior on scale radius is taken. Right–A histogram illustrating
the range of ellipticity (in the potential) which correspond to mass
profiles within 3-σ of the best fitting mass profile. The ellipticity in
the potential is tightly clustered around ǫ=0.1, which corresponds
to a surface mass density ellipticity of ∼0.2. . . 169 5.5 Illustration of projected density isocontours for our pseudo-elliptical
generalized NFW parameterization withr/rsc=10.0 andβ=1.0. Note
that as ǫ gets larger, the projected density contours become more
dumb-bell shaped. . . 175
5.6 The ellipticity of the projected density, Σ, as a function of the
el-lipticity in the potential for different values of β. . . 175
5.7 Illustration of the method used to compare a projected density
con-tour using our pseudo-elliptical methodology and a real ellipse. δr/r
characterizes the deviation. See Figure 5.8. This figure is
repro-duced from Golse & Kneib (2002). . . 176
5.8 δr/r as a function of ǫ for a variety of pseudo-elliptical generalized
NFW models with different inner slopes, β. . . 177
5.9 Distance from ellipse center along the minor axis at which Σǫ
be-comes negative. Several example values for different inner dark
matter density slopes, β, are plotted. . . 177
6.1 Constraints on the mass and halo concentration when fitting a
spherical NFW model to an inherently triaxial system. . . 181
6.2 A comparison between the weak-lensing and X-ray mass estimates
(assuming hydrostatic equilibrium) in Abell 2390. . . 185
List of Tables
2.1 Relevant spectro-photometric quantities . . . 42
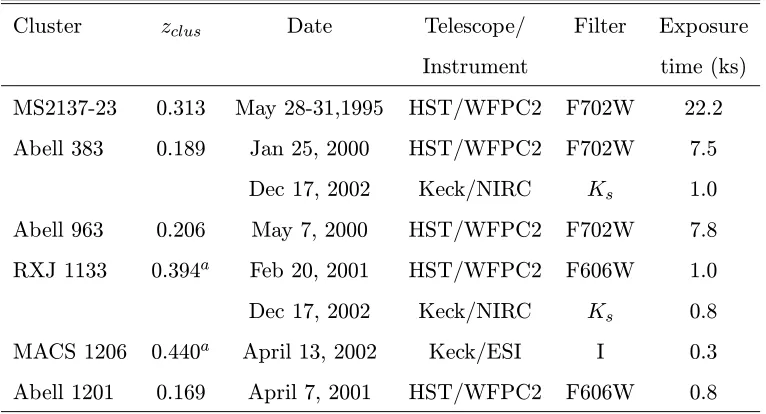
3.1 Optical/NIR Imaging Log . . . 50
3.2 BCG Photometric Properties . . . 52
3.3 Gravitational Arc Properties . . . 57
3.4 Spectroscopic Observation Log . . . 58
3.5 Velocity Dispersion Profiles . . . 62
4.1 New Spectroscopic Observations . . . 110
4.2 Summary of Giant Arcs withL/W >7 . . . 114
4.3 WFPC2 Cluster Catalog . . . 136
4.4 Arc List . . . 141
5.1 Fixed Parameters in MS2137-23 Lens Model . . . 161
Chapter 1
Introduction
One of the great challenges of astrophysics is to understand how galaxies and
galaxy clusters formed and evolved. It is clear that dark matter plays a dominant
role in cosmology and the galaxy formation process (Davis et al., 1985; Percival
et al., 2001; Spergel et al., 2003; Croft et al., 2002; Bahcall et al., 2003), making
the nature of dark matter and its relationship to baryons key to our understanding
of structure formation. The goal of this thesis is to provide new constraints on the
dark matter (DM) density profile in galaxy clusters by developing and combining
different techniques. Why is it important to measure the DM density profile of
galaxy clusters? It is the goal of this introduction to address this question.
This chapter is intended to give a brief overview of the current observational
and theoretical status of DM from the astronomical perspective. Readers
inter-ested in the unknown identity of the dark matter particle and the intensive efforts
underway to uncover it are directed to the recent review by Gaitskell (2004). In
§ 1.1 I will discuss the basic observations and analyses which led to the current view that some form of dark matter is required to make sense of observational
results. Dark matter plays a central role in our understanding of how structure
formed in the universe and the latest dark matter simulations make specific
pre-dictions about the DM density profile and the amount of substructure in halos
ranging in size from dwarf galaxies all the way up to galaxy clusters. It is these
these simulations in context, I briefly discuss the latest results on the DM halos of
dwarf and normal galaxies in§1.3. Most observational work on dark matter halos has been done at the dwarf galaxy scale and has already presented challenges to
the currently favored Cold Dark Matter (CDM) paradigm. Finally, we will discuss
the current observational methods for measuring the dark matter density profile
in galaxy clusters and the latest observational results (§ 1.4) which will inform the discussion presented in the following chapters of this thesis. This chapter will
conclude with a paragraph discussing the structure of this thesis.
1.1
Observational Evidence for Dark Matter
The probable necessity for dark matter dates to the mid-1930’s following
obser-vations of the kinematics of galaxies in the Coma Cluster (Zwicky, 1937). The
results of Zwicky’s observations were verified in other local galaxy clusters, such
as Virgo (e.g. Smith 1936). Equally important, observations of the rotation curves
of disk galaxies also called for some other form of matter besides the luminous
matter (e.g. Rubin et al. 1980). In this section I will briefly present these two
historical observations and the arguments traditionally used that have pointed to
the necessity for dark matter.
It is thought that massive objects such as galaxies and clusters of galaxies are
gravitationally bound systems in equilibrium. There are two lines of evidence that
suggest this. First, the distribution of galaxies in clusters is often characterized
by an increase in the space density of galaxies towards the cluster center with the
density decreasing steadily outwards to that of the background, approximating the
profile of an isothermal gas sphere, which is expected for a system in hydrostatic
equilibrium. Another argument suggesting that clusters are in a gravitationally
bound equilibrium follows by comparing the crossing time of a typical cluster
galaxy with the age of the universe. The crossing time is
where R is the size scale of the cluster and hvi is the velocity dispersion of the consituent galaxies in the cluster. For example, a galaxy cluster with radius ∼1 Mpc and velocity dispersion 103km/s has a crossing time of ∼1 Gigayear. Since the age of the universe is greater than ∼10 Gigayears, it is safe to assume that typical galaxy clusters are gravitationally bound objects, because if they were not,
the system would have flown apart by now. If the cluster is in gravitationally
bound equilibrium then it must obey the virial theorem, which simply states
T = 1/2|U| (1.2)
whereT is the total kinetic energy and|U|is the total potential energy. Translating this into more usable terms for an observational astrophysicist (including the need
to take into account the fact that normally velocities can be measured only along
the line of sight), we get the following relation for the mass of an object that is in
virial equilibrium:
M = 5hv2||iR/G (1.3)
where hv2
||i is the line of sight velocity dispersion. Therefore, by measuring the velocity dispersion of galaxies within a cluster out to high radii, one can accurately
estimate the mass of the galaxy cluster. As was mentioned previously, this was
first done by Zwicky (1937) for the Coma cluster and Smith (1936) for the Virgo
cluster. Both Zwicky and Smith’s results were quite surprising. For example, if
we assume some plausible values for the Coma cluster, that it has a radius of 3
Mpc and velocity dispersion of 1000km/s, along with the fact that the cluster has an optical luminosity of 5×10¹²L⊙ then we would conclude that it has an optical mass-to-light ratio of over 600! Typical M/L for elliptical and S0 galaxies in the
local universe are∼10-15, leading to the direct conclusion that there is much more matter present in clusters than is visible in optical light. Even after taking into
account other forms of baryonic matter (e.g. the hot intracluster medium) and
the shortcomings of this order of magnitude calculation, the discrepancy between
interactions is great.
A further observation that leads to the conclusion that some form of dark
matter is necessary comes from the rotation curves of disk galaxies. By measuring
the rotational velocity of stars (or, if one wants to go even further out, of gas) about
the galaxy’s center as a function of radius, an estimate of the mass distribution
can be made. Up until the 1950’s and 1960’s, the rotation curves of galaxies did
not extend out to radii well beyond those of the stars, and had characteristics that
were roughly compatible with a constantM/L, indicating that no dark matter was
necessary. It was pointed out by Roberts (1975) that these early rotation curves
were inadequate to probe the outer mass distribution of spiral galaxies. However,
hints began to appear that suggested there was more mass in spirals than met the
eye. In an extended optical rotation curve of M31 out to 24 kpc, Rubin & Ford
(1970) noted that the total mass continued to quickly increase despite the steep
falloff in stellar brightness at high radii. As observations improved, it became
apparent that nearly all rotation curves increase at low radii, reach a peak, and
then flatten out to the limits of the observations (Figure 1.1), which when using
the 21cm line as a kinematic tracer, can extend far beyond the edge of the visible
stellar disk (for an early realization of this, see Rogstad & Shostak 1972). Excellent
quality rotation curves of hundreds of spiral galaxies all indicate (unless the galaxy
is significantly disturbed) that they are flat out to the limits of the observations
(e.g. Bosma 1978; Rubin et al. 1980, 1985).
Fairly simply, one can see what the physical implications of flat rotation curves
are on the distribution of mass in galaxies. Using Gauss’ theorem and Newton’s
law of gravity, along with making the assumption that the galaxy we are dealing
with is spherically symmetric (unrealistic, but fine for this illustration), we find
M(≤r) =v2rotr/G (1.4)
whereM(≤r) is the mass enclosed within a given radius, r, andv2
rotis the rotation
Figure 1.1: Left: Neutral hydrogen contours overplotted on an optical image of
the spiral galaxy NGC 3198. Right: The measured rotation curve of NGC 3198
from neutral hydrogen. Note the rapid rise followed by a peak which flattens out
to the limits of the observations. The shape of this rotation curve is typical for
spiral galaxies. This figure is from van Albada et al. (1985).
radius, then M(≤r) ∝ r and the mass increases linearly with radius, unlike the light distribution of disk galaxies, which fall off exponentially (Freeman, 1970).
This implies that the M/L ratio of disk galaxies must increase with increasing
radius, a finding that cannot be reconciled with the data unless some form of dark
matter is invoked.
The high velocity dispersion in galaxy clusters and the flat rotation curves
of spiral galaxies are just two of the many observational facts which lead to the
conclusion that dark matter is necessary. By the late 1970’s, it was quite clear
that there were significant quantities of dark matter in spiral galaxies and clusters
of galaxies, with some hints that dark matter was also present in elliptical galaxies
(for a review at the time, see Faber & Gallagher 1979). Dark matter is now
completely incorporated into modern thought on how galaxies and clusters form
and evolve (e.g. Blumenthal et al. 1984). One of the best tools for studying this
in more detail is through numerical simulations, which will be discussed in the
1.2
Predictions from Simulations of Structure
Forma-tion
The current standard picture for how structures such as galaxies and clusters of
galaxies formed combines an inflationary Universe with the hierarchical growth of
small fluctuations in the initial cosmic mass distribution. This picture includes
not only baryonic matter but also some kind of non-baryonic dark matter (in
addition to some dark energy). Focusing on the topic of this thesis, dark matter,
it should be noted that this dominant mass component in the universe remains
unkown. Throughout the years, numerous properties of the dark matter particle
and its consquences for structure formation have been explored, including warm
dark matter (e.g. Hogan & Dalcanton 2000), scalar field dark matter (e.g. Peebles
2000), and self-interacting dark matter (e.g. Spergel & Steinhardt 2000). However,
both because it accurately reproduces the large scale structure of the universe and
because it is the dark matter candidate most in line with expectations from particle
physics theory, the Cold Dark Matter (CDM) model (first coined by Peebles 1982)
dominates current astrophysical theories.
Cold Dark Matter is collisionless, both with itself and with normal baryons,
and nonrelativistic (hence ’cold’). Cold dark matter generally forms halos which
are triaxial, have dense cores and have significant amounts of gravitationally bound
substructure. The Cold Dark Matter paradigm is extremely successful at
explain-ing the universe on large scales (> a few Mpc; Spergel et al. 2003; Croft et al.
2002; Bahcall et al. 2003). This is not to say that the Cold Dark Matter paradigm
does not have its weaknesses, but it is the current dark matter candidate with the
fewest by far. Alternatives to the standard CDM paradigm are possible that agree
with large scale structure observations but have different properties on scales less
than a megaparsec or so and are occasionally invoked when a set of observations
appears to disagree with CDM. For example, the so-called self-interacting dark
matter candidate (Spergel & Steinhardt, 2000) has a non-negligible cross section
and have less dense cores. However, the self-interacting dark matter scenario may
be ruled out by the ellipticity of dark matter halos inferred through strong lensing
(Miralda-Escud´e, 2002) and estimates of the self-interaction cross section obtained
through cluster-cluster mergers (Markevitch et al., 2004). We will focus in the rest
of this section on Cold Dark Matter (CDM) and the findings of numerical
simula-tions given a CDM dominated universe on relatively small scales, such as that of
galaxies and galaxy clusters (less than a few Mpc). It is on these scales that the
dark matter is strongly nonlinear and slight differences in inherent properties can
have large consequences for the central regions of halos.
The standard tool for predicting the properties of a universe dominated by
CDM is the numerical simulation. These simulations are traditionally
straightfor-ward since gravity is the only physics involved for dark matter. The limitation is
always CPU power in order to get the force resolution necessary to study the very
inner regions of dark matter halos. Early high-resolution simulations of cold dark
matter halos were performed by Frenk et al. (1988); Dubinski & Carlberg (1991);
Warren et al. (1992) whose work studied the structural properties of the halos,
including their core radii, density profiles, and distribution of shapes. However,
these studies were limited by the number of particles and their dynamic range, due
mostly to the limits of computation power at the time.
The series of papers that has given rise to the current era of detailed study
and comparison of CDM halos in simulations with observations were performed
by Navarro et al. (1996, 1997). In this work, Navarro et al. studied many DM
halos with varying mass at relatively low resolution, suggesting that dark matter
halos ranging in size from dwarf galaxies all the way up to galaxy clusters have a
universal density profile, which looks like
ρd(r) =
ρcδc
(r/rsc)(1 + (r/rsc))3
(1.5)
where ρc is the critical density of the universe, δc is the scale of the dark
Figure 1.2: Left Panel– An illustration of the form of the generalized-NFW density
profile with different inner slopes. An observationally derived value ofβsomewhere
in between 1.0 and 1.5 would indicate agreement between numerical simulations
and observations, while any other value would indicate a need to revise the current
form of the Cold Dark Matter paradigm. Right Panel–A dark matter only, high
resolution simulation of a galaxy cluster with approximately the mass of the Coma
cluster, obtained from the web site of the University of Washington numerical
computing web site.
asymptotes toρ ∝r−1, while external to rsc,ρ ∝r−3. The Navarro-Frenk-White
(NFW) dark matter density form has become one of the basic predictions of the
CDM paradigm, despite the fact that more recent work has slightly amended their
results. This landmark work has led to an avalanche of theoretical, numerical, and
observational papers which seek to refine, understand, and test this basic result.
As CPU power and numerical methods have progressed, larger and larger
num-bers of particles have been used to simulate dark matter halos. The convergence
of the simulations has been tested and better understood. Soon after the NFW
results, Moore et al. (1998) used higher resolution simulations and suggested that
the inner DM slope asymptoted to ρ ∝ r−1.5, slightly steeper than the original
NFW. Moore’s work was followed by many others, all with improved resolution,
density profile asymptoted somewhere betweenρ∝r−1.0andρ∝r−1.5(Fukushige & Makino, 1997; Ghigna et al., 2000; Jing & Suto, 2000; Moore et al., 1999b). This
variation in inner slope has led to the use of a more generalized form of the NFW
profile
ρd(r) =
ρcδc
(r/rsc)β(1 + (r/rsc))3−β
(1.6)
This density profile asymptotes to ρ ∝ r−β well within rsc and ρ ∝ r−3 well
outside of it. The generalized NFW DM density profile parameterization is used
throughout this thesis to compare the inner slope seen in simulations with that
observed in galaxy clusters (see Figure 1.2). An observationally derived value
of β somewhere between 1.0 and 1.5 would indicate agreement between numerical
simulations and observations, while any other value would indicate a need to revise
the current form of the Cold Dark Matter paradigm.
The very latest generation of CDM-only simulations have over one million
particles per DM halo in order to resolve the density profile to within 1% of the
virial radius. These simulations seem to indicate that the inner slope does not
asymptote to a particular value but becomes progressively shallower at smaller
radii, with the logarithmic derivative being between -1 and -1.5, as seen in lower
resolution simulations. In addition, enough of these high-resolution halos are being
simulated that the scatter in density profiles can be determined across mass scales
(Fukushige et al., 2004; Navarro et al., 2004; Reed et al., 2003; Tasitsiomi et al.,
2004). This may be the ultimate limit of DM only simulations. Even given that a
suite of these simulations takes several months of dedicated supercomputer time,
to probe the DM halo further requires an equally good knowledge of the baryonic
matter and its effect on the overall density profile. The future of CDM simulations
must include an accurate representation of the baryonic matter as well. Without
it and the physics that baryons contribute, it will be impossible to accurately
compare the very inner density profiles of observed and simulated halos.
Along these lines, hydrodynamic simulations of galaxy clusters that include
into account radiative cooling, star formation, and supernova feedback processes
(Borgani et al., 2004; Nagai & Kravtsov, 2005; Kravtsov et al., 2005), although
problems still remain in producing the basic properties of galaxy clusters (e.g.
Bor-gani et al. 2004). More current simulations try to gauge the effect baryons have on
dark matter profiles. Since baryons tend to cool and collapse, their very presence
in the center of dark matter halos should serve to steepen the density profile and
possibly even make the generalized NFW form invalid (Gnedin et al., 2004). The
effects that cooled baryons have on the ultimate distribution of the central
por-tions of dark matter halos are one of the most exciting avenues of current numerical
simulation work.
It should be noted that there are other predictions for dark matter halos which
arise from CDM numerical simulations besides the universal density profile. For
instance, there are specific predictions on the number of satellite dark halos
sur-rounding and interacting with a parent halo. Known as the substructure problem,
it has been noted that the number of dwarf galaxies surrounding normal galaxies
such as our own are far too few in number to be compatible with the number
seen in numerical simulations (Moore et al., 1999a). However, due to the difficulty
of forming stars in low mass dark matter halos, this is still a subject of vigorous
debate both observationally and theoretically.
1.3
The Dark Matter Density Profile on the Dwarf and
Normal Galaxy Scale
The mass regime in which the dark matter density profile has been studied most
extensively is at the dwarf galaxy scale. Dwarf galaxy mass distributions can be
inferred by measuring the rotation of either the gas withHIor using the stellarHα
emission line. The reason that dwarf galaxies are considered promising candidates
for testing the dark matter density profile predictions from simulations is that
they are thought to be dark matter dominated into the very central regions of the
leads to two advantageous consequences: 1) The mass of stars and gas contribute
little to the actual observed rotation curve and are instead a direct manifestation
of the inner dark matter halo and 2) the cooling and collapse of baryons during
disk formation will not alter the underlying dark matter structure significantly
since the total mass in baryons is small.
Initial HI observations of dwarf galaxies yielded rotation curves which were
well described by dark matter halos with a core rather than a cusp (e.g. de Blok &
McGaugh 1997 and references within), leading to an apparent crisis for the CDM
model (e.g. Flores & Primack 1994; Moore 1994). However, the flat-cored DM
results utilizing HI synthesis observations have been called into question due to
the effect of beam smearing. Both due to intrinsically mediocre angular resolution
and the need to bin the data to get higher signal to noise, the typical effective
beam size used for HI observations is tens of arcseconds across, which is too large
to accurately probe the very inner regions of these dark matter halos. Indeed, this
limited spatial resolution in the inner regions of the halo seems to systematically
bias results towards flatter inner DM slopes (van den Bosch & Swaters, 2001).
More recent work has focused on long-slitHαemission line observations. These
observations can be of relatively high resolution depending on the ground-based
site and their effects can be modeled relatively easily in the analysis, making
Hα rotation curves a superior dark matter density probe. Again, initial results
indicated that dwarf galaxies have rotation curves which are consistent with
flat-core dark matter halos, although some could be described with a cuspy profile (de
Blok et al., 2001; Borriello & Salucci, 2001; de Blok & Bosma, 2002; de Blok et al.,
2003). And again, these results have been called into question after additional,
more thorough analyses have been performed. For example, Swaters et al. (2003)
have taken into account several observational and geometric systematic effects
associated with the modeling of observations such as noncircular motions, galaxy
inclination, slit width, seeing and slit alignment errors and have concluded that
dark matter slopes as steep as that seen by NFW can not be ruled out by the
have performed simulated observations of simulated dark matter halos and have
also concluded that many rotation curves that appear to be caused by flat cored
dark matter halos actually originate from cuspy halos which are triaxial or have
some other dynamical complication. These issues remain a matter of some debate
(de Blok, 2005).
Much work has gone into the dark matter profile at the normal galaxy scale
as well. Unlike with dwarf galaxies, however, baryons play an important role in
the inner regions of the halos, making it necessary to disentangle luminous and
dark matter with multiple mass tracers and possibly to take into account the
gravitational effects that the baryonic halo may have on the dark matter halo.
Degeneracies inevitably remain.
For elliptical galaxies, one can use gravitational lensing or dynamics (or both)
to probe the mass profile. For local galaxies dynamics can be used, and while
dark matter often appears to be necessary, it is difficult to ascertain its properties
given the influence of baryons and the uncertainties surrounding stellar orbits
(e.g. Rix et al. 1997; Gerhard et al. 2001). At higher redshift, it is possible to
combine lensing and dynamics. For example, the Lensing and Dynamics Survey
has sought to understand the relative properties of dark and luminous matter in
ellipticals as a function of redshift using both strong gravitational lensing and the
velocity dispersion profile of the central lens galaxy (Treu & Koopmans, 2004;
Koopmans & Treu, 2002, 2003; Treu & Koopmans, 2002, 2003). They can place
strong constraints on the density profile of the dark matter alone only if the orbits
of the stars are understood (γ is between 0.9 and 1.5, in accordance with the CDM
paradigm, if the stellar orbits are isotropic, where the inner DM density goes like
ρ ∝r−γ). They have robustly determined the total (as opposed to just dark or
luminous) mass density profile in their sample of 5 ellipticals with both lensing
and velocity dispersion data to be slightly shallower than isothermal, along with
an root mean square scatter ofγ ∼0.3. A fair comparison with the CDM paradigm must wait until star formation is robustly incorporated into numerical modeling.
dominated by a baryonic component at small radii. For these systems, the rotation
curve evidence is inconclusive about the slope of the dark matter halo, with the
major degeneracy being between the stellar disk M/L and the dark halo profile.
In two separate studies, Jimenez et al. (2003) and Barnes et al. (2004) could
not distinguish between or could not find good fits for different models of the dark
matter in their high resolution rotation curves of disk galaxies. Dutton et al. (2005)
have presented a thorough discussion of the pitfalls and degeneracies involved in
trying to infer the inner dark matter slope from rotation curves of disk galaxies.
The differing and controversial results at the dwarf and normal galaxy scale
highlight the fact that the predictions of CDM must be tested at multiple mass
scales. It is apparent that the debate on the inner slope of dwarf and normal
galaxy halos will be contentious for some time and that it will be fruitful to look
at the inner slope question at the galaxy cluster scale as well.
1.4
Measuring the Dark Matter Density Profile in
Clus-ters
As we have seen, the Cold Dark Matter paradigm for structure formation has faced
some hurdles on the dwarf to normal galaxy scale. But what about on the scale
of galaxy clusters? Numerical simulations predict that the “universal” DM profile
applies to clusters as well, meaning that the CDM paradigm will not be fully
investigated until the DM density profile in clusters is well characterized. While
in systems such as the local group there appear (without taking into account the
inefficiency of star formation in such low mass objects) to be far fewer satellite
galaxies then are expected from CDM simulations, the same is not true in clusters
of galaxies. In clusters, the number of satellite galaxies seems to be in agreement
with simulations (Moore et al., 1999a). However, the jury is still out on the slope
of the inner dark matter density profile in clusters, which is the focus of this thesis.
One of the great advantages of working at the galaxy cluster scale is that there
from small scales (brightest cluster galaxy dynamics; Kelson et al. (2002)) to
in-termediate scales (strong gravitational lensing; e.g. Broadhurst et al. (2005a) and
out to the virial radius (weak lensing; e.g. Kneib et al. (2003)). It is also
possi-ble to use both X-ray analyses of the intracluster medium (ICM; e.g. Arabadjis
et al. (2004)) and the velocity dispersion profile of the cluster galaxies themselves
(e.g. Lokas & Mamon (2003)). This lends itself to using multiple techniques
simul-taneously and to direct comparisons between methods so that systematics can be
understood and corrected for. I will spend the remainder of the chapter describing
the three main mass measurement techniques utilized at the galaxy cluster scale:
gravitational lensing, galaxy and stellar dynamics, and X-ray measurements of the
intracluster medium (ICM) assuming hydrostatic equilibrium. Each of these
tech-niques has its strengths and weaknesses which I will touch on in these subsections
and throughout this thesis.
1.4.1 Gravitational Lensing
The great strength of using gravitational lensing to probe the mass density profile
of clusters is that lensing can measure mass without regard to the dynamical state
of the cluster. This strength, however, is also its weakness. Since lensing cannot
distinguish between light and dark mass components, another mass tracer is needed
to disentangle luminous from dark matter.
Here we present some basics of strong gravitational lensing. For a more in
depth discussion, the reader is referred to Schneider et al. (1992); Blandford &
Narayan (1992); Narayan & Bartelmann (1996), which were also used as sources
in what follows. Also, a more detailed account of multiple image modeling and
interpretation is presented in Chapter 5.
In a gravitational lensing system, light from a distant object (the “source”) is
deflected by the gravitational potential of an intervening object (the “lens”) on
its way to the observer. In some situations, the gravitational potential of the lens
causes deflections which produce more than one image of the same background
lensing regime and what will be dealt with in this thesis. Throughout this
dis-cussion, the reader is referred to Figure 1.4.1 for a schematic of a typical strong
gravitationally lensed system.
Looking at Figure 1.4.1, and keeping in mind that the angles we are dealing
with are small, it is easy to determine the reduced deflection angle
Dds~αˆ =Dsα~ (1.7)
and from that the “lens equation”:
~
β =~θ−α(~ ~θ) (1.8)
It must be kept in mind that the distances Ds,Dds, and Dl are angular diameter
distances and that in generalDsdoes not equalDds+Dd. The distribution of mass
in the lens determines the deflection angle ~α. The simplest mass distribution toˆ
consider is that of a point mass, which has a deflection angle (according to general
relativity) of
ˆ
α = 4GM
c2ξ (1.9)
where G is Newton’s gravitational constant, c is the speed of light, and M is the
mass of the point mass. The real world presents us with more complex mass
distributions, however, with different masses and distances to the light ray. In
most astrophysical situations (all considered in this thesis) the region over which
the light rays are being bent is much smaller than the distances between the
observer and lens and between lens and source. Given this, the mass distribution
of the lens can be projected along the line of sight and approximated as a single
“lens plane.” We can then write the surface mass density, Σ(~ξ), as
Σ(ξ) =~
Z
ρ(~ξ, z)dz (1.10)
where ρ(~ξ, z) is the three-dimensional mass density of the lens and the integral is
(Equation 1.9) to that of a smooth surface mass distribution, we can integrate over
the entire lensing plane to get
~ˆ α(ξ) =~
Z 4GΣ(ξ~′)(ξ~−ξ~′)
c2|~ξ−ξ~′
|2 d 2ξ′
(1.11)
which effectively is the sum of the deflections due to many point masses.
A special situation arises when the background source and the lens are collinear,
that is,β=0. In this instance, for elliptical or circular lens, the background source
is lensed into a ring known as an Einstein Ring. The radius of the Einstein ring,
along with the redshift of the source and lens, provides a robust measure of the
mass enclosed within the ring. As an example, if we again take the point mass
lens (Equation 1.9), and combine with the lens equation (Equation 1.8), withβ=0,
then we get the following relationship between the mass enclosed and the angle
subtended by the ring
ME =θE2
c2 4G
DdDds
Ds
(1.12)
for circularly symmetric lenses this is a generic result, the Einstein ring always
measures the mass enclosed, and this is nearly true for the elliptical case as well.
The Einstein radius,θE, also provides a good length scale for gravitational lensing.
For multiple imaging systems (those that aren’t necessarily lensed into Einstein
rings) the typical separation between images is ∼ 2θE. The mean surface mass
density within the Einstein ring is called the critical density where
Σcr =
c2 4πG
Ds
DdDds
(1.13)
and is a common scaling factor in lensing analyses.
The modeling of strongly gravitationally lensed systems can provide key
infor-mation on the potential and mass distribution of the lens. The angular position
and radius of background source images is highly dependent on the surface mass
distribution of the lens (see Equation 1.11), which is usually represented as a
Figure 1.3: A schematic illustrating gravitational lensing. This figure has been
reproduced from Narayan & Bartelmann (1996) and is a schematic of a typical
strong gravitational lens system. See text for a discussion.
parameters of these lens models can be varied, and the expected image positions
can be found by solving the lens equation. By comparing the expected image
po-sitions for the model with the observations, constraints on the parameterized lens
model can be found. We will discuss the modeling of lenses and the constraints
that they can provide in Chapter 5.
Lensing has long been recognized as a tool for probing the mass density profile
of clusters. For example, even in the early 1990’s, it was recognized that cluster
MS2137 (which will be studied in several chapters of this thesis) would place tight
constraints on the mass profile (Fort et al., 1992; Mellier et al., 1993). Remarkable
lenses such as Abell 2218 also provided constraints on the mass profile due to the
sheer number of gravitational arcs seen (Kneib et al., 1996). One of the earliest
in a cluster was performed by Tyson et al. (1998), where they found the slope to be
shallower than that predicted, although that result turned out to be controversial
(Broadhurst et al., 2000).
New results on the lensing front have been very exciting with quantitatively
better data and methods being continuously developed. Perhaps the most exciting
recent strong lensing results have come out of the Advanced Camera for Surveys
Guaranteed Time Observations team and their deep imaging of the galaxy cluster
Abell 1689 where over 100 multiple images have been identified (Broadhurst et al.
2005b; see Figure 1.4.1). No thorough analysis of the inner dark matter slope
has been made for this cluster yet, with the existing analysis focusing only on the
NFW profile, although such an analysis would be very interesting. A particular
area of growth has been combining strong and weak lensing analyses. Three recent
studies stand out in particular; that done for the clusters Cl0024 (Kneib et al.,
2003), MS2137 (Gavazzi et al., 2003) and Abell 1689 (Broadhurst et al., 2005a).
The combination of weak and strong lensing is particularly powerful since it can
probe the density profile from ∼10 kpc scales out to ∼1 Mpc, allowing both the inner and outer density profile to be probed and any degeneracy between the two
(due to projection effects) to be partially mitigated. Quite interestingly, the Kneib
et al. (2003) analysis of Cl0024 attempted to constrain the outer slope of the dark
matter density profile, finding that it must fall off more steeply than ρ ∝r−2, in accordance with CDM simulations. A further discussion of these techniques and
the new ACS data will be presented in Chapter 6.
1.4.2 X-ray measurements of the ICM
The gas clouds from which galaxy clusters formed were heated by the energy
of the initial gravitational collapse of the system. For massive systems such as
galaxy clusters, these halos of hot gas are visible in the form of diffuse X-ray
emission. All massive galaxy clusters are intense X-ray emitters, and this emission
is identified as bremsstrahlung of the hot intracluster gas (the temperature of the
Figure 1.4: Left–The ACS composite image of the galaxy cluster Abell 1689. Over
100 images of background sources are identified in the image. Right–A map of the
distortion and magnification induced by the best-fitting lens model of the cluster
Abell 1689 calculated from the positions of the 106 multiple images.
X-ray Observatory, detailed, spatially extended measurements of nearby clusters
with the EINSTEIN X-ray satellite could be made beginning in the late 70’s. With
the advent of the Chandra and XMM-Newton X-ray observatories, the study of
the density profile in galaxy clusters with X-ray measurements is now routine
and provides tight constraints on the mass profile, assuming that the necessary
simplifications are valid.
In order to illustrate the utility of using X-ray data to constrain the mass
density profile in galaxy clusters, I repeat the calculation presented by Fabricant
et al. (1980) for M87 using EINSTEIN X-ray data. In a pioneering work, they
showed that the emission of the gas provides a powerful probe of the cluster’s
gravitational potential. Two crucial assumptions are necessary for this formalism
to work, each of which is certainly not true at some level. First, it has nearly always
been assumed that the cluster is spherically symmetric. Second, the cluster must
be in hydrostatic equilibrium; the pressure of the gas, dark matter and galaxies in
to contract the system. It is still a matter of debate within the literature how
grievous these assumptions are and whether they truly keep one from inferring the
density profile of the cluster. Any number of situations would make the assumption
of hydrostatic equilibrium invalid, most obviously if the cluster were undergoing a
major cluster-cluster merger or if the central AGN of the BCG were a significant
heat source in the inner regions of the cluster.
If we take p as the pressure of the gas and ρ as its density (which can vary
with position in the cluster), the equation for hydrostatic equilibrium reads,
dp dr =−
GM(< r)ρ
r2 (1.14)
where G is Newton’s gravitational constant and M(< r) is the mass enclosed
within the sphere of radiusr. Using the Ideal Gas Law,
p= ρkBT µmH
(1.15)
wheremH is the mass of the hydrogen atom and µ is the mean molecular weight
(normally taken to beµ=0.6 for a fully ionised gas), and differentiating by r, we
have
M(< r) =−kBT r
2 GµmH d(logρ) dr + d(logT) dr (1.16)
Thus, if one had measurements of the gas density and temperature as a function
of radius, then one could determine the mass distribution of the cluster.
Typi-cally, the X-ray image is split up into a series of circular, concentric annuli, with
the spectrum of each annulus compared to a plasma model to infer the gas
den-sity and temperature. Attempts are often made to deproject the data using an
“onion peeling” technique (Buote, 2000). Then, parameterized models are fit to
the gas density and temperature profile so that the derivatives in Equation 1.16
are tractable. In this way, an enclosed mass profile is calculated and compared to
that this technique is really only sensitive to the total mass enclosed within a
given radius and is unable to disentangle luminous from dark matter on its own.
Normally this concern is dismissed because it is believed that galaxy clusters are
dark matter dominated, however there is some indication that in the very central
regions of galaxy clusters the brightest cluster galaxy may be a significant
contrib-utor to the total mass. Therefore, conclusions about the dark matter slope based
on an X-ray analysis alone may need further verification.
The study of galaxy clusters in the X-ray has made great strides with the
ad-vent of the Chandra and XMM-Newton X-ray telescopes. With superb sensitivity
and angular resolution (the resolution of the Chandra Observatory is roughly one
arcsecond, comparable to ground-based optical images), along with spatially
re-solved spectra, these telescopes have uncovered a wealth of interesting phenomena
in cluster cores. In particular, new high resolution observations that the hot gas in
cluster cores is often highly disturbed, exhibiting filaments and holes possibly
re-lated to an AGN in the central galaxy, calls into question the standard assumption
of hydrostatic equilibrium necessary to perform the mass density analysis described
above. Indeed, it is also observed that a high fraction of galaxy clusters appear to
be undergoing significant mergers, again calling into question the assumption of
hydrostatic equilibrium.
Nonetheless, much X-ray work has been done with the mass density of clusters,
with an array of results on the inner slope of the DM halo. Studies have found
values of the logarithmic slope, β, of the DM halo ranging from β ∼ 0.6 (Ettori et al., 2002) through ∼1.2 (Lewis et al., 2003) to ∼1.9 (Arabadjis et al., 2002). This can either mean that the DM density profile in clusters exhibits a wide range
of inner slope, some of which are in conflict with CDM simulations, or that the
assumption of hydrostatic equilibrium is not valid. One promising avenue which
perhaps can avoid questions about the hydrostatic equilibrium of clusters has been
undertaken by David Buote’s group at the University of California Irvine. Their
group is studying clusters which not only appear relaxed on 100 kpc - 1 Mpc scales,
tactic, they seek to avoid clusters which seem to obviously not be in hydrostatic
equilibrium. In the work presented so far, for the clusters Abell 2029 and Abell
2589, they have found that the total matter density profile in these systems has a
inner logarithmic slope ofβ between 1.0 and 1.5, in accordance with CDM
simula-tions. However, on the scales on which they are probing the mass distribution, the
mass of the central BCG is also crucial, and their failure to model and subtract
out its mass may lead to an overestimate of the steepness of the inner DM slope
(see Figure 1.4.2).
1.4.3 Dynamics
The final method useful for probing the density profile in galaxy clusters is through
the velocity dispersion profile of the cluster galaxies themselves within the cluster
potential or, on smaller scales, simply using the velocity dispersion profile of the
stars in the central BCG. Perhaps the best studied cluster is the Coma cluster. The
classic work of Kent & Gunn (1982) initially assembled∼300 galaxy radial veloci-ties. Later, Merritt (1987) illustrated that if a realistic amount of freedom is built
into the models (if mass did not follow light, for example), then there is a strong
degeneracy between the dark matter distribution and the velocity anisotropy of
the system. In fact, it is this degeneracy which continues to limit the ability of
galaxy dynamics alone to constrain the dark matter profile in clusters.
The basic calculations for inferring the mass density profile are similar whether
one is looking at just the stars in the central BCG or are using the cluster galaxies
themselves as tracers of the potential. The assumption of spherical symmetry is
nearly always made because it greatly simplifies the computation of the
line-of-sight velocity dispersion. The model velocity dispersion is computed starting from
the spherical Jeans Equation (Binney & Tremaine, 1987):
dρ∗(r)σr2(r)
dr +
2α(r)ρ∗(r)σ2r(r)
r =−
GMenc(r)ρ∗(r)
r2 (1.17)
enclosed, and σr is the radial velocity dispersion. The anisotropy parameterα(r)
is defined as
α(r)≡1−σ
2
θ(r)
σ2
r(r) ≡
r2 r2+r2
a
(1.18)
whereσθis the tangential component of the velocity dispersion. The final definition
introduces the Opsikov-Merritt (Osipkov 1979; Merritt 1985a,b) parameterization
of anisotropy that is often used in dynamical models. With this parameterization
of the anisotropy, you can derive the radial velocity dispersion (Binney, 1980)
σr2(r) = G
R∞
r dr′ρ∗(r′)Menc(r′) r2
a+r′2
r′2 (r2
a+r2)ρ∗(r)
(1.19)
and the projected velocity dispersion
σp2(R) = 2 (M∗/L)I(R)
Z ∞
R dr
′
"
1− R
2
r2
a+r′2
#
ρ∗(r′)σ2r(r′)r′
(r′2−R2)1/2 (1.20)
with I(R) being the surface brightness profile either of the galaxy distribution in
the cluster or of the BCG, depending on the measurement made. The projected
velocity dispersion,σp, is the quantity measured at the telescope either by
compar-ing the BCG absorption spectrum to broadened stellar templates or by measurcompar-ing
the galaxy velocity dispersion in different radial bins, depending on the program.
Different observational effects may be taken into account in the analysis, with some
discussion presented in Chapter 3.
Since it is difficult to compile the necessary radial velocities in one cluster, it
is common to “stack” the results from many similar clusters. An NFW profile has
been found to be consistent with the total mass distribution through this stacking
technique, whether using the CNOC1 data set (van der Marel et al., 2000) or the
ENACS survey (Biviano & Katgert, 2003), for example. No attempt was made to
disentangle luminous from dark matter in these studies.
One study which did attempt to distinguish between luminous and dark matter
by measuring the extended velocity dispersion profile of the BCG in Abell 2199
by Kelson et al. (2002). The Kelson et al. observations are the current state of the
art in measuring the extended kinematics of massive galaxies. Kelson et al.
con-cluded that the BCG halo is dominated by dark matter outside of 20 kpc, making
it necessary to model both the luminous and dark distributions simultaneously.
When the model was applied, it was found that halos with an inner logarithmic
slope as high as β ∼1.5 were ruled out by the data, and those corresponding to an NFW profile (β ∼ 1.0) would not work unless the stellar contribution of the BCG was unusually low (see Fig. 1.4.3). While this analysis stands out for its
thoroughness, the authors did make the simplifying assumption that the stellar
and galaxy orbits were isotropic. It is not clear that if anisotropy were introduced
if the same results would be had.
1.5
Goals of this Thesis & Thesis Overview
When I set out on this thesis project, its basic goals were:
1. Measure the inner dark matter density logarithmic slope, β, on ∼<100 kpc scales in several galaxy clusters by disentangling luminous from dark matter using
a combination of methods as discussed above.
2. Test the NFW hypothesis that the dark matter density is steeper than
ρDM ∝r−1 on these scales.
3. Make a preliminary measurement of the scatter in inner dark halo density
profiles in order to verify if the profiles are universal.
This was an amibitious task. In the following I demonstrate a technique that
constrains the inner dark matter density slope on these scales, with interesting
results (see Chapter 5). But until this technique is performed on a larger sample
of data, a comment on the scatter will have to wait.
This chapter was meant as a brief introduction to dark matter halos, both
their theoretical and numerical incarnations and what is seen in actual
observa-tions. This thesis describes several different observational studies of the inner dark
struc-ture formation. Chapter 2 presents a combined analysis of the velocity dispersion
profile of the brightest cluster galaxy and lensing in the galaxy cluster MS2137
in order to constrain the dark matter density profile in the cluster. Chapter 3
expands this type of analysis to a sample of galaxy clusters; three of which have
both tangential and radial arcs and three which have only tangential arcs.
Chap-ter 4 presents a systematic search of the HST/WFPC2 archive for gravitational
arcs and use the number ratio of radial to tangential arcs to constrain the typical
dark matter density profile in the galaxy cluster sample. In Chapter 5 a reanalysis
of the combined lensing and dynamical constraints of the galaxy cluster MS2137
is presented. The major thrust of this reanalysis is incorporating elliptical lens
models developed in the LENSTOOL software package into the mass modeling
process, in order to more realistically model the mass components. Finally,
Chap-ter 6 summarizes the maChap-terial covered in this thesis and presents what can be done
in the future to improve on current observations and modeling to better constrain
not only the dark matter density profile in galaxy clusters but the total (dark plus
baryonic) density profile from the very inner regions of the cluster out to the virial
Figure 1.5: This four-part figure illustrates the basic observables and results
typ-ical for X-ray analyses of cluster mass distributions. Top Left–Chandra ACIS
image of Abell 2029. Top Right–Radial gas density profile of Abell 2029 (large
circles) fit to several standard parameterizations. This parameterized fit is then
fed into equation 1.16, along with the temperature profile to calculate the enclosed
mass profile. Bottom Left–The radial temperature profile of Abell 2029, again fit
to a standard paramaterization to facilitate the hydrostatic equilibrium analysis.
Bottom Right– Total enclosed cluster mass profile. The open circles are the data
points and the lines are fits to the data, with the NFW profile being a very good fit.
The upside down triangles show the contribution from the cluster gas mass. Note
that the bright yellow band shows the possible contribution from the cluster BCG,
illustrating the need for an additional technique to account for and disentangle
this important mass component in order to understand the dark matter density
Figure 1.6: Left– An image of the BCG in Abell 2199 with the long slit position
used by Kelson et al. (2002). Right– The observed velocity dispersion profile of
the BCG in Abell 2199 along with cluster member kinematics. Dark matter halos
Chapter 2
The Dark Matter Density Profile of the
Lensing Cluster MS2137-23: A Test of the
Cold Dark Matter Paradigm
∗David J. Sanda, Tommaso Treu & Richard S. Ellis
a
Department of Astronomy, 105-24 California Institute of Technology, Pasadena, CA 91125,
USA
Abstract
We present new spectroscopic observations of the gravitational arcs and the
bright-est cluster galaxy (BCG) in the cluster MS2137-23 (z = 0.313) obtained with
the Echelle Spectrograph and Imager on the Keck II telescope, and find that
the tangential and radial arcs arise from sources at almost identical redshifts
(z = 1.501,1.502). combine The measured stellar velocity dispersion profile of
the BCG was combined with a lensing analysis to constrain the distribution of
dark and stellar matter in the central 100 kpc of the cluster. Our data indicate a
remarkably flat inner slope for the dark matter profile,ρd∝r−β, withβ <0.9 at
99% CL. Steep inner slopes obtained in cold dark matter cosmological simulations
– such as Navarro Frenk & White (β = 1) or Moore (1.5) universal dark matter
profiles – are ruled out at better than 99% CL. As baryon collapse is likely to
have steepened the dark matter profile from its original form, our data provides a
powerful test of the cold dark matter paradigm at the cluster mass scale.
2.1
Introduction
A fundamental result arising from cold dark matter (CDM) numerical simulations
is that the density profiles of DM halos are universal in form across a wide range of
mass scales from dwarf galaxies to clusters of galaxies (Navarro, Frenk, & White,
1997). Internal to some scale radiusrsc, the dark matter profile assumes a power
law formρd∝r−β. While there is some dispute amongst the simulators about the
precise value