w w w . s y n g r e s s . c o m
Syngress is committed to publishing high-quality books for IT Professionals and delivering those books in media and formats that fit the demands of our cus-tomers. We are also committed to extending the utility of the book you pur-chase via additional materials available from our Web site.
SOLUTIONS WEB SITE
To register your book, visit www.syngress.com/solutions. Once registered, you can access our [email protected] Web pages. There you may find an assort-ment of value-added features such as free e-books related to the topic of this book, URLs of related Web sites, FAQs from the book, corrections, and any updates from the author(s).
ULTIMATE CDs
Our Ultimate CD product line offers our readers budget-conscious compilations of some of our best-selling backlist titles in Adobe PDF form. These CDs are the perfect way to extend your reference library on key topics pertaining to your area of expertise, including Cisco Engineering, Microsoft Windows System Administration, CyberCrime Investigation, Open Source Security, and Firewall Configuration, to name a few.
DOWNLOADABLE E-BOOKS
For readers who can’t wait for hard copy, we offer most of our titles in down-loadable Adobe PDF form. These e-books are often available weeks before hard copies, and are priced affordably.
SYNGRESS OUTLET
Our outlet store at syngress.com features overstocked, out-of-print, or slightly hurt books at significant savings.
SITE LICENSING
Syngress has a well-established program for site licensing our e-books onto servers in corporations, educational institutions, and large organizations. Contact us at [email protected] for more information.
CUSTOM PUBLISHING
Many organizations welcome the ability to combine parts of multiple Syngress books, as well as their own content, into a single volume for their own internal use. Contact us at [email protected] for more information.
Harlan Carvey
Windows
Forensic
tively “Makers”) of this book (“the Work”) do not guarantee or warrant the results to be obtained from the Work.
There is no guarantee of any kind, expressed or implied, regarding the Work or its contents.The Work is sold AS IS and WITHOUT WARRANTY.You may have other legal rights, which vary from state to state.
In no event will Makers be liable to you for damages, including any loss of profits, lost savings, or other incidental or consequential damages arising out from the Work or its contents. Because some states do not allow the exclusion or limitation of liability for consequential or incidental damages, the above limitation may not apply to you.
You should always use reasonable care, including backup and other appropriate precautions, when working with computers, networks, data, and files.
Syngress Media®, Syngress®, “Career Advancement Through Skill Enhancement®,” “Ask the Author UPDATE®,” and “Hack Proofing®,” are registered trademarks of Elsevier, Inc. “Syngress:The Definition of a Serious Security Library”™, “Mission Critical™,” and “The Only Way to Stop a Hacker is to Think Like One™”are trademarks of Elsevier, Inc. Brands and product names mentioned in this book are trade-marks or service trade-marks of their respective companies.
KEY SERIAL NUMBER
001 HJIRTCV764 002 PO9873D5FG 003 829KM8NJH2 004 BPOQ48722D 005 CVPLQ6WQ23 006 VBP965T5T5 007 HJJJ863WD3E 008 2987GVTWMK 009 629MP5SDJT 010 IMWQ295T6T PUBLISHED BY Syngress Publishing, Inc. Elsevier, Inc.
30 Corporate Drive Burlington, MA 01803
Windows Forensic Analysis DVD Toolkit
Copyright © 2007 by Elsevier, Inc. All rights reserved. Printed in the United States of America. Except as permitted under the Copyright Act of 1976, no part of this publication may be reproduced or distributed in any form or by any means, or stored in a database or retrieval system, without the prior written per-mission of the publisher, with the exception that the program listings may be entered, stored, and executed in a computer system, but they may not be reproduced for publication.
Printed in the United States of America 1 2 3 4 5 6 7 8 9 0
ISBN 10: 1-59749-156-X ISBN 13: 978-1-59749-156-3
Publisher: Amorette Pedersen Project Manager: Gary Byrne Acquisitions Editor: Andrew Williams Page Layout and Art: Patricia Lupien Technical Editors: Jesse Kornblum, Dave Kleiman Copy Editor: Darlene Bordwell Cover Designer: Michael Kavish Indexer: Michael Ferreira
vii
Author Acknowledgments
First, I’d like to thank God for the many blessings He’s given me in my life, for which I am immensely and eternally grateful. My life has been a wonderful bounty since I accepted Jesus into my heart and my life.
I’d like to thank the love and light of my life,Terri, and her beautiful daughter, Kylie, for their patience and understanding in supporting me while I wrote a second book (as if the first one wasn’t enough!). I know that I’ve left them both wondering as I’ve stared off into space, reasoning and turning over phrases in my mind as I attempted put them down on “paper.” It can’t be easy for either of these two wonderful women to be living with a nerd.
ix
Lead Author
Harlan Carvey(CISSP), author of the acclaimed Windows Forensics
and Incident Recovery, is a computer forensics and incident response consultant based out of the Northern VA/Metro DC area. He cur-rently provides emergency incident response and computer forensic analysis services to clients throughout the U.S. His specialties include focusing specifically on the Windows 2000 and later plat-forms with regard to incident response, Registry and memory anal-ysis, and post-mortem computer forensic analysis. Harlan’s
background includes positions as a consultant performing vulnera-bility assessments and penetration tests and as a full-time security engineer. He also has supported federal government agencies with incident response and computer forensic services.
Harlan holds a bachelor’s degree in electrical engineering from the Virginia Military Institute and a master’s degree in electrical engineering from the Naval Postgraduate School.
x
Jesse D. Kornblumis a Principal Computer Forensics Engineer
with ManTech SMA. He currently develops new computer forensics tools and techniques for members of the Intelligence Community. Based in the Washington, DC, area, he has pioneered several areas of the field, including automated incident response, fuzzy hashing, and Windows memory analysis. In addition, he is the author of several widely used computer forensics tools, such as md5deep and fore-most. Jesse currently sits on the Editorial Board for the journal
Digital Investigationand is a major contributor to the ForensicsWiki Project. His background includes serving as a Computer Crime Investigator with the U.S. Air Force Office of Special Investigations.
Dave Kleiman(CAS, CCE, CIFI, CISM, CISSP, ISSAP, ISSMP,
MCSE) has worked in the information technology security sector since 1990. Currently, he is the owner of SecurityBreach
Response.com and is the Chief Information Security Officer for Securit-e-Doc, Inc. Before starting this position, he was Vice President of Technical Operations at Intelliswitch, Inc., where he supervised an international telecommunications and Internet service provider network. Dave is a recognized security expert. A former Florida Certified Law Enforcement Officer, he specializes in com-puter forensic investigations, incident response, intrusion analysis, security audits, and secure network infrastructures. He has written several secure installation and configuration guides about Microsoft technologies that are used by network professionals. He has devel-oped a Windows operating system lockdown tool, S-Lok (www.s-doc.com/products/slok.asp ), which surpasses NSA, NIST, and Microsoft Common Criteria Guidelines.
Dave was a contributing author to Microsoft Log Parser Toolkit
(Syngress Publishing, ISBN: 1-932266-52-6). He is frequently a speaker at many national security conferences and is a regular
xi
contributor to many security-related newsletters, Web sites, and Internet forums. Dave is a member of several organizations, including the International Association of Counter Terrorism and Security Professionals (IACSP), International Society of Forensic Computer Examiners® (ISFCE), Information Systems Audit and Control Association® (ISACA), High Technology Crime
Investigation Association (HTCIA), Network and Systems
Professionals Association (NaSPA), Association of Certified Fraud Examiners (ACFE), Anti Terrorism Accreditation Board (ATAB), and ASIS International®. He is also a Secure Member and Sector Chief for Information Technology at The FBI’s InfraGard® and a Member and Director of Education at the International Information Systems Forensics Association (IISFA).
Troy Larsonis a Senior Forensic Engineer in Microsoft’s Network
Security team, where he enjoys analyzing Microsoft’s newest tech-nologies in a constant race to keep forensics practice current with Microsoft technology.Troy is a frequent speaker on forensics issues involving Windows and Office, and he is currently focused on developing forensic techniques for Vista and Office 2007. Prior to joining Microsoft’s forensics team,Troy served tours of duty with Ernst & Young’s national forensics practice and Attenex, Inc.Troy is member of the Washington State Bar and received his undergrad-uate and law degrees from the University of California at Berkeley.
xiii
Contents
Preface . . . xix
Chapter 1 Live Response: Collecting Volatile Data . . . 1
Introduction . . . .2
Live Response . . . .2
Locard’s Exchange Principle . . . .4
Order of Volatility . . . .6
When to Perform Live Response . . . .8
What Data to Collect . . . .10
System Time . . . .12
Logged-on Users . . . .14
Psloggedon . . . .14
Net Sessions . . . .14
Logonsessions . . . .15
Open Files . . . .16
Network Information (Cached NetBIOS Name Table) . .17 Network Connections . . . .18
Netstat . . . .19
Process Information . . . .21
Tlist . . . .23
Tasklist . . . .24
Pslist . . . .24
Listdlls . . . .24
Handle . . . .25
Process-to-Port Mapping . . . .28
Netstat . . . .28
Fport . . . .29
Openports . . . .30
Process Memory . . . .31
Network Status . . . .32
Ipconfig . . . .32
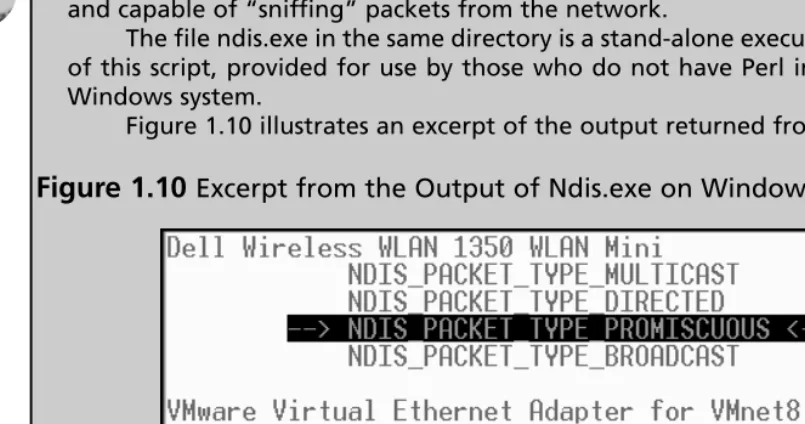
Promiscdetect and Promqry . . . .32
Clipboard Contents . . . .35
Command History . . . .38
Mapped Drives . . . .39
Shares . . . .40
Nonvolatile Information . . . .40
Registry Settings . . . .41
ClearPageFileAtShutdown . . . .41
DisableLastAccess . . . .41
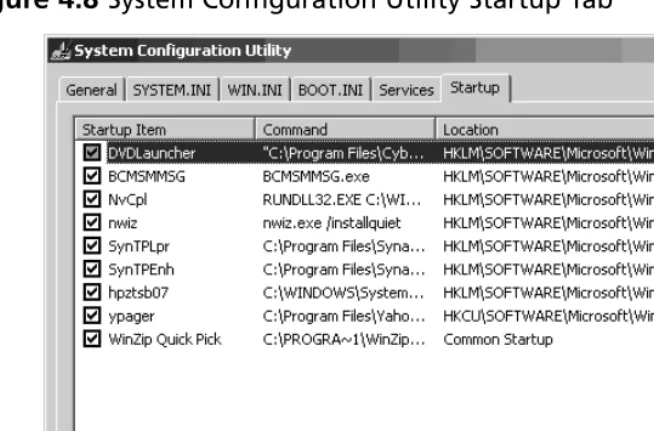
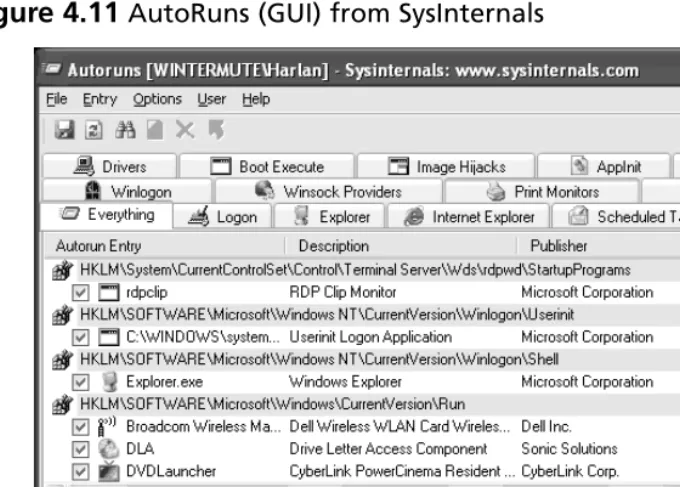
AutoRuns . . . .42
Event Logs . . . .45
Devices and Other Information . . . .46
A Word about Picking Your Tools… . . . .46
Live-Response Methodologies . . . .48
Local Response Methodology . . . .48
Remote Response Methodology . . . .50
The Hybrid Approach . . . .52
Summary . . . .56
Notes . . . .56
Solutions Fast Track . . . .59
Frequently Asked Questions . . . .61
Chapter 2 Live Response: Data Analysis. . . 63
Introduction . . . .64
Data Analysis . . . .64
Example Case 1 . . . .67
Example Case 2 . . . .71
Agile Analysis . . . .75
Expanding the Scope . . . .78
Reaction . . . .80
Prevention . . . .82
Summary . . . .84
Notes . . . .84
Solutions Fast Track . . . .85
Frequently Asked Questions . . . .86
Chapter 3 Windows Memory Analysis . . . 87
Introduction . . . .88
Dumping Physical Memory . . . .89
Hardware Devices . . . .90
FireWire . . . .90
Crash Dumps . . . .92
Virtualization . . . .94
Hibernation File . . . .96
DD . . . .96
Analyzing a Physical Memory Dump . . . .99
Process Basics . . . .100
EProcess Structure . . . .100
Process Creation Mechanism . . . .102
Parsing Memory Contents . . . .103
Lsproc.pl . . . .104
Lspd.pl . . . .107
Parsing Process Memory . . . .109
Extracting the Process Image . . . .111
Memory Dump Analysis and the Page File . . . .114
Determining the Operating System of a Dump File . . .115
Pool Allocations . . . .117
Collecting Process Memory . . . .117
Summary . . . .120
Notes . . . .120
Solutions Fast Track . . . .122
Frequently Asked Questions . . . .123
Chapter 4 Registry Analysis . . . 125
Introduction . . . .126
Inside the Registry . . . .127
Registry Structure within a Hive File . . . .130
The Registry As a Log File . . . .135
Monitoring Changes to the Registry . . . .137
Registry Analysis . . . .139
System Information . . . .140
TimeZoneInformation . . . .142
Shares . . . .142
Audit Policy . . . .143
Wireless SSIDs . . . .144
System Boot . . . .148
User Login . . . .148
User Activity . . . .149
Enumerating Autostart Registry Locations . . . .153
USB Removable Storage Devices . . . .155
USB Device Issues . . . .158
Mounted Devices . . . .160
Finding Users . . . .164
Tracking User Activity . . . .167
The UserAssist keys . . . .168
MRU Lists . . . .172
Search Assistant . . . .175
Connecting to Other Systems . . . .176
IM and P2P . . . .177
Windows XP System Restore Points . . . .178
Summary . . . .184
DVD Contents . . . .184
Notes . . . .185
Solutions Fast Track . . . .187
Frequently Asked Questions . . . .188
Chapter 5 File Analysis . . . 191
Introduction . . . .192
Event Logs . . . .192
Understanding Events . . . .193
Event Log File Format . . . .198
Event Log Header . . . .198
Event Record Structure . . . .200
Vista Event Logs . . . .204
IIS Logs . . . .206
Internet Explorer Browsing History . . . .210
Other Log Files . . . .211
Setuplog.txt . . . .211
Setupact.log . . . .213
SetupAPI.log . . . .213
Netsetup.log . . . .214
Task Scheduler Log . . . .214
Dr. Watson Logs . . . .219
Crash Dump Files . . . .220
Recycle Bin . . . .221
System Restore Points . . . .224
Rp.log Files . . . .224
Change.log.x Files . . . .225
Prefetch Files . . . .226
Shortcut Files . . . .229
File Metadata . . . .230
Word Documents . . . .232
PDF Documents . . . .238
Image Files . . . .239
File Signature Analysis . . . .240
NTFS Alternate Data Streams . . . .241
Creating ADSes . . . .243
Enumerating ADSes . . . .244
Using ADSes . . . .247
Removing ADSes . . . .249
ADS Summary . . . .250
Alternative Methods of Analysis . . . .250
Summary . . . .255
Notes . . . .255
Solutions Fast Track . . . .257
Frequently Asked Questions . . . .258
Chapter 6 Executable File Analysis . . . 261
Introduction . . . .262
Static Analysis . . . .262
Documenting the File . . . .263
Analysis . . . .265
The PE Header . . . .268
Import Tables . . . .275
Export Table . . . .278
Resources . . . .279
Obfuscation . . . .281
Dynamic Analysis . . . .287
Testing Environment . . . .288
Throwaway Systems . . . .290
Tools . . . .291
Process . . . .295
Summary . . . .301
Notes . . . .301
Solutions Fast Track . . . .304
Frequently Asked Questions . . . .305
Chapter 7 Rootkits and Rootkit Detection . . . 307
Introduction . . . .308
Rootkits . . . .308
Rootkit Detection . . . .314
Live Detection . . . .314
RootkitRevealer . . . .316
GMER . . . .317
Helios . . . .318
MS Strider GhostBuster . . . .320
ProDiscover . . . .320
F-Secure BlackLight . . . .321
Sophos Anti-Rootkit . . . .322
AntiRootkit.com . . . .323
Post-Mortem Detection . . . .323
Prevention . . . .326
Summary . . . .328
Notes . . . .328
Solutions Fast Track . . . .329
Frequently Asked Questions . . . .330
The purpose of this book is to address a need. One thing that many computer forensic examiners have noticed is an overreliance by investigators on what forensic analysis tools are telling them, without really understanding where this information is coming from or how it is being created or derived.The age of “Nintendo forensics” (i.e., loading an acquired image into a forensic analysis application and pushing a button) is over. As analysts and examiners, we can no longer expect to investigate a case in such a manner. Cybercrime has increased in sophistication, and investigators need to understand what artifacts are avail-able on a system, as well as how those artifacts are created and modified.With this level of knowledge, we come to understand that the absence of an artifact is itself an artifact. In addition, more and more presentations and material are available regarding anti-forensics, or techniques used to make forensic analysis more difficult. Moreover, there have been presentations at major conferences that discuss the anti-forensic technique of using the forensic analysts’ training and tools against them.This book is intended to address the need for a more detailed, granular level of understanding. It attempts not only to demonstrate what information is available to the investigator on both a live Windows system and in an acquired image but also to provide information on how to locate additional artifacts that may be of interest.
My primary reason for writing this book has been so that I can give back to a community and field of endeavor that has given so much to me. Since I started in the information security field over 10 years ago (prior to that, I was in the military and involved in physical and communications security), I’ve met a lot of great people and done a lot of really interesting things. Over time, people have shared things with me that have been extremely helpful, and some
xix
of those things have served as stepping stones into further research. Some of that research has found its way into presentations I’ve given at various confer-ences, and from there, others have asked questions and provided insight and answers that have helped push that research forward.The repeated exchanging of information and engaging in discussion have moved the interest and the level of knowledge forward, thus advancing the field.
This book is intended to address the technical aspects of collecting and ana-lyzing data during both live and post-mortem investigations of Windows sys-tems. It does not cover everything that could possibly be addressed.There is still considerable room for research in several areas, and a great deal of information needs to be catalogued. My hope is that this book will awaken the reader to the possibilities and opportunities that exist within Windows systems for a more comprehensive investigation and analysis.
Intended Audience
This book focuses on a fairly narrow technical area,Windows forensic analysis, but it’s intended for anyone who does, might do, or is thinking about per-forming forensic analysis of Windows systems.This book will be a useful refer-ence for many, and my hope is that any readers who initially feel that the book is over their heads or beyond their technical reach will use the material they find as a starting point and a basis for questions and further study.When I started writing this book, it was not intended to be a second or follow-on edi-tion to my first book,Windows Forensics and Incident Recovery, which was pub-lished by Addison-Wesley in July 2004. Rather, my intention was to move away from a more general focus and provide a resource not only for myself but also for others working in the computer forensic analysis field.
This book is intended for anyone performing forensic analysis of Windows systems—be they corporate or government investigators, law enforcement offi-cers, or consultants. My hope is that this book will also serve as a useful refer-ence for those developing or attending computer forensic programs at colleges and universities.
Throughout this book, the terms investigator,first responder,examiner, and
administratorare used interchangeably because the same person often may be wearing all of these hats. In other cases, the investigator may come into the cor-porate infrastructure and work very closely with the administrator, even to the point of obtaining an administrator-level account within the domain in order to perform data collection. In some cases, the administrator may escort the investigator or first responder to a compromised system, and the user account may have administrator privileges on that system. Please don’t be confused by the use of the terms; they are synonymous in most cases.
additional modules.You can install these modules by using the Perl Package Manager (PPM) application. PPM is part of the ActiveState distribution of Perl, which is available for Windows, Linux, Mac OS X, and a number of other plat-forms. Another very useful aspect of using Perl is to meet the needs of automa-tion. I often find myself doing the same sorts of things (data extraction,
translation of binary data into something human-readable, etc.) over and over again, and like most folks, I’m bound to make mistakes at some point. However, if I can take a task and automate it in Perl, I can write the code once and not have to be concerned with making a mistake regardless of how many times I perform that same task. It’s easy to correct a process if you actually have a pro-cess—I find it extremely difficult to correct what I did if I don’t know what it was that I did!
You’ll notice that the forensic analysis application used throughout this book is ProDiscover Incident Response Edition, from Technology Pathways. Thanks to Chris Brown’s generosity, I have worked with ProDiscover since Version 3, and I have found the interface to be extremely intuitive and easy to navigate.When it comes to examining images acquired from Windows systems, ProDiscover is an excellent tool to use. It has many useful and powerful fea-tures. Chris and Alex Augustin have been extremely responsive to questions and updates, and Ted Augustin has been an excellent resource when I’ve met him at conferences and had a chance to speak with him (Chris, Alex, and Ted are with Technology Pathways). ProDiscover itself is an excellent analysis platform, and the Incident Response Edition has made great strides into the live response arena, providing an easy, effective means for collecting volatile data. Also, in my opinion, Chris made an excellent decision in choosing Perl as the scripting lan-guage for ProDiscover because Perl enables the investigator to perform func-tions (e.g., searches, data extraction, a modicum of data analysis, etc.) within the image via Perl “ProScripts.”The accompanying DVD contains several
ProScripts that I’ve written and used quite regularly during examinations (please note that though the ProScripts are Perl scripts, they are not “compiled” with Perl2Exe, as the ProScripts must be scripts to be used with ProDiscover).
Organization of This Book
Chapter 1: Live Response: Data Collection
This chapter addresses the basic issues of collecting volatile data from live sys-tems. Because of several factors (an increase in sophistication of cybercrime, increases in storage capacity, etc.), live response has gained a great deal of interest.This increase in interest has not been restricted to consultants (such as myself) either; law enforcement professionals are also beginning to see the need for collecting volatile information from live systems in order to support an investigation.This chapter lists tools and methodologies that you can use to col-lect volatile information. It also presents the current incarnation of the Forensic Server Project.
Chapter 2: Live Response: Data Analysis
I’ve separated data collection and data analysis as I see them as two separate issues. In many cases, the data that you want to collect doesn’t change, as you want to get a snapshot of the activity on the system at a point in time.
However, how you interpret that data is what may be important to your case. Also, it’s not unusual to approach a scene and find that the initial incident report is only a symptom of what is really happening on the system or has nothing to do with the real issue at all. During live response, how you analyze the data you’ve collected, and what you look for, can depend on whether you’re investigating a fraud case, an intrusion, or a malware infection.This chapter presents a framework for correlating and analyzing the data collected during live response in order to develop a cohesive picture of activity on the system and make analysis and identification of the root cause a bit easier and more understandable.
Chapter 3: Windows Memory Analysis
extracted on a much more granular level, even to the point of pulling an exe-cutable image out of the dump file.This chapter discusses the issues of collecting and parsing RAM dumps, as well as extracting the memory used by a specific process from a live system.
Chapter 4: Registry Analysis
The Windows Registry maintains a veritable plethora of information regarding the state of the system, and in many cases, the Registry itself can be treated like a log file because the information that it maintains has a time stamp associated with it in some manner. However, because of the nature of how the data is stored, searches for ASCII or even Unicode strings do not reveal some of the most important and useful pieces of information.This chapter presents the struc-ture of the Registry to the readers so that they’ll be able to recognize Registry artifacts in binary data and unallocated space within an acquired image.The chapter then discusses various artifacts (Registry keys and values) at great length, describing their usefulness and value to an investigation, as well as presenting a number of tools for extracting that information from an acquired image.
Chapter 5: File Analysis
Windows systems maintain a number of log files that many examiners simply are not aware of, and those log files often maintain time-stamp information on the entries that are recorded. In addition, there are a number of files on
Windows systems that maintain time-stamp information within the files them-selves that can be incorporated into your timeline analysis of an event. Many of these time stamps are maintained by the application and are not immediately obvious.Various files, file formats, and file metadata are discussed in detail, and tools are presented for extracting much of the information that is discussed.
Chapter 6: Executable File Analysis
go further in their investigations in determining which files are legitimate, in addition to what effect the suspicious files have on a Windows system. Using the techniques and information presented in this chapter, the examiners can determine which files are legitimate, as well as what artifacts to attribute to a particular piece of malware.
Chapter 7: Rootkits and Rootkit Detection
The final chapter of this book addresses the topic of rootkits in the hopes of piercing the veil of mystery surrounding this type of malware and presenting the administrator, first responder, and forensic analyst (remember, these could all be the same person) with the necessary information to be able to locate and recognize a rootkit. Rootkits are being used increasingly not only in cyber-crime but also in “legitimate” commercial applications. An understanding of rootkits and rootkit detection technologies is paramount for anyone working with Windows systems, and this chapter presents a great deal of the information that an investigator will need.
DVD Contents
The DVD that accompanies this book contains a great deal of useful informa-tion and tools. (An icon appears before secinforma-tions in the book that contain refer-ences to material that is on the DVD.) All the tools provided are grouped into the appropriate directory based on the chapter in which they were presented. There is a directory on the DVD for each of the chapters that contain code or sample files for that chapter (with the exception of Chapter 7). In addition, there is a bonus directory containing several tools that were not specifically dis-cussed in any chapter, but I developed them to meet a need that I had, and I thought that others might find them useful.
All the tools available on the DVD are Perl scripts. However, almost all the Perl scripts have been “compiled” into stand-alone Windows executables for ease of use.The Perl scripts themselves are, for the most part, platform indepen-dent and can be run on Windows, Linux, and even Mac OS X (note that there are some exceptions), and providing Windows executables simply makes them easier for those without Perl installed to use. Several of the chapters also contain ProScripts, which are Perl scripts specifically written to be used with the
(www.techpathways.com).These Perl scripts are launched via ProDiscover and are not “compiled.”
In addition, several of the chapter directories contain sample files that the reader can use to gain a familiarity with the tools.This is particularly the case for Chapter 5,“File Analysis.” It’s one thing to have a tool or utility and an explana-tion of its use, but it’s quite another thing to actually use that tool to derive infor-mation. Having something immediately available to practice with means that the readers can try out the tools anywhere they have a laptop, such as on a plane, and not have to wait until they’re able to get copies of those files themselves.
Finally, I have included several movie files on the DVD that I use to explain certain topics.These video (.wmv) files describe the use of some of the tools presented and discussed in the book.These tools are also available on the DVD itself. In the past, I wrote an appendix to explain the setup and use of the Forensic Server Project, but I’ve found that listening to podcasts and watching movies can be much more educational than reading something in a book.
All the tools provided on the DVD are provided “as is,” with no warrantee or guarantee of their use. All the tools, with the exception of those located in the bonus directory, were mentioned or described in the book.Therefore, you will have some idea of how the tools are used. In all cases, the Perl scripts from which the EXEs were derived are also provided. All the tools are command-line-based (CLI) tools. Double-clicking the icon won’t produce any interesting results. Most of the tools require at least a file name (including the full path) to be entered at the command line. If you have any questions or concerns about the tools, start by looking at the Perl script. Or try typing either the command or the command followed by “-h” at the command line. If you’re still having issues, e-mail me at [email protected] with a concise, complete description of the issue, and we’ll see if we can work it out.
Because of licensing issues, third-party tools produced by others are not provided on the DVD. Instead, I’ve provided links to the tools in the text of the book itself.
Thanks, and I hope you enjoy and find some use from the book. Please feel free to drop me a line with any comments you might have.
Live Response:
Collecting
Volatile Data
Solutions in this chapter:
■ Live Response
■ What Data to Collect
■ Nonvolatile Information
■ Live-Response Methodologies
Chapter 1
1
Summary
Solutions Fast Track
Introduction
More and more, investigators are faced with situations in which the traditional, accepted computer forensics methodology of unplugging the power from a com-puter and then acquiring a bit-stream image of the system hard drive is, quite simply, not a viable option. Investigators and incident responders are also seeing instances in which the questions they have (or are asked) cannot be answered using the contents of an imaged hard drive alone. For example, I’ve spoken with law enforcement offi-cers regarding how best to handle situations involving missing children who were lured from their homes or school via instant messages (IMs).
These questions are not limited to law enforcement. In many cases, the best source of information or evidence is available in computer memory (network con-nections, contents of the IM client window, memory used by the IM client process, and so on), since an IM client does not automatically create a log of the conversa-tion, for example. In other cases, investigators are asked if there was a Trojan or some other malware active on the system and whether sensitive information was copied off the system. First responders and investigators are being asked questions about what activity was going on while the system was live. Members of IT staffs are finding anomalous or troubling traffic in their firewall and IDS logs and are shutting off the system from which the traffic is originating before determining which pro-cess was responsible for the traffic. Situations like these require that the investigator perform live response—collecting data from a system while it is still running.This in itself raises some issues, which we will address throughout this chapter.
Live Response
There are a number of issues facing investigators today where unplugging a system (or several systems) and acquiring an image of the hard drive(s) might not be an option. As the use of e-commerce continues to grow, system downtime is measured in hundreds or thousands of dollars per minute, based on lost transactions.Therefore, taking a system down to acquire a hard drive image has a serious effect on the bottom line. Also, some companies have service-level agreements (SLAs) guaranteeing “five nines” of uptime— that is, the company guarantees to its customers that the systems will be up and opera-tional 99.999 percent of the time (outside of maintenance windows, of course).Taking a system with a single hard drive offline to perform imaging can take several hours, depending on the configuration of the system.
that can get into your computer system and steal your personal information (pass-words, personal files, income tax returns, and the like), yet the code for some of these programs is never written to the hard drive; the programs exist only in memory. When the system is shut down, all evidence of the program disappears.
In April 2006, Seagate introduced the first 750GB hard drives. (For more infor-mation go to www.seagate.com/cda/newsinfo/newsroom/releases/
article/0,1121,3153,00.html.) Imagine a RAID system with five or eight such hard drives, topping out at 6 terabytes (TB) of storage. How long would it take you to image those hard drives? With certain configurations, it can take investigators four or more hours to acquire and verify a single 80GB hard drive. And would you need to image the entire system if you were interested in only the activities of a single pro-cess and not in the thousands of files resident on the system?
In some cases, before stepping off into a more traditional computer forensics investigation, we might want to collect some information about the live system before shutting it down and acquiring a bit-stream image of the hard drive or drives. The information you would be most interested in is volatilein nature, meaning that it ceases to exist when power is removed from the system.This volatile information usually exists in physical memory, or RAM, and consists of such things as informa-tion about processes, network connecinforma-tions, the contents of the clipboard, and so on. This information describes the state of the system at the time you are standing in front of it or sitting at the console. As an investigator, you could be faced with a situ-ation in which you must quickly capture and analyze data (covered in the next chapter) to make a determination of the nature and scope of the incident. When power is removed from the system in preparation for imaging the hard drive in the traditional manner, this information simply disappears.
We do have options available to us—tools and techniques we can use to collect this volatile information from a live system, giving us a better overall picture of the state of the system as well as providing us with a greater scope of information.This is what “live response” entails: accessing a live, running system and collecting volatile (and in some cases, nonvolatile) information.
There is another term you might hear that is often confused with live response:
examine some solutions for performing a live acquisition. Analysis of the image col-lected during live acquisition will be covered in the remaining chapters of this book.
Before we start discussing live response tools and activities, we need to address two important topics: Locard’s Exchange Principle and the order of volatility.These concepts are the cornerstones of this chapter and live response in general, and we will discuss them in detail.
Locard’s Exchange Principle
In performing live response, investigators and first responders need to keep a very important principle in mind. When we interact with a live system, whether as a user or as an investigator, changes will occur on that system. On a live system, changes will occur simply due to the passage of time, as processes work, as data is saved and deleted, as network connections time out or are created, and so on. Some changes happen when the system just sits there and runs. Changes also occur as the investi-gator runs programs on the system to collect information, volatile or otherwise. Running a program causes information to be loaded into physical memory, and in doing so, physical memory used by other, already running processes may be written to the page file. As the investigator collects information and sends it off the system, new network connections will be created. All these changes can be collectively explained by Locard’s Exchange Principle.
In the early 20th century, Dr. Edmond Locard’s work in the area of forensic sci-ence and crime scene reconstruction became known as Locard’s Exchange Principle. This principle states, in essence, that when two objects come into contact, material is exchanged or transferred between them. If you watch the popular CSI crime show on TV, you’ll invariably hear one of the crime scene investigators refer to possible transfer.This usually occurs after a car hits something or when an investigator exam-ines a body and locates material that seems out of place.
Tools & Traps…
Locard and Netcat
Simple tools such as netcat. can be used to demonstrate Locard’s Exchange Principle1.If you’re not familiar with netcat (nc.exe on Windows systems),
suf-fice it to say that netcat is an extremely versatile tool that allows you to read and write information across network connections.
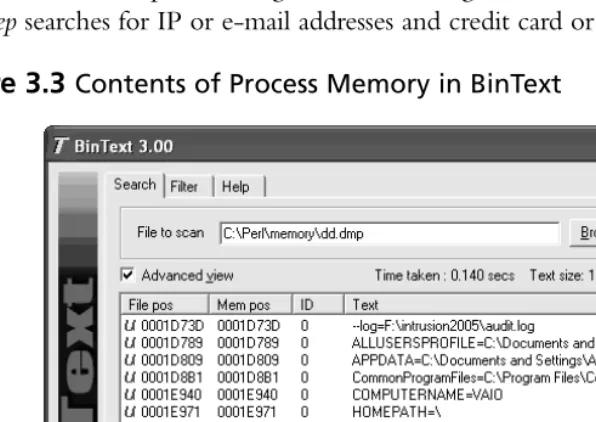
For this example, you will need three tools: netcat (nc.exe), pmdump.exe2.
and strings.exe3.or BinText (once available from the Foundstone.com Web site;
you might need to Google for it). You can run this example using either one or two systems, but it works best when two systems are used. If you’re using one system, create two directories, with a copy of netcat in each directory.
Start by launching netcat in listening mode with the following com-mand line:
C:\test>nc –L –d –p 8080 –e cmd.exe
This command line tells netcat to listen on port 8080, in detached mode, and when a connection is made, to launch the command prompt. Once you’ve typed in the command line and pressed Enter, open the Task Manager and note the process identifier (PID) of the process you just created.
Now open another command prompt on the same system or go to your other system and open the command prompt. Type the following command line to connect to the netcat listener you just created:
C:\test2>nc <IP address> 8080
This command line tells netcat to open in client mode and connect to the IP address on port 8080, where our listener is waiting. If you’re running the test on a single system, use 127.0.0.1 as the IP address.
Once you’ve connected, you should see the command prompt header that you normally see, showing the version of the operating system and the copyright information. Type a couple of commands at the prompt, such as dir
or anything else, to simply send information across the connection.
On the system where the netcat listener is running, open another com-mand prompt and use pmdump.exe (discussed later in this chapter) to obtain the contents of memory for the listener process:
C:\test>pmdump <PID> netcat1.log
This command will obtain the contents of memory (both physical memory as well as the page file) used by the process and put it into the file netcat1.log. You may also dump the process memory of the client side of the connection, if you like. Now that you have the process memory saved in a file, you can exit both processes. Run strings.exe against the memory file from the listener or open the file in BinText and you will see the IP address of the client. Doing the same thing with the client’s memory file will display information about the system where the listener was running, demonstrating the concept of Locard’s Exchange Principle.
Programs that we use to collect information might have other effects on a live system. For example, a program might need to read several Registry keys, and the paths to those keys will be read into memory. Windows XP systems perform appli-cation prefetching, so if the investigator runs a program that the user has already run on the system, the last access and modification times of the prefetch file (as well as the contents of the file itself ) for that application will be modified. If the program that the investigator runs hasn’t been used before, a new prefetch file will be created in the Prefetch directory (assuming the contents of the Prefetch directory haven’t reached their 128 .pf file limit … but more on that later in the book).
Investigators not only need to understand that these changes will occur, they must also document those changes and be able to explain the effects their actions had on the system, to a reasonable extent. For example, as an investigator you should be able to determine which .pf files in the XP Prefetch directory are a result of your efforts and which are the result of user activities.The same is true for Registry values. As with the application prefetching capabilities of Windows XP, your actions will have an effect on the system Registry. Specifically, entries may appear in the Registry, and as such the LastWrite times of the Registry keys will be updated. Some of these changes might not be a direct result of your tools or actions but rather are made by the shell (i.e., Windows Explorer), due simply to the fact that the system is live and running.
By testing and understanding the tools you use, you will be able to document and explain what artifacts found on a system are the result of your efforts and which are the result of actions taken by a user or an attacker.
Order of Volatility
if they aren’t used.You can see this by browsing to a specific site or making some other network connection and viewing that connection via netstat.exe.Then shut down the client application you’re using and the state of the network connection will change over time before it eventually disappears from the output of netstat.exe. The system time, however, changes much more quickly, while the contents of the clipboard will remain constant until either they are changed or power is removed from the system. Additionally, some processes, such as services (referred to as daemons
in the UNIX realm) run for a long time, whereas other processes can be extremely short lived, performing their tasks quickly before disappearing from memory.This would indicate that we need to collect certain information first so that we can cap-ture it before it changes, whereas other volatile data that happens to be more persis-tent can be collected later.
A great place to go for this information is the request for comment (RFC) doc-ument 3227,Guidelines for Evidence Collection and Archiving
(www.faqs.org/rfcs/rfc3227.html).This RFC, published in February 2002, remains pertinent today, since core guiding principles don’t change as technologies change. The RFC specifies such principles for evidence collection as capturing as accurate a picture of the system as possible; keeping detailed notes; noting differences between UTC, local time, and system time; and minimizing changes to data as much as pos-sible. We’ll keep these principles in mind throughout our discussion of live response.
T
IPRFC 3227 points out that you should note the difference between the system clock and universal coordinated time (UTC) as well as take detailed notes in case you need to explain or justify your actions (the RFC says “testify”), even years later.
the impact to the “victim” system while at the same time collecting the information we need to perform our analysis.
When to Perform Live Response
Perhaps the most prominent question on the minds of investigators and first respon-ders is, “When should I consider live response?” In most instances today (for
example, criminal or civil cases, internal corporate investigations), there is no prede-fined set of conditions that define conditions for live response. In fact, there are many situations in which live response and subsequently volatile information aren’t considered.The decision to perform live response depends on the situation, the envi-ronment (taking into consideration the investigator’s intent, corporate policies, or applicable laws), and the nature of the issue with which you have been presented.
Let’s look at a couple of examples. Say that you’ve been contacted by a system administrator reporting some unusual network traffic. She received an alert from the intrusion detection system (IDS), and in checking the firewall logs, found some sus-picious log entries that seemed to correlate with the IDS alerts. She says that there seems to be some odd traffic coming from one particular system that sits on the internal network. She already has the IDS alerts and network logs, but you decide to perform a more comprehensive capture of network traffic. In doing so, you realize that you have the network traffic information, but how do you associate it with a particular system? That’s pretty easy, right? After all, you have the system’s IP address (as either the source or destination IP address in your network capture), and if you’ve also captured Ethernet frames, you also have the MAC address. But how do you then associate the traffic you see on the network with a particular user and/or process running on the system?
To definitively determine the source of the suspicious traffic (which process is generating it), you’d have to collect information about running processes and net-work connections from the system prior to shutting it down. Other information col-lected during live response might show you that someone is logged into the system remotely, via a network logon or a backdoor, or that a running process was launched as a Scheduled Task.
The following year, Aaron Caffrey claimed that Trojans allowed others to control his computer and launch attacks against other systems, for which he’d been accused. Caffrey’s defense argued that although no Trojan had been found on his system during a forensic examination, still, a Trojan couldhave been responsible. His argu-ment was sufficient to get him acquitted.
In cases such as these, hindsight tells us that it would have been beneficial to have some information about running processes and network connections collected at the time the systems were seized, particularly if they were running when the investigator arrived on the scene.This information might have told us whether there were any unusual processes running at the time and if anyone had connected to the system to control it and upload files, direct attacks against other systems, or the like. As discussed previously, another reason for performing live response is that the system itself cannot be taken down without good (and I mean really good) reason. On larger critical systems, such as those used in e-commerce, down time is measured in lost transactions or hundreds (even thousands) of dollars per minute. As the process of acquiring an image from the hard drives (most systems of this nature use more than one hard drive, in a RAID configuration) can often take considerable time, it’s preferable to have some solid facts to justify taking the system offline and out of ser-vice, if that is what is necessary. Doing so might not simply be a matter of a system administrator justifying these actions to an IT manager but one of a CFO justifying them to the board of directors.
Yet another factor to consider is legislation requiring notification. Beginning with California’s SB 1386, companies that suffer security breaches in which sensitive information has been compromised must notify their customers so that those cus-tomers can protect themselves from identity theft.4.At the time of this writing, other
that sensitive personal information about its customers has been compromised? Wouldn’t you?
Take, for example, an incident in which an “anonymous” individual on the Internet claims to have stolen sensitive information from an organization.This person claims that he broke into the organization over the Internet and was able to collect customer names, Social Security numbers, addresses, credit card data, and more.The organization’s senior management will want to know if this was, in fact, the case, and if it was, how this person was able to do what he claimed he’d done. Investigators will need to perform live response and examine systems for volatile information, such as running processes and network connections.They might also be interested in locating malware that is present in memory but doesn’t have any infor-mation or even an executable image written to disk.
What Data to Collect
At this point, we’re ready to look at the types of volatile information we can expect to see on a live system and learn about the tools we could use to collect that infor-mation during live response.
When we’re performing live response, it’s likely that one of the first things we’ll want to collect is the contents of physical memory, or RAM. When we take Locard’s Exchange Principle into account, it’s pretty clear that by collecting the contents of RAM first, we minimize the impact we have on in the contents of RAM. From that point on, we know that the other tools we run to collect other volatile information are going to be loaded into memory (as is the tool that we use to collect the con-tents of RAM), modifying the concon-tents of memory. However, collecting and ana-lyzing the contents of RAM is a relatively new area of study (as of Summer 2005), and as such it deserves its own chapter. (For a detailed discussion of this topic, see Chapter 3, “Windows Memory Analysis.”)
That being said, specific types of volatile information we’ll look at in this chapter are:
■ System time
■ Logged-on user(s)
■ Open files
■ Network information
■ Network connections
■ Process-to-port mapping
■ Process memory
■ Network status
■ Clipboard contents
■ Service/driver information
■ Command history
■ Mapped drives
■ Shares
For each of these types of volatile information, we will look at some tools that we can use to retrieve it from a Windows system.You will most likely notice that throughout this chapter there is a tendency toward using command-line interface (CLI) tools over those with a graphical user interface (GUI). Some would think that this is because CLI tools have a smaller “memory footprint,” meaning that they con-sume less memory, rely on fewer dynamic link libraries (DLLs), and have less impact on the system.This is partially the case, but keep in mind that the actual “footprint” of any particular tool can be determined only through thorough testing of the tools you use.
W
ARNINGOne should never make assumptions about a tool and its “memory footprint” when run on a system. Without thorough examination and testing (see Chapter 6, “Executable File Analysis,” for information that pertains to examining executable files), you’ll never know the kind of footprint an executable has on a system or the kind of artifacts it leaves behind following its use.
Most programmers of GUI tools don’t necessarily develop them with incident response or forensics in mind. One of our goals is to minimize the impact of our investigative measures on a system (particularly for follow-on imaging and forensic analysis activities), so we want to avoid writing files to the system, in addition to get-ting the data we need off the system as quickly and efficiently as possible.
Now, this is not to say that GUI tools absolutely cannot be used for
live-response activities. If there’s a GUI tool that you find absolutely perfect for what you need, then by all means, use it. But consider ahead of time how you’re going to get that data off the system.
Regardless of the tools you decide to use, always be sure to check the license agreement before using them. Some tools can be used as you like, but others require a fee for use in a corporate environment. Reading and heeding these agreements in advance can help you avoid major headaches at the wrong time.
System Time
One of the first pieces of information you want to collect when you’re investigating an incident is the system time.This will give a great deal of context to the informa-tion collected later in the investigainforma-tion and will assist in developing an accurate timeline of events that have occurred on the system.
The most well-known means of displaying the system time is illustrated in Figure 1.1.
Notes from the Underground…
Getting the System Time
The investigator can get the system time using a simple Perl script, such as:
print locatime(time)."\n";
This script displays the system time in local format, based on the time zone and daylight savings information that the system has set, but the time can also be displayed in GMT format using a script such as:
print gmtime(time)."\n";
The systime.pl Perl script located on the CD that accompanies this book demonstrates how the system time can be retrieved using the Windows appli-cation programming interface (API). The systime.exe file is a stand-alone exe-cutable compiled from the Perl script using Perl2Exe.
Another method for retrieving this information is to use WMI to access the Win32_OperatingSystem class and display the LocalDateTimevalue.
Not only is the current system time important for the investigator, but the amount of time that the system has been running, or the uptime, can also provide a great deal of context to the investigation. For example, noting the amount of time that the system has been running compared to the amount of time a process has been running can provide you with an idea of when an exploit or compromise attempt might have been successful. (More on retrieving information about processes later in this chapter.)
In addition, the investigator should also record the real time, or wall time, when recording the system time. Having both allows the investigator to later determine whether the system clock was inaccurate. Information about the “clock skew” pro-vides a better understanding of the actual time at which events recorded in log files occurred.This information can be invaluable when you’re trying to combine times-tamps from more than one source.
Another piece of time-related information that could be important is the time zone settings for the computer. Windows systems using the NTFS file system store file times in UTC (analogous to GMT) format,5.and systems using the FAT file
post-mortem analysis (discussed later in this book), but it can become extremely important when you’re performing live response remotely.
Logged-on Users
During an investigation, you will want to know which users are logged on to the system.This includes people who are logged on locally (via the console or keyboard) as well as remotely (such as via the net usecommand or via a mapped share).This information allows you to add context to other information you collect from a system, such as the user context of a running process, the owner of a file, or the last access times on files.This information is also useful to correlate against the Security Event Log, particularly if the appropriate auditing has been enabled.
Psloggedon
Perhaps the best-known tool for determining logged-on users is psloggedon.exe.6.
This tool shows the investigator the name of the user logged on locally (at the key-board) as well as those users who are logged on remotely, such as via a mapped share.
As shown in Figure 1.2, psloggedon.exe shows users logged onto the system remotely.To set up this demonstration, I logged into a Windows 2000 system (Petra) from my Windows XP system and then ran the command on the Windows 2000 system.
Figure 1.2Output of Psloggedon.exe on Windows 2000
Net Sessions
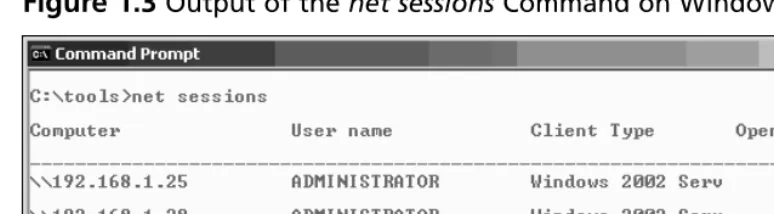
Figure 1.3Output of the net sessionsCommand on Windows 2003
The net sessionsoutput illustrated in Figure 1.3 shows two Windows XP systems logged into a Windows 2003system using the Administrator account. Neither session has any files open, but neither has been active for very long (as illustrated by the times listed in the “Idle time” column of the output).
Logonsessions
Logonsessions.exe is a CLI tool available from SysInternals.com that lists all the active logon sessions on a system.7. Figure 1.4 illustrates a portion of the output of
logonses-sions.exe on a Windows XP system (the system name is Ender).
Logonsessions.exe provides a great deal more information than the other tools, as illustrated in the output excerpt displayed in Figure 1.4. For example, it lists the authentication package used (it might be important to your investigation that the Kerberos authentication package was used instead of LanManager), type of logon, active processes, and so on.
T
IPThe logonsess.txt file located in the \ch1\dat directory on the accom-panying DVD contains the output of logonsessionsfrom the Windows 2003 system illustrated in Figure 1.3.
Another useful utility you’ll find handy is netusers.exe, a free utility from Somarsoft.com. Using the -localand -historyswitches with netusers.exe, you can retrieve a brief report of the last time all local users logged onto the system.The last logon time is maintained in the Registry; specifics of this Registry information are discussed in Chapter 4, “Registry Analysis.” Netusers.exe allows you to retrieve this information from a live system.
Keep in mind, however, that these tools will not show you if someone is logged on via a backdoor. Backdoors and Trojans such as the infamous SubSeven8. allow
users to “log in” to the Trojan via a raw TCP connection, bypassing the Windows authentication mechanisms. As such, these connections will not show up when you’re using tools such as psloggedon.exe. Having the output of these tools, however, can be instrumental in showing that a user you discover later on did not show up in the list. It can be used to demonstrate hidden functionality, even if the mechanism for that functionality is never found.
Open Files
and the openfiles.exe10.tools (native to Windows XP Pro and Windows 2003) will
show files that are opened remotely on a system.
Network Information
(Cached NetBIOS Name Table)
Sometimes when intruders gain remote access to a system, they want to know what other systems are available on the network and can be “seen” (in the network-cen-tric sense) by the system they’ve compromised. I’ve seen this happen quite often in investigations, in a variety of ways; sometimes batch files have been created on the system and executed, and other times the intruder has launched net view commands via SQL injection (by using a browser to send commands to the system through the web and database servers). When connections are made to other systems using NetBIOS11.communications (the same as are used for logins, connecting to shares,
and the like), the systems will maintain a list of other systems they’ve “seen.” By viewing the contents of the cached name table, you might be able to determine other systems that have been affected.
Let’s take a look at an example. My home “network” consists of one laptop and several VMware sessions that appear as stand-alone systems on a virtual network.To demonstrate the caching of NetBIOS names, I started my Windows 2000 VMware session and logged in to view the IP address that was assigned via DHCP. I then went back to the host operating system (Windows XP Pro SP2) and in a command prompt, typed nbtstat –A 192.168.1.22 to view the “remote” system’s name table. I then typed nbtstat –cto view the cached NetBIOS names on the host operating system. What I saw appears in Figure 1.5.
You might be thinking at this point, “So what? Why is this important?” Well, if I were an attacker and had gained access to one system, I might be interested in gaining access to other systems as well.To do so, I would need to see what systems are on the network and what vulnerabilities they have. Essentially, I’d be looking for easy targets. Now, if I were to start scanning for vulnerabilities, I might alert
someone to what was going on. Also, to scan for vulnerabilities, I would need to copy my tools to the system I had already compromised, and that could alert
someone to my activities. However, I can use nbtstat.exe to locate potentially vulner-able systems. For example, Figure 1.6 shows the output of the command I ran to populate the NetBIOS name cache.
Figure 1.6Output of nbtstat –A 192.168.1.22
From the output of the nbtstatcommand displayed in Figure 1.6, we can see that the administrator is logged in, and we can see that the system is running the IIS Web server. Penetration testers and attackers alike will use the information in the
NetBIOS name table on any system they are able to compromise, to locate other vulnerable systems.The MS KB articles 16340912.and 11949513.provide a great deal
of information regarding the information available in the name table.
Network Connections
lost. An investigator might approach a system and, after an initial look, determine that the attacker is still logged into and accessing the system. Or she could find that a worm or an IRCbot is communicating out from the system, searching for other sys-tems to infect, updating itself, or logging into a command and control server.This information can provide important clues and add context to other information that the investigator has collected. Not every system will have a firewall installed, particu-larly not one configured to log successful connections into and out of the system. Nor will every system have an application such as Port Reporter14.installed to record
and log network connection information.The investigator must be prepared to react quickly and collect the information he or she needs in an efficient, timely manner.
I’ve been involved in several cases where I have been provided with image files acquired from a system, and the client has asked, “Was sensitive data copied from the system?” Without at least some network-based information, the answer will invari-ably be “There’s no way to tell.” I have also been in numerous situations where having some information about network connections would greatly reduce what I have to look for, particularly when what alerted the client to the incident in the first place really had nothing to do with the compromise we ended up discovering. In one particular situation, a timeline analysis of the system image showed that the intruder was accessing the system via a backdoor at the same time that two different administrators were accessing the system to remediate two separate issues. Having information about network connections going to and from the system would have been extremely helpful in locating the core intrusion.
Netstat
Netstatis perhaps the most well-known tool for collecting information regarding network connections on a Windows system.This CLI tool is straightforward and simple to use and provides a simple view of TCP and UDP connections and their state, network traffic statistics, and the like. Netstat.exe is a native tool, meaning that it is provided as part of the operating system distribution.
Figure 1.7Excerpt from the Output of the netstat –anocommand on Windows XP
T
IPUnder normal circumstances, Windows 2000 does not respond to the -oswitch when running netstat.exe. However, MS KB article 907980 provides access to a hotfix that allows the version of netstat.exe on Windows 2000 to list the PID for the process that “owns” the network connection listed in the output.
T
IPMS KB article 13798415. is older but provides descriptions of the states
listed in the output of netstat.exe.
Using netstatwith the -rswitch will display the routing table and show you whether any persistent routes are enabled on the system.This could provide some very useful information to an investigator or even simply to an administrator trou-bleshooting a system. I’ve seen systems that have been set up to transfer files to another location as part of a business process, and the only way that process would work was if there was a persistent route enabled on the system, since the persistent route redirected certain traffic out over a VPN connection rather than through the normal routes out of the infrastructure. In troubleshooting an issue that really wasn’t making much sense to me, I ran across a persistent route and told one of the system engineers about it.This information jogged his memory a bit, and we were able to track down and resolve the issue.
Process Information
An investigator will alwayswant to know what processes are running on a potentially compromised system. Note that always. When viewing the running processes in the Task Manager, you can see some information about each process. However, there’s much more information that’s not visible in Task Manager that you will want to collect during an investigation.You will want:
■ The full path to the executable image (.exe file)
■ The command line used to launch the process, if any
■ The amount of time that the process has been running
■ The security/user context that the process is running in
■ Which modules the process has loaded
■ The memory contents of the process
The Task Manager view provides some of this information, but it does not pro-vide everything. For instance, some malware installs itself under the name
File Protection” sidebar for more information).This means that as long as WFP is running and hasn’t been tampered with, attempts to replace or modify a protected file will cause the new file to be automatically replaced by a “known good” copy from the cache and an Event Log entry to be generated.
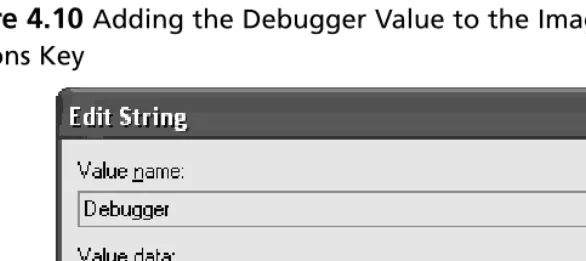
Why is this important? If you’re looking at the list of processes in Task Manager, how are you going to tell which process is “suspicious”? An easy way to find “suspi-cious” processes is to view the full path to the executable image file (svchost.exe running from something other than C:\Windows\system32 is going to be suspi-cious) and/or the command line used to launch the process, as inetinfo.exe launched with the arguments -L –d –p 80 –e cmd.exeshould be suspicious to most administra-tors and investigaadministra-tors; this command line is indicative of the use of netcat as a back-door. Many bits of malware disguise themselves by using names of legitimate files. For example, the W32/Nachi16.worm places a copy of a TFTP utility in the
C:\Windows\System32\Wins directory and names it svchost.exe. When this pro-gram is running, there is no way in Task Manager to really distinguish it from the legitimate version of svchost.exe.
Are You Owned?
Windows File Protection
Windows File Protection, or WFP, was added to Windows in Windows 2000 and is present in Windows XP and 2003 as well. In a nutshell, WFP protects crit-ical system files from being modified or deleted accidentally. Assuming that the system hasn’t been compromised to the point where WFP can be sub-verted, if an attempt is made to modify or delete a protected file, the system will “wake up” and automatically replace that file with a known good copy from cache. An event ID 6400117. is then generated and written to the Event
Log.
MS KB article 222193,18. Description of the Windows File Protection
Feature, provides a more in-depth explanation of the feature along with var-ious Registry keys associated with WFP.
Tlist
Tlist.exe, included as part of the MS Debugging Tools,19.displays a good deal of
information about running processes. For example, the -vswitch will display the ses-sion identifier, PID, process name, associated services, and command line used to launch the process for the investigator, as follows:
0 344 svchost.exe Svcs: LmHosts,SSDPSRV,WebClient
Command Line: C:\WINDOWS\System32\svchost.exe -k LocalService
Other switches will show this information in isolation.The -c switch will show just the command line used to launch each process (similar to cmdline.exe,20.which
only displays the command line for each process), whereas the -s switch will show the associated services (or the window title, if there are no services associated with the process).The -t switch will display the task tree, listing each process below its parent process, as follows:
System (4) smss.exe (628)
csrss.exe (772) winlogon.exe (1056)
services.exe (1100) svchost.exe (1296) svchost.exe (1344) svchost.exe (1688)
wscntfy.exe (1184)
Tlist.exe also allows you to search for all processes that have a specific module loaded, using the -m switch. For example, wsock32.dll provides networking func-tionality and is described as the Windows Socket 32-Bit DLL.To list all the processes that have this module loaded, type the following command:
D:\tools>tlist –m wsock32.dll
This command returns the PID and name for each process, such as:
WSOCK32.dll - 1688 svchost.exe wsock32.dll - 344 svchost.exe WSOCK32.dll - 1992 alg.exe
WSOCK32.dll - 1956 explorer.exe Program Manager wsock32.dll - 452 ViewMgr.exe AXTimer
Tasklist
T