(a) e-mail : [email protected]
Creep compression behaviour of a polyurethane foam from
cryogenic temperatures: size effect and long-term prediction
Anne-Gaëlle DENAY1,2,a, Sylvie CASTAGNET2, Annette ROY1, Gaëlle ALISE1
1CRITT Matériaux Poitou-Charentes, Rochefort (France)
2
Institut P’, Département Physique et Mécanique des Matériaux, UPR CNRS 3346, ENSMA Poitiers (France)
Abstract. The objective of this work was to predict the long term behavior of Polyurethane foam (PU) at very low-temperature, by applying the time-temperature superposition principle (TTSP). The experimental background of the TTSP was based on a Dynamical Mechanical Analysis technique. Two issues arise from this experimental approach: the relevance of the temperature range to apply the TTSP, and the possible size-effect associated to the small DMA samples. Firstly, on the studied temperature range (-170°C; +180°C) many transitions have been observed, particularly from -20°C. Thus to apply the TTSP, it would be necessary to limit the temperature range (between temperature of molecular transitions, i.e. from -20°C up to 80°C). At very low temperatures, DMA spectra did not evidence any viscoelastic domain. However a deformation has been measured during creep tests in the same temperature range. So it would be necessary to determine which micro-mechanism is responsible for the observed deformation.Secondly, it was important to determine if the volume of DMA sample was representative. Several techniques have shown that a representative volume would be reached between 8 and 12mm3.
1 Introduction
Polyurethane (PU) foams are widely used for impact applications [1] as well as for thermal insulation [2], as addressed in the present study for storage and transport by methane carrier of liquid natural gas (LNG at-170°C). Although initially used for its interesting thermal properties, polyurethane foam at the bottom of the tank undergoes variable mechanical loading, e.g. creep under the LNG weight over long periods at -170°C, followed by unloading and heating stages (up to 80°C) when the tank is empty.
Among other aims of the study, the present contribution deals with the prediction of long term creep properties of PU foams at very low temperatures, and more precisely with the relevance of the time-temperature superposition principle (TTSP) widely used for polymeric bulk materials to predict creep behavior over very long times. Due to the cellular microstructure of the material, it must be highlighted if deformation micro-mechanisms correspond to structure effects of cell calls or to very local and elementary mechanisms, close to that activated in the bulk and short scale enough to obey a TTSP. Subsequently, temperature ranges corresponding to single micro-mechanisms must be identified to support the applicability of the TTSP.
Taking into account the very low strain range involved in the application, it seemed reasonable to base the experimental background of the TTSP on a Dynamical Mechanical Analysis (DMA) technique, interesting for the ease of implementation of tests, and for the saving time.
However, DMA tests are performed on small samples. Since foams are known to exhibit structural and size-dependant deformation mechanisms at the micro-scale [3-5], it is important to determine if the volume of DMA samples is representative. Then, a study of size effects must be made in parallel. Two main approaches are lead: compression tests on samples with different
© Owned by the authors, published by EDP Sciences, 2010 DOI:10.1051/epjconf/20100625006
to estimate the smaller volume needed to get a representative stress-strain curve.
In this study, all mechanical properties were measured in the direction perpendicular to the foaming direction.
2 Materials and experiments
2.1. Material
The studied material was a thermoset polyurethane foam, with a density of 130kg/m3. The blowing agent was Solkane 141b (1, 1 – Dichloro- 1-fluoroethane). The glass transition temperature (Tg) equals 115°C, as measured in Differential Scanning Calorimetry (DSC, with an heating rate of 10°C/min); and about 120°C as measured in Dynamical Mechanical Analysis (DMA in compression, at frequency = 1 Hz) at the maximum of the tan δ peak.
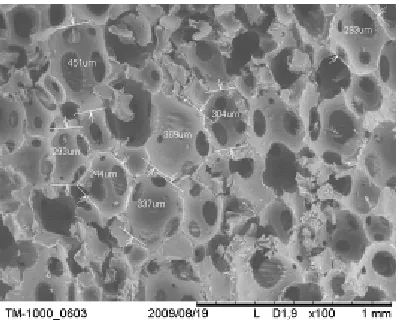
The cellular microstructure and cell size of the polyurethane foam have been characterized with a tabletop scanning electron microscope (SEM) (TM-1000 HITACHI). With this tabletop microscope, it is not necessary to coat the surface. The micrographs obtained are directly treated with the microscope’s software.
In the SEM images of the PU foam, shown in Fig.1, cells appear nearly spherical and uniformly distributed. But the cells are neither totally closed nor totally opened; holes could be observed in the walls of cells (Fig. 1). The mean cell diameter is appreciatively of 350µm (measured on the tabletop microscope software). The PU foam density was 130 kg/m3 (measured from the Archimede’s principle), and the relative density is: ρ* = ρ / ρs (ρ* = relative density; ρ = cellular material density; ρs = solid density of same material)
.
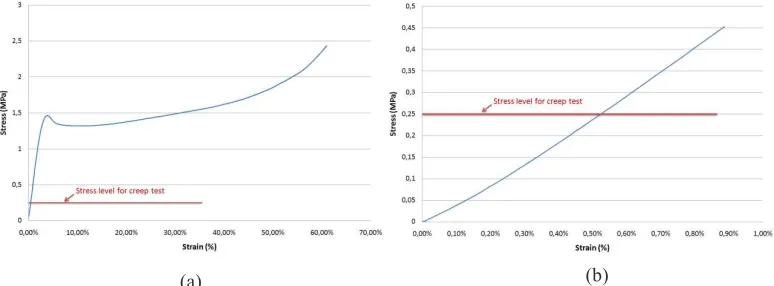
For polyurethane the solid density is 1150 kg/m3 [6], so for the studied foam, ρ* = 0.113.As shown in fig.2, the PU foam exhibits the typical stress-strain curve of any cellular material [6]. The stress level applied in creep tests is indicated in (Fig. 2). The corresponding strain value is about 0.50%, which is a very small range strain supporting the use of the time-temperature equivalence principle to predict the long term creep properties.
14th International Conference on Experimental Mechanics
2.2. Dynamical mechanical analysis (DMA)
The DMA equipment (Netzsch DMA 242C) was used in compression. The storage modulus (E’), loss modulus (E’’) and loss tangent and loss factor (tan δ) were obtained in a parallel plate measurement system, which is a configuration suited to the porous nature of the samples. Two kinds of experiments were carried out.
(i) In order to obtain the viscoelastic properties as a function of temperature, cubic samples (6x6x6mm) are submitted to sinusoidal compression at a frequency f = 1 Hz. A temperature ramp is applied during the test from – 170 up to 150°C at a heating rate of 2°C/min.
(ii) To study the creep compression behaviour (within a short time, i.e. 1H30), creep curves are obtained in the same cubic samples (6x6x6 mm) in compression at a nominal stress of 0.2MPa and at different temperatures (the initial displacement rate to apply the constant force necessary to creep test is 2 mm/min).
2.3. Mechanical tests
Uniaxial compression tests have performed on a tensile test machine ZWICK Z250. Compression plates are maintained parallel by a ball bearing guidance device. The tested samples were cubes with different dimensions (20x20x20mm; 30x30x30mm; 40x40x40mm; and 50x50x50 mm). Compression tests have been performed at strain rate of 4.10-3mm.s-1 at ambient temperature.
Creep tests have been carried out in two devices: a classical tension-compression machine and a creep machine. For creep tests on tensile test machine ZWICK Z 250, a constant nominal strain of 0.25MPa has been applied during two hours, and the displacement evolution has been observed during that time.
On creep apparatus, we tested cubes of 50x50x50mm. A stress of 0.25MPa was applied by an arm of control lever. The evolution of the movement is measured by a LVDT sensor during test.
The initial displacement rate applied to reach the nominal stress of 0.25 MPa was similar for both tests, and equal to 2 mm/min.
The same mechanical tests, i.e. compression and creep test, were performed in another tensile test machine (INSTRON 4505) fitted with an optical extensometer. Tests were carried out in the same conditions as above depicted, i.e. at the same nominal stress of 0.25MPa for creep, and the same strain rate for monotonic compression).
Fig. 2: (a) stress-strain curve in compression at 1.7 10-3 s-1 and (b) zoom to the low strain range
Fig. 3 : (a) creep apparatus; (b) side view of sample and LVDT sensor
On a sample, a dot network was plotted on a side face parallel to the strength application direction. Digital images are captured by a CCD camera (582x752 pixels), at regular time intervals. Then, the strain measurement was performed by the digital correlation software tracking the displacement of four marks laid on the surface of a sample; the same compression test could be analysed by selecting different groups of marks corresponding to different gauge lengths, to identify a minimal representative surface and to know if deformation is homogeneous or not.
3 Results
3.1. Temperature dependence.
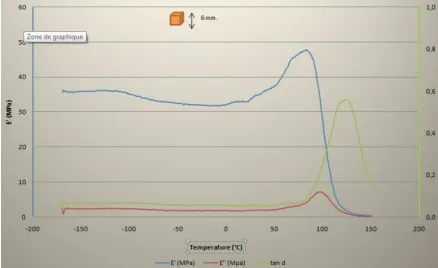
First, DMA tests have been performed, with sweep of temperature in compression. A first common result about temperature dependence of the compression behavior arises from most tests, showing many transitions during the tests. A first transition is observed at about -100°C which can be attributed to a phase transition of the gas contained within the cells (the 141b has a melting point at -103.5°C). From 20°C an increase phenomenon of the storage modulus is observed (by 10 MPa) (see to the Fig.4). The temperature of glass transition is approximatively 120°C. The same tests have been performed on other DMA equipment: the same transitions and the same increase of the storage modulus between 20°C and 90°C are observed (increasing by about 10 - 15 MPa).
This increase of storage modulus is not due to a dilatation of PU foam: dilatation tests have been carried out and the thermal strain estimated from the lineic thermal expansion coefficient (15.5 10-5 K-1) cannot explain this phenomenon. It could be a structure effect of foam (morphological modification, loss of plasticizer, recombination of low energy bonds…).
Fig. 4 : Evolution of E', E'' and tand during DMA experiment between -170°C and 150°C at 1 Hz in
14th International Conference on Experimental Mechanics
Besides, other DMA tests have been performed after various heat treatments. Results showed that after heat treatment, the value of E’ increases very sharply at low temperature. Then two phenomena are observed, a first drop of E’ near -20°C, before an increase of the same modulus, before Tg. It would suggest that two simultaneous phenomena occur. A loss of plasticizing could explain the increase of modulus after the first heating stage. The drop observed at about -20°C could correspond to a first Tg involving the most flexible segments in the PU foam. [7]
To conclude of the relevance of TTSP, there is no relaxation at very low temperature, and from -20°C many transitions have been observed. So, it would be necessary to reduce the temperature range (from -20°C up to 80°C for example) to apply the TTSP. But it would then be necessary to determine if the new temperature range is sufficient for a long term prediction.
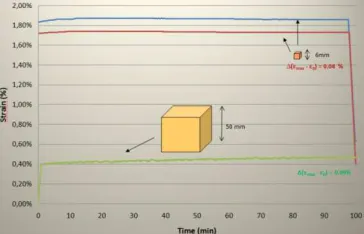
Results from the previous DMA have shown that there did not seem to be of viscoelasticity phenomena at low temperatures. However, a deformation is measured during creep tests at these same low temperatures (see Fig. 6 on 50x50x50 sample, creep strain of 0.09% with an initial strain of 0.4%, and 0.04% of creep strain for 6x6x6 mm sample, and with an initial strain between 1.70 and 1.90%). It will now be necessary to determine if this deformation is due to local phenomena within the cell walls or to structures effects. Environmental Scanning Electronic Microscopy (ESEM) is in progress to investigate correlations between deformation processes in small and large specimens (e.g. side effects).
Fig. 6: creep curves from DMA (cubic samples 6x6x6 mm) and creep bench (cubic samples 50x50x50mm)
low temperatures via the principle of time-temperature equivalence.
Moreover, to make a prediction based on DMA experiments, it is necessary to know if cubic sample of 6x6x6mm are large enough to be representative of the bulk behavior. So; simultaneously tests have been performed to investigate any size effect on the compression properties.
3.3. Size effects.
3.3.1. Compression tests with a various range of samples dimensions.
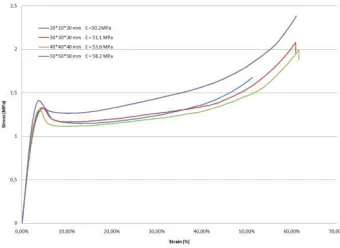
To clarify size effects, compressions tests have carried out, on samples with different dimensions. The aim was to determine from which minimal size the mechanical behaviour is the same.Tests were realized in the same conditions, and globally a similar mechanical behaviour is observed, with equivalent values of module E (see in Fig. 7). The value of maximum stress varies slightly, but the difference keeps within the experimental scatter. To complete these results, same tests on cubic samples 10x10x10 mm must be made.
Fig. 7 : Compressions surves (ZWICK) in samples with various dimensions
We also performed compression and creep tests with strain measurements by optical strain measurements over variable surfaces.
3.3.2. Optical strain measurements
To support the previous result, experiments based on optical strain measurements. In a first instance, creep tests have been carried out, with the same conditions as previous tests; i.e. with a nominal stress of 0.25MPa.
14th International Conference on Experimental Mechanics
According to the previous results, the representative surface seems to be between 8 and 12mm². These mechanical tests series in several sample dimensions will allow to refining the previous result, and to see if the minimal surface is 10mm² to be representative of the bulk deformation. It corresponds to about 30 cells along the surface side, which is consistent with previously reported values for metals [8, 9].
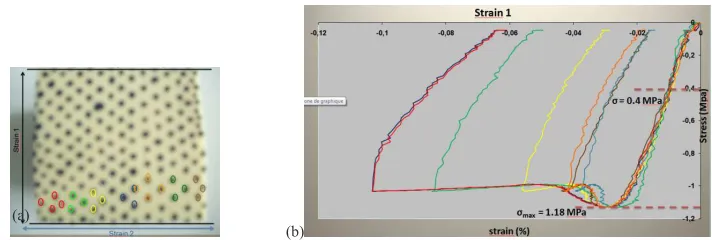
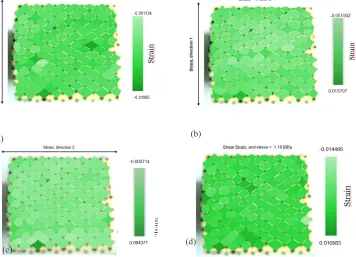
Such an analysis makes sense only if the size-effect can be dissociated from a possible strain heterogeneity enhanced by the mechanical test. To check this, compression have been carried out (one cycle of load –unload) with the same optical strain measurement software. The purpose of this test was to analyze the deformation level in various areas of the surface, and to determine if the deformation is homogeneous. A stress-strain curve can be obtained for each group of marks. Deformation values (1 and 2) for each quadruplet have been calculated (see Fig. 9 for the square of points) in 0.4MPa (at the end of the linear regime) and in maximum stress: 1.18MPa. On the part (b) of Fig. 9, the evolution of deformation can be followed according to the applied nominal stress for each groups of mark (to see Fig. 9 (a)). These curves are drawn for every group of marks, and each level of deformation is associated to a colour level. Then the global response of the material can be represented (for strain in direction 1, 2, and shear strain).
In Fig. 10, deformation seems to be homogeneous, regardless of the direction and the stress level. This result makes relevant the previous analysis over several surface sizes.
Fig. 9: (a) initial view of the tested sample with marks and strain direction; (b)stress-strain curves
corresponding to the marks quadruplets indicated in the left view, in the compression direction.
direction 2
4mm
8mm
12m m 18mm
28mm
38mm
Fig. 8 : Strain evolution measured from variably spaced marks during a compression creep test.
4 Conclusion
To predict long term behavior at low temperature, the TTSP can be used with a modification of range temperature, because no viscoelastic phenomena have been observed at low temperatures. In spite of that, at low temperatures, during creep tests, deformation has been observed which did not seem due to viscoelasticy. It will thus be necessary to determine which deformations and damage micro-mechanisms are activated at cryogenics temperature.
Moreover, for this study, the experimental background of the TTSP was based on a DMA technique. With this equipment small samples have been tested. Compression and creep tests have been carried out to determine from which surface a representative answer have been observed. It would seem that a minimum volume was reached between 8 and 12 mm3, which represented a bigger size sample than used in DMA experiments.
References
1. S. Ouellet, D. Cronin, M. Worswick, Polymer testing, 25, 731 – 743 (2006) 2. Anton Demharter, Cryogenics38 (1998) 113 – 117
3. J.S. Blazy, A. Marie-Louise, S. Forest, Y. Chastel et al, IJMS 46 (2004) 217 – 244 4. Fu-Pien Chang, Yi Ding, Composite : part B, 39 (2008) 42 – 49
5. P. Viot , HDR (2008)
6. J. Gibson, M.F. Ashby, Cellular solids, Structure and properties - second edition (1997) 7. C. Fuseau , Caractérisation thermomécanique des assemblages mixtes metal/composites et
metal/polymère, Thèse; (1998)
8. J.F. Rakow, A.M. Waas, Mechanics of materials37 (2005) 69-82
(a) (b)
(c) (d)