Identification of biomarkers and enriched pathways involved in lung cancer
Nikita Singh1, Mukesh Kumar2*, Atanu Bhattacharjee3, Prashant Kumar Sonker4, Agni Saroj4 1Department of Bioinformatics, M.M.V., Banaras Hindu University, Varanasi, India
2Department of Statistics, M.M.V., Banaras Hindu University, Varanasi, India
3Section of Biostatistics, Centre for Cancer Epidemiology, TMC Mumbai, India 4Department of Statistics, I. Sc., Banaras Hindu University, Varanasi, India
*Corresponding Author: Mukesh Kumar, PhD
Department of Statistics, MMV Banaras Hindu University Varanasi-221005
Email: mukesh.mmv@bhu.ac.in
Abstract
Objective: The aim of study is to find key genes and enriched pathways associated with lung cancer.
Participants and Methods: Differentially expressed genes (DEGs) data of 54674 genes based on stage, tumor and status of lung cancer was taken from 66 patients of African American (AAs)
origin. 2392 DEGs were found based on stage, 13502 DEGs were found based on tumor, 2927
DEGs were found based on status having p value (p<0.05).
Results: Total 33 common DEGs were found from stage, tumor and status of lung cancer. Gene ontology (GO) and KEGG pathway enrichment analysis was performed and 49 significant
pathways were obtained, out of which 10 pathways were found to be exclusively involved in
lung cancer development. Protein-protein interaction (PPI) network analysis found 69 nodes and
324 edges and identified 10 hub genes based on their highest degrees. Module analysis of PPI
found that ‘Viral carcinogenesis’, ‘pathways in cancer’, ‘notch signaling pathway’, ‘AMPK
signaling pathways’ had a close association with lung cancer.
Conclusion: These identified DEGs regulate other genes which play important role in growth of lung cancer. The key genes and enriched pathways identified can thus help in better
identification and prediction of lung cancer.
Keywords
Lung cancer, biomarker, gene ontology, protein-protein interaction networks, survival analysis
Introduction
Worldwide mortality from lung cancer growth expanded from 3.5 million in 1990 to 4.2 million
in 20151 and it is assessed that there will be 2.1 million new lung cancer incidents and 1.8 million
deaths in 2018, representing (18.4%) incidents of cancer-related mortality.2 Lung cancer is a
heterogeneous disease and various factors including hereditary transformations, ecological
components and individual habits can add to cancer incident, evolution and metastasis.3
According to histological disparity, lung cancer can be partitioned into non-small cell lung
cancer (NSCLC) and small-cell lung cancer (SCLC), of which NSCLC representsroughly85%,
and 30% of SCLC cases can be named as lung squamous cell carcinoma.4 It is reported that a
number of genes and biological, cellular and molecular pathways take part in these processes.
Hence, it is crucial to understand the important mechanisms that lead to the onset and
development of lung cancer in order to produce diagnostic and therapeutic strategies. A past
researches on gene expression profiling in cancer used microarray tools for examining oncology5
however some of these studies have been directed on lung cancer with comparative analysis of
the DEGs6, and a very authentic biomarker profile refining cancerous tissues from normal ones
remains to be discovered.
In the present study, gene expression data of mRNAs and miRNAs have been taken from 66
patients of AAs origin. A total of 54674 genes were screened, on the basis of stage (I or II),
tumor (present or absent) and status (dead or alive). Student’s t-test for difference of means
assuming unequal variances was applied to test the datasets and two-tailed (p<0.05) was
considered statistically significant. Out of these, 2392 DEGs from stage of lung cancer, 13502
DEGs from tumor and 2979 DEGs from status were obtained. 33 common DEGs from stage,
tumor and status of the lung cancer were found. These 33 DEGs were screened further for gene
ontology (GO) using DAVID database. The genes were analysed in STRING database for
showing PPI network analysis. KEGG pathway analysis was also performed to see the pathway
enriched among these genes. Using Cytoscape software, PPI was visualized. Using MCODE
plug-in of Cytoscape, module analysis was performed and top 3 modules involved in lung cancer
were identified which depicted top 6 pathways with genes involved in them. Using
CYTOHUBBA plug-in of Cytoscape, top 10 hub genes involved in the lung cancer were
identified along with their respective ranks and score. In survival analysis, Kaplan-Meier (KM)
curve was drawn to represent the survival of lung cancer patients. The aim of this study is to find
biomarkers for identification and prospects of lung cancer.
Materials and methods
Gene expression data: The mRNA and miRNA of 66 patients of AAs origin was used for analysis purpose. The DEGs data was based on stage, tumor and status of lung cancer patients.
Data is obtained from gene omnibus website https://www.ncbi.nlm.nih.gov/geo/. The accession number of the data is GSE102287.
Student’s t-test for identification of significant genes: We have taken 54647 DEGs in 66
patients of AAs origin. We have categorized the genes on the basis of stage, tumor and status.
Student’s t-test is applied to test the difference of means for unequal variances on the basis of
p-value. This procedure is adopted to screen the gene expression data and find out the DEGs based
on their(p<0.05) Table 2.
Heat map: Heat map is used to represent the level of expression genes with comparable samples. By using R software we have created heat maps to show gene expressions level for
DEGs obtained based on stage 1 and stage 2. Thereafter the patients were classified as tumor
present, tumor absent and dead and alive status. Now the gene expression levels are shown by
yellow, orange and red colors with gene affy ID and patients ID along with x-axis and y-axis
respectively.
GO term enrichment analysis: GO of these 205 DEGs were done using DAVID Database that is available at https://david.ncifcrf.gov/.GO is a major bioinformatics activity to combine the
demonstration of gene and gene product attributes with all variety. The aim is to: 1) maintain and
expand its restricted vocabulary of gene and gene product attributes; 2) interpret genes and gene
products data; and 3) provide tools for easy access to all aspects of the data.7
Establishment of PPI Network: Search Tool for Retrieval of the Interacting genes(String) online database is used for representation of PPI networks and available at https://string-db.org/ .
A frame work comprehension of cell function requires information of all practical relations
between the expressed proteins. The STRING database is used to collect and combine this
information and predicted Protein-Protein Interaction (PPI) for a large number of organisms.8
Investigating the predicted interaction networks can recommend new directions for future
computational research and provide cross-species expectations to efficient associated mapping.9
String database gave the list of most significantly enriched pathways by KEGG pathway
with various colors were highlighted. These pathways showed genes that were involved in the
NSCLC with their false discovery rates.
Cytoscape: This is online open software platform for representation molecular communication networks and genetic pathways and combine these networks with annotations, gene expression profiles and other state of data and can be downloaded from https://cytoscape.org/. Cytoscapeis
used to provide a basic set of features for data integration, analysis, and representation. The
string file was saved in .tsv format and was imported in Cytoscape software. Using the MCODE
(molecular complex detection) plug-in of Cytoscape, top 3 modules of protein-protein
interactions were visualized that are seen to be involved in the lung cancer. By using
CYTOHUBBA plug-in of cytoscape, we found top 10 hub genes which are highly involved in lung cancer.
TCGA database: TCGA database offers various computational tools that can be used to analyze data. One such tool is cBioPortal for cancer genomics (http://www.cbioportal.org/). The cBioPortal for Cancer Genomics provides visualization, analysis and download of large-scale
cancer genomics data sets. This tool was used to find the role of hub genes in NSCLC. Oncoprint
and cancer type summary was studied for all the hub genes.
Survival analysis: Survival analysis is used to analysis of life time until one or more event happen. The KM curve is used to estimate the survival of patients from time dependent data. In
medical sciences, it is often used to find the fraction of patients living for a certain time after
treatment. Here, we have plotted the KM curve using R software for the stage-wise survival of
lung cancer patients.23
Results
After applying student’s t-test for unequal variances on 54647 genes with their gene expression
values, we obtained 33 common DEGs. The selected genes had (p<0.05) in (Table 2). The
description of cancer patients is shown in (Table 1).
A total of 6 heat maps were plotted to show gene expressions level for DEGs obtained based on
stage 1 and stage 2, tumor present and absent, and dead status and alive status. The yellow color
in the heat map indicates lower values of gene expression values while the orange ones are
intermediate and red ones have the highest values which had high values for the gene expression
online database DAVID. The genes were significantly enriched in biological process (BP),
molecular function (MF) and cellular component (CC) (Table 3). The genes were enriched
significantly in BP, including ‘directive of receptor activity’, ‘Anterior/posterior pattern specification’. The genes enriched in MF, including ‘Poly (A) RNA binding’ and ‘Protein
binding’. KEGG pathway analysis is used to identify the pathways involving these genes. A total
of 24 significantly enriched pathways were identified (Table 4). The most significantly enriched
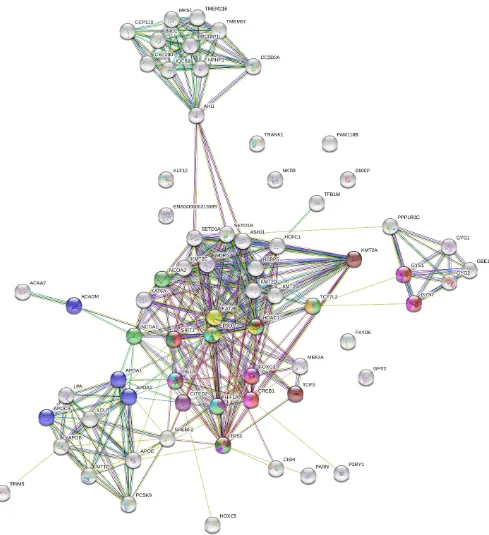
pathways related with lung cancer were ‘AMPK signaling pathway’, ‘PPAR signaling pathway’, ‘pathways in cancer’, ‘PI3K-Akt signaling pathway’, ‘notch signaling pathway’, ‘viral carcinogenesis’, ‘microRNAs in cancer’, ‘HIF-1 signaling pathway’ ,’Valine, leucine and isoleucine degradation’ and ‘ Wnt signaling pathway’ (Figure 2 and Table 5).The PPI network is
constructed to classify the mainly important proteins and genetic modules that may serve critical
roles in the growth of lung cancer. A total of 69 nodes and 324 edges were screened from PPI
network (Figure 2). The average node degree was 9.39, the average local coefficient clustering
was 0.694 and the PPI enrichment (p<0.01). Each gene was entrusted a degree that predicted
number of adjacent nodes in the network and changes in proteins/genes. The top 10 hub genes
with the highest degrees in lung cancer were EP300 (E1A Binding Protein P300), TP53 (Tumor
protein 53), KAT2B(lysine acetyltransferase2B), HDAC1 (Histone Deacetylase 1), SIRT1
(sirtuin 1), KMT2A (Lysine Methyltransferase 2A), ASH2L (histone lysine methyltransferase
complex subunit), SETD1B (SET Domain Containing 1B), SETD1A (SET Domain Containing
1A), KMT2C (Lysine Methyltransferase 2C) (Table 6 and Figure 3). EP300 has highest degree
of 29. It is found that high degree of these hub genes which play animportant role in maintaining
the entirePPI. In addition, to find the significance DEGs, the top 3 significant modules were
selected and functional interpretation of genes related with the modules were analyzed (Figure 4
and Table 7). The results described that these modules had pathways that were seen to play a
critical role in lung cancer. Module 1 was associated with viral carcinogenesis, pathways in
cancer, notch signaling pathway, microRNAs in cancer, wnt signaling pathway. Module 2 was
associated with AMPK signaling pathway, PPAR signaling pathway, PI3K-Akt signaling
pathway, HIF-1 signaling pathway. Module 3 was associated with AMPK signaling pathway,
pathways in cancer, wnt signaling pathway. cBioPortal is a computational tool present in TCGA
database that provides representation, analysis and download of cancer DEGs data. This tool is
used to evaluate the oncoprint (Figure 5), lung cancer type summary which depicts the
were exclusively involved in lung cancer EP300, TP53, KMT2A and KMT2C. The 4 genes
underwent mutations largely.KM plotted for the stage-wise survival curves of lung cancer AAs
patients. Stage 3 clearly depicts the lowest rate of survival among all the 3 stages (Figure 6).
Discussion
Cancer is basically a hereditary disease, and different hereditary changes collect during the
multistep process of carcinogenesis, which finally leads to anomalous excessive cell
development and malignant phenotype.10 Lung cancer is basically essential pulmonary
malignant tumor in terms of incidence and mortality.11 Early identification and efficient
treatment of lung cancer is need of the hour and it can be achieved by the identification of
significant genes and understanding their molecular mechanisms which play an important role in
causing lung cancer. DEGs data of various genes can be used for further functional analysis and
to screen biomarkers that can serve for early identification and remedial targets. Therefore, they
may help in finding of lung cancer in the early stages and can be used for the development of
targeted treatment.
In present study statistical and bioinformatics methods are applied to identify new candidate
genes that can serve critical roles in development of lung cancer. The data used here has gene
expression values of 54674 genes for 66 patients, being categorized on the basis of stage, tumor
and status of the lung cancer. A total of 33 common DEGs from stage, tumor and status were
obtained based on their p-value score calculated by t-test for difference of means with unequal
variances. Then, GO and KEGG pathway analyses are performed to find the associations of these
significant genes. Finally, a PPI network was constructed that depicted that these identified
DEGs directly do not play role in causing lung cancer, but they interact and regulate other
neighboring genes that play a very important role in development of lung cancer (Figure 2).
GO analysis is helpful for annotating genes and gene products. GO analysis in the
present study showed that these significant genes involved in biological process like ‘Regulation
of receptor activity’, Anterior/posterior pattern specification’, molecular functions like ‘Poly (A)
RNA binding' and 'Proteinbinding’. It is observed that defective functioning of biological
processes and body system status are important causes of tumor growth and evolution. Hence,
monitoring the expression of these genes may help in discovery of tumor mechanisms. The
KEGG pathway database carries methodical analysis of gene functions, linking genomics and the
KEGG pathways which are related with lung cancer and its growth were ‘AMPK signaling
pathway’, ‘PPAR signaling pathway’, ‘pathways in cancer’, ‘PI3K-Akt signaling pathway’, ‘notch signaling pathway’, ‘viral carcinogenesis’, ‘microRNAs in cancer’, ‘HIF-1 signaling pathway’, ’Valine, leucine and is oleucine degradation’ and ‘ Wnt signaling pathway’ (Figure 2
and Table 5).Taking pathways into consideration, AMPK plays a central role in the control of
cell growth, prevalence and autotrophic through the rule of mTOR activity, which is consistently
uncontrolled in cancer cells. Targeting of AMPK/mTOR is thus strategy in the growth of
remedial elements against NSCLC. 12 The PI3K pathway is frequently uncontrolled in lung.13
Cancer due to hereditary variation affecting its components resulting in increased PI3K signaling
PPAR-γ factor bring development and promote changes related with separation as well as
apoptosis in different lung carcinoma cell lines. 14 Thus, defects in PPAR signaling pathway can
promote tumor growth. In case of notch signaling pathway and Dang et al. found that the over
expression of Notch3 was perceived in 40% of patients with NSCLC, and that this over
expression was connected with a translocation including 19p.15 In HIF-1 signaling pathway,
Hypoxia-inducible factor-1α (HIF-1α) is over expressed in human lung diseases, especially in
NSCLC, and is firmly related with a propelled tumor grade, expanded angiogenesis, and
protection from chemotherapy and radiotherapy.16 In case of wnt signaling pathway, over
expression of Wnt-1, -2, -3, and -5a and of Wnt-pathway components Frizzled-8, Disheveled,
Porcupine, and TCF-4 is common in NSCLC and is associated with poor prognosis.17 p53 is the
most frequently mutated gene in lung cancer.18 Most clinical studies suggest that NSCLC with
TP53 alterations carries a worse prognosis and may be relatively more resistant to chemotherapy
and radiation. 19 Inactivation of TP53 capacity or its orderly pathway is a typical component of
human tumors that regularly relates with expanded danger, poor patient survival, and protection
from treatment.20-22
It is observed that many genes though not in our 33 common DEGs, comes into picture because
it is regulated by genes present in our initial DEGs list such as PPP1R3C, ACAA2, TRIM5,
PCSK9, P2RY1, CISH, PARN and KMT2A (Figure 2). Hence, it is clearly seen that the 33
DEGs do not directly participate in development of lung cancer but some of them influence and
regulate other genes which play key role in development of lung cancer. PPP13RC is predicted
functional partner of GYS1 AND GYS2. ACAA2 is neighbor of ACADM. TRIM5 and PCSK9
are in a cluster network of APOA1 and APOA2. P2Y1 is connected to CREB1. CISH is
KMT2A is the gene with high no. of degree among our 33 DEGs. It is connected to CREB1,
EP300, TP53, HDAC1 and SIRT1.
The string file is imported in cytoscape software and using CYTOHUBBA plug-in,
top 10 hub genes based on their degree was found. The gene with highest score was EP300,
followed by TP53 and KAT2B (Figure 3 and Table 6). These 10 hub genes played important role
in growth of lung cancer. Using MCODE plug-in of cytoscape, top 3 modules of this network
were seen which were again observed to take part in pathways that caused lung cancer (Figure 4
and Table 7). The oncoprint and cancer summary type study is done by cBioPortal of TCGA
database shows that TP53 is most mutated gene among all the top 10 hub genes. Also among the
10 hub genes, only 4 genes are exclusively involved in lung cancer viz. EP300, TP53, KMT2C
and KMT2A. Cancer type summary is depicted in figure 6. The survival analysis was done and
KM Plot was plotted which demonstrated that Stage 3 clearly has the lowest rate of survival
among all the 3 stages.
Hence, this study made us to reach on a conclusion that DEGs may directly be
involved in the pathways that lead to the development of cancer or may sometimes be indirectly
involved like influencing and regulating other genes and their pathways that may play a crucial
role in development of a tumor or a cancer.
Conclusion
Overall, through identification and functional analysis of DEGs we identified Regulation of
receptor activity, anterior/posterior pattern specification and protein binding as significant terms
for lung cancer. The initial 33 DEGs found in this study trigger or influence other neighboring
DEGs that may be directly involved in the onset or development of lung cancer. Although, it
may be early to suggest that these DEGs might be ready for clinical trials, it is clearly a direction
that wants further attention. All these results may help us in better diagnosis and prognosis of
lung cancer and may pave way for better treatment of the disease.
Ethical statements:
The current study has been done based on secondary data source. Data is obtained from gene
omnibus website https://www.ncbi.nlm.nih.gov/geo/. There is no need of ethical approval for this
study.
Conflicts of Interest: The authors declare no conflict of interest.
Author Contributions: All authors had full access to the data in the study and take
responsibility for the integrity of the data and the accuracy of the data analysis.
Conceptualization, MK.; Formal Analysis, NS, PKS, AS; Resources, AB; Writing‐Original
Draft, NS.
References
1.
Cohen AJ, Brauer M, Burnett R, Anderson HR, Frostad J, Estep K, Balakrishnan K, Brunekreef B, Dandona L, Dandona R, et al: Estimates and 25-year trends of the global burden of disease attributable to ambient air pollution: An analysis of data from the Global Burden of Diseases Study 2015. Lancet 389: 1907-1918, 2017.2.
Bray F, Ferlay J, Soerjomataram I, Siegel RL, Torre LA and Jemal A: Global cancer statistics 2018: GLOBOCAN estimates of incidence and mortality worldwide for 36 cancers in 185 countries. CA Cancer J Clin 68: 394-424, 2018.3.
Aran V, Victorino AP, Thuler LC and Ferreira CG: Colorectal cancer: Epidemiology, disease mechanisms and interventions to reduce onset and mortality. Clin Colorectal Cancer 15: 195-203, 2016.4.
Piperdi, B, Merla, A, & Perez-Soler, R. Targeting angiogenesis in squamous non-small cell lung cancer. Drugs, 74(4), 403-413(2014).5.
Descotes F, Dessen P, Bringuier PP, Decaussin M, Martin PM, Adams M, Villers A, Lechevallier E, Rebillard X, Rodriguez-Lafrasse C, et al: Microarray gene expression profiling and analysis of bladder cancer supports the sub-classification of T1 tumours into T1a and T1b stages. BJU Int 113: 333-342, 2014.6.
Sakashita H, Inoue H, Akamine S, Ishida T, Inase N, Shirao K, Mori M and Mimori K: Identification of the NEDD4L gene as a prognostic marker by integrated microarray analysis of copy number and gene expression profiling in non-small cell lung cancer. Ann SurgOncol 20 (Suppl 3): S590-S598, 2013.7.
The Gene Ontology Consortium, Michael Ashburner, Catherine A. Ball, Judith A. Blake, David Botstein, Heather Butler, J. Michael Cherry, Allan P. Davis, Kara Dolinski, Selina S. Dwight, Janan T. Eppig, Midori A. Harris,David P. Hill, Laurie Issel-Tarver, Andrew Kasarskis, Suzanna Lewis, John C. Matese, Joel E. Richardson, Martin Ringwald,Gerald M. Rubin, and Gavin Sherlock, “Gene Ontology: tool for the unification of biology”, HHS author manuscript, PMC3037419.8.
Damian Szklarczyk, John H Morris, Helen Cook, Michael Kuhn, Stefan Wyder, Milan Simonovic, Alberto Santos, Nadezhda T Doncheva,Alexander Roth, Peer Bork, Lars J. Jensen, and Christian von Mering, “The STRING database in 2017 : quality-controlled protein-protein interaction networks, made broadly accessible” , Nucleic acid research, vol. 45(database issue),2014 jan 4.10.
Carter SL, Eklund AC, Kohane IS, Harris LN and Szallasi Z: A signature of chromosomal instability inferred from gene expression profiles predicts clinical outcome in multiple human cancers. Nat Genet 38: 1043-1048, 2006.11.
Dela Cruz CS, Tanoue LT and Matthay RA: Lung cancer: Epidemiology, etiology, and prevention. Clin Chest Med 32: 605-644, 2011.12.
Han Dong; Li, Shao-Jun; Zhu, Yan-Ting; Liu, Lu; Li, Man-Xiang: LKB1/AMPK/mTOR Signaling Pathway in Non-small-cell Lung Cancer, Asian pacific journal of cancer prevention, 2013; vol.14 (issue 7).13.
Duronio V. The life of a cell: Apoptosis regulation by the PI3K/PKB pathway. Biochem. J. 2008;415:333–344.14.
Han S, Roman J. Peroxisome proliferators-activated receptor gamma: a novel target for cancer therapeutics? Anticancer Drugs. 2007;18:237–244.15.
Dang TP, Gazdar AF, Virmani AK, Sepetavec T, Hande KR, Minna JD, Roberts JR, Carbone DP. Chromosome 19 translocation, over expression of Notch3, and human lung cancer. J Natl Cancer Inst. 2000;92:1355–1357.16.
Qunzhou Zhang, Xudong Tang, Zuo-Feng Zhang, Rita Velikina, Shihong Shi and Anh D. Le“Nicotine Induces Hypoxia-Inducible Factor-1α Expression in Human Lung Cancer Cells via Nicotinic Acetylcholine Receptor–Mediated Signaling Pathways”. Clinical cancer research (2007).17.
Stewart DJ: “Wnt signaling pathway in non-small cell lung cancer”. J Natl Cancer Inst. 2014 Jan;106(1):djt356.18.
Olivier M, Petitjean A, Marcel V, et al. Recent advances in p53 research: an interdisciplinary perspective. Cancer Gene Ther. 2009; 16:1–12.19.
Akira Mogi and Hiroyuki Kuwano (December 2010), “TP53 Mutations in Nonsmall Cell Lung Cancer”, J Biomed Biotechnology, vol. 2011, 2011.20.
A. J. Munro, S. Lain, and D. P. Lane, “P53 abnormalities and outcomes in colorectal cancer: a systematic review,” British Journal of Cancer, vol. 92, no. 3, pp. 434–444, 2005.21.
B. Vogelstein, D. Lane, and A. J. Levine, “Surfing the p53 network,” Nature, vol. 16, pp. 307–310, 2000.22.
K. H. Vousden and X. Lu, “Live or let die: the cell's response to p53,” Nature Reviews Cancer, vol. 2, no. 8, pp. 594–604, 2002.
Table 1: Summary of cancer patients involved in study
Variable Number (%)
Total number of patients 66
Age, median (range) (years) 60 (32-76)
Male sex 38(57.5%)
Female sex 28(42.4%)
Smoking history 41.47(62%)
Cancer stages
Stage I Stage II and III
36(54.5%) 30(45.4%) Tumor Present Absent 32(48.4%) 34(51.1%) Status Dead Alive 26(39.3%) 40(60.6%)
Table 2: Common DEGs based on Status, tumor and status of lung cancer Gene Symbol Mean Standard
Deviation
P-Value Gene Description
NKTR 5.43 0.54 0.01 Natural killer cell triggering receptor
C12orf80 1.93 0.04 0.02 Chromosome 12 open reading frame
80
LOC101927406 2.57 0.06 0.04 Uncharacterized LOC101927406
ACAA2 3.63 0.38 0.04 Acetyl-CoA acyltransferase
GPX2 3.84 3.66 0.01 Glutathione peroxidase
PARN 9.39 0.35 0.02 Poly(A)-specific ribonuclease
PPP1R3C 8.42 1.77 0.01 Protein phosphatase 1 regulatory
subunit 3C
S100P 9.99 2.88 0.03 S100 calcium binding protein P
HOXC5 2.04 0.05 0.03 Homeobox C5
P2RY1 4.20 0.88 0.00 Purinergic receptor P2Y1
KLF12 2.14 0.03 0.04 Kruppel like factor
TRANK1 7.65 0.64 0.03 Tetratricopeptide repeat and ankyrin
repeat containing 1
FXYD5 10.92 0.56 0.01 FXYD domain containing ion
transport regulator 5
TRIM5 2.88 0.40 0.02 Tripartite motif containing 5
CISH 8.38 0.95 0.04 Cytokine inducible SH2 containing
protein
PCSK9 5.45 0.93 0.01 Proproteinconvertasesubtilisin/ kexin
SLIT1-AS1 2.18 0.04 0.01 SLIT1 antisense RNA 1
TFB1M 4.24 0.41 0.00 Transcriptional factor B1,
mitochondrial
SLX1A-SULT1A3
7.12 0.48 0.03 SLX1A-SULT1A3 readthrough (NMD
Candidate)
CC2D2A 4.43 0.61 0.02 Coiled-coil and C2 containing domain
2A
LOC100507277 1.87 0.04 0.04 Uncharacterized LOC100507277
FAM118B 3.78 0.38 0.00 Family with sequence similarity 118
member B
KMT2A 6.03 0.67 0.02 Lysine methyltransferase 2A
LOC100130502 1.78 0.06 0.03 Uncharacterized LOC100130502
Table 3: Gene Ontology analysis of DEGs
S.NO. CATEGORY TERM GENE COUNT P-VALUE
1. GO_BP_DIRECT Regulation of
receptor activity
2 8.5E-3
2. GO_BP_DIRECT Anterior/posterior
pattern specification
2 7.4E-2
3. GO_MF_DIRECT Poly(A) RNA
binding
4 7.4E-2
4. GO_MF_DIRECT Protein binding 12 8.0E-2
BP-biological process; FAT-functional annotation tool; MF-molecular function
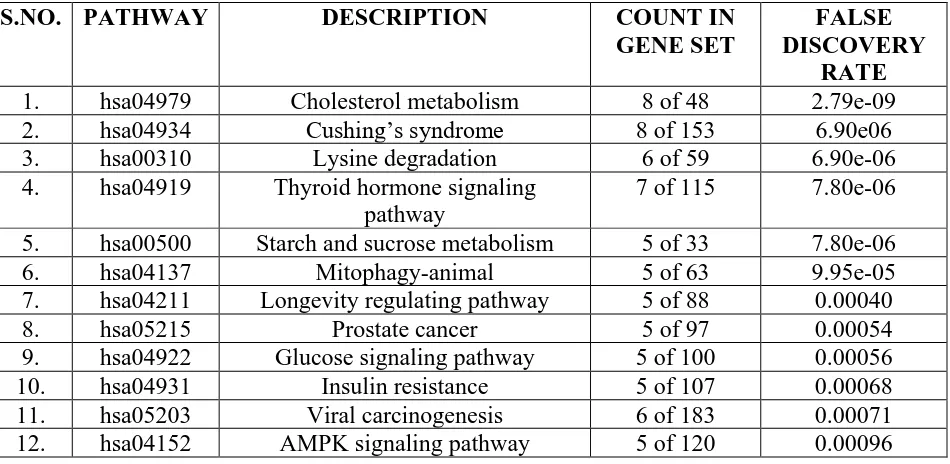
TABLE 4: List of most significantly enriched pathways of DEGs as analyzed by KEGG pathway analysis
S.NO. PATHWAY DESCRIPTION COUNT IN
GENE SET
FALSE DISCOVERY
RATE
1. hsa04979 Cholesterol metabolism 8 of 48 2.79e-09
2. hsa04934 Cushing’s syndrome 8 of 153 6.90e06
3. hsa00310 Lysine degradation 6 of 59 6.90e-06
4. hsa04919 Thyroid hormone signaling
pathway
7 of 115 7.80e-06
5. hsa00500 Starch and sucrose metabolism 5 of 33 7.80e-06
6. hsa04137 Mitophagy-animal 5 of 63 9.95e-05
7. hsa04211 Longevity regulating pathway 5 of 88 0.00040
8. hsa05215 Prostate cancer 5 of 97 0.00054
9. hsa04922 Glucose signaling pathway 5 of 100 0.00056
10. hsa04931 Insulin resistance 5 of 107 0.00068
11. hsa05203 Viral carcinogenesis 6 of 183 0.00071
13. hsa03320 PPAR signaling pathway 4 of 72 0.0017
14. hsa05166 HTLV-I infection 6 of 250 0.0029
15. hsa05202 Transcriptional misregulation in cancer
5 of 169 0.0036
16. hsa04975 Fat digestion and absorption 3 of 39 0.0040
17. hsa05200 Pathways in cancer 8 of 515 0.0042
18. hsa05167 Kaposi’s sarcoma-associated herpesvirus infection
5 of 183 0.0043
19. hsa4330 Notch signaling pathway 3 of 48 0.0059
20. hsa05165 Human papillomavirus infection 6 of 317 0.0070
21. hsa05213 Endometrial cancer 3 of 58 0.0090
22. hsa04213 Longevity regulating pathway-multiple species
3 of 61 0.0099
23. hsa04151 PI3K-Akt signaling pathway 6 of 348 0.0099
24. hsa05161 Hepatitis B 4 of 142 0.0107
25. hsa05031 Amphetamine addiction 3 of 65 0.0107
26. hsa05224 Breast cancer 4 of 147 0.0111
27. hsa05206 microRNAs in cancer 4 of 149 0.0113
28. hsa04917 Prolactin signaling pathway 3 of 69 0.0113
29. hsa04218 Cellular senescence 4 of 156 0.0123
30. hsa05220 Chronic myeloid leukemia 3 of 76 0.0133
31. hsa04977 Vitamin digestion and absorption 2 of 24 0.0178
32. hsa05168 Herpes simplex infection 4 of 181 0.0188
33. hsa05169 Epstein-barr virus infection 4 of 194 0.0228
34. hsa05016 Huntington’s disease 4 of 193 0.0228
35. hsa04916 Melanogenesis 3 of 98 0.0228
36. hsa04066 HIF-1 signaling pathway 3 of 98 0.0228
37. hsa05216 Thyroid cancer 2 of 37 0.0329
38. hsa04772 Neutrophin signaling pathway 3 of 116 0.0329
39. hsa04110 Cell cycle 3 of 123 0.0374
40. hsa05418 Fluid shear stress and
atherosclerosis
3 of 133 0.0419
41. hsa05160 Hepatis C 3 of 131 0.0419
42. hsa04915 Estrogen signaling pathway 3 of 133 0.0419
43. hsa04910 Insulin signaling pathway 3 of 134 0.0419
44. Hsa04068 FoxO signaling pathway 3 of 130 0.0419
45. Hsa00071 Fatty acid degradation 2 of 44 0.0419
46. Hsa05030 Cocaine addiction 2 of 49 0.0427
47. Hsa01212 Fatty acid metabolism 2 of 48 0.0427
48. Hsa00280 Valine, leucine and isoleucine degradation
2 of 48 0.0427
49. Hsa04310 Wnt signaling pathway 3 of 143 0.0443
PATHWAY DESCRIPTION FALSE DISCOVERY
RATE
COLOR REPRESENTA
TION
hsa05203 Viral carcinogenesis 0.00071 Dark purple
hsa04152 AMPK signaling pathway 0.00096 Pale yellow
hsa03320 PPAR signaling pathway 0.0017 Cyan
hsa05200 Pathways in cancer 0.0042 Dark green
hsa4330 Notch signaling pathway 0.0059 Pink
hsa04151 PI3K-Akt signaling
pathway
0.0099 Yellow
hsa05206 microRNAs in cancer 0.0113 Green
hsa04066 HIF-1 signaling pathway 0.0228 Dark blue
hsa00280 Valine, leucine and
isoleucine degradation
0.0427 Purple
hsa04310 Wnt signaling pathway 0.0423 Red
Table 6: Top 10 Hub genes with their ranks and scores respectively
Rank Name Score
1 EP300 (E1A Binding Protein P300) 29
2 TP53 (Tumor protein 53) 25
3 KAT2B(K(lysine) acetyltransferase 2B) 24
4 HDAC1 (Histone Deacetylase 1) 22
5 SIRT1 (sirtuin 1) 17
6 KMT2A(Lysine Methyltransferase 2A) 16
6 ASH2L (histone lysine methyltransferasecomplex subunit)
16
6 SETD1B (SET Domain Containing 1B) 16
6 SETD1A (SET Domain Containing 1A) 16
10 KMT2C (Lysine Methyltransferase 2C) 15
Table 7: Top 3 modules from PPI network along with the genes involved
MODULES PATHWAY INVOLVED GENES INVOLVED
1. Viral carcinogenesis KAT2B,EP300,RELA,CREB1,TP53
Notch signaling pathway KAT2B,HDAC1,EP300
MicroRNAs in cancer HDAC1,EP300,TP53
Wnt signaling pathway TP53,EP300
2. Viral carcinogenesis RELA,CREB1
AMPK signaling pathway SIRT1,FOXO3,CREB1
PPAR signaling pathway ACADM,APOA1,APOA2,APOC3
Pathways in cancer NCOA3,NCOA1,RELA,HIF1A
PI3K-Akt signaling pathway RELA,FOXO3,CREB1
HIF-1 signaling pathway HIF1A,RELA
Valine, leucine and isoleucine degradation
ACAA2,ACADM
3. AMPK signaling pathway GYS1,GYS2
PI3K-Akt signaling pathway GYS1,GYS2
Pathways in cancer TCF7L2
a) b)
e) f)
Figure 3: Top 10 Hub Genes with highest degree of interaction in Lung cancer as analyzed by CYTOHUBBA plugin of Cytoscape.
(B) (C)
Figure 4: Top 3 modules of PPI networks. Nodes and links show human proteins and their PPI. A) Enriched pathway of module A; B) Enriched pathway of module B; C) Enriched pathway of module C