Article
1
Exploring the Vital Worker Over Time – A
2
Week-Level Study on How Positive and Negative
3
Work Events Contribute to Affect and Sustain Work
4
Engagement
5
Oliver Weigelt 1,2,*, Antje Schmitt 3, Christine Syrek 4 and Sandra Ohly 5
6
1 Work and Organizational Psychology, University of Hagen, D-58084 Hagen, Germany
7
2 Organizational and Personnel Psychology, University of Rostock, D-18051 Rostock, Germany,
8
[email protected] (O.W.)
9
3 Organizational Psychology, University of Groningen, The Netherlands; [email protected] (A.S.)
10
4 Business Psychology, University of Applied Sciences Bonn-Rhein-Sieg, Von-Liebig-Str. 20, D-53359
11
Rheinbach, Germany, [email protected] (C. S.)
12
5 Business Psychology, University of Kassel, D-34121 Kassel, Germany, [email protected] (S.O.)
13
14
* Correspondence: [email protected]
15
Abstract: Although work events can be regarded as pivotal elements of organizational life, only a
16
few studies have examined how positive and negative events relate to and combine to affect work
17
engagement over time. Theory suggests that to better understand how current events affect work
18
engagement (WE), we have to account for recent events that have preceded these current events.
19
We present competing theoretical views on how recent and current work events may affect
20
employees (e.g., getting used to a high frequency of negative events or becoming more sensitive to
21
negative events). Although the occurrence of events implies discrete changes in the experience of
22
work, prior research has not considered whether work events actually accumulate to sustained
23
mid-term changes in WE. To address these gaps in the literature, we conducted a week-level
24
longitudinal study across a period of 15 consecutive weeks among 135 employees, which yielded
25
849 weekly observations. While positive events were associated with higher levels of WE within
26
the same week, negative events were not. Our results support neither satiation nor sensitization
27
processes. However, high frequencies of negative events in the preceding week amplified the
28
beneficial effects of positive events on WE in the current week. Growth curve analyses show that
29
the benefits of positive events accumulate to sustain high levels of WE. WE dissipates in the
30
absence of continuous experience of positive events. Our study adds a temporal component and
31
informs research that has taken a feature-oriented perspective on the dynamic interplay of job
32
demands and resources.
33
Keywords: affective events; work engagement; sensitization-satiation effects; job
34
demands-resources model; experience sampling; growth curve modeling
35
36
1. Introduction
37
From a psychological perspective, organizational life can be understood in terms of a chain of
38
events [1]. Interestingly however, despite calls to take issues of time more seriously [2–4] researchers
39
in the field of occupational health psychology have only recently begun to consider dynamics in
40
relevant phenomena like employee strain and engagement [5] through the lens of work events [6].
41
Work engagement has been described as “a positive, fulfilling, work-related state of mind that is
42
characterized by vigor, dedication, and absorption” [7]. Work engagement has attracted
43
considerable research interest within the last fifteen years [8–10]. In particular job characteristics
44
have been identified as major drivers of work engagement [5,9,10] and empirical evidence
45
consistently shows that work engagement is determined by the interplay of different kinds of job
46
characteristics (e.g., autonomy, workload) [11]. However, it has been suggested that to understand
47
the experience of work and how it relates to employee outcomes like engagement, it is advisable to
48
go beyond generalized perceptions of how a job usually is (i.e., job characteristics as measured in
49
survey studies). More specifically, there is a need to consider dynamic aspects (i.e., fluctuation in job
50
characteristics from day to day) [11,12] as well as factors more proximal to employee experiences
51
over time [13]. Hence, a focus on enacted job characteristics, that is events and activities in the job as
52
they happen [13], is warranted. Work events differ from features of the job in that they are “discrete
53
and bounded in space and time“ [1]. Therefore, the study of work events rather than job
54
characteristics, provides the opportunity to add a temporal component to the research on job
55
characteristics [5] and to focus on work events as more proximal antecedents of work engagement
56
[12,13]. In other words, studying work events rather than job characteristics offers the opportunity to
57
specify and examine how the different things that happen to employees at work overtime combine
58
to affect work engagement. For instance, over the course of time employees are likely to experience a
59
series of positive events (e.g., praise from the supervisor after successfully finishing an important
60
task) and negative events (e.g., an episode of interpersonal conflict with colleagues). Although the
61
occurrence of each of these events is associated with short-term fluctuation in work engagement in
62
its own right [14], it is likely that last week’s work events carry over to affect work engagement still
63
during the current workweek [15]. Furthermore, different work events may interact to predict work
64
engagement. Put another way, receiving praise from one’s supervisor in this week’s team meeting
65
will foster work engagement, but preceding events like positive feedback from the supervisor or
66
interpersonal conflict with colleagues in the previous week may change the impact of the very same
67
event [see 1]. Hence, it is worthwhile to consider work events embedded within a chain of events
68
over time [16]. To account for the richness of the experience of work [17], we draw on a taxonomy of
69
work events, which encompasses a broad range of relevant positive and negative work events [6].
70
The taxonomy has been derived from qualitative research [6] and can be considered exhaustive with
71
regard to the most relevant work events from the perspective of employees. The taxonomy provides
72
an integrative framework covering a broad range of work events that have been considered in the
73
literature so far (see [6] for a literature review). We leverage this taxonomy to examine which specific
74
type of work event is most relevant to work engagement, besides the effects of positive and negative
75
work events in general terms.
76
Above, we have outlined that an event-oriented approach permits specifying the order of what
77
happens when and interactions among current events and recent events. Recently, Wickham and
78
Knee [15] have proposed applying experience sampling data to analyze such interactions between
79
current events and recent events to describe psychological processes of sensitization and satiation
80
over time. For instance, in the case of sensitization, last week’s conflict makes the currents week’s
81
conflict seem worse. That is, employees become more vulnerable or susceptible to work events with
82
each episode. Conversely, in the case of satiation, last week’s conflict makes this week’s conflict seem
83
less threatening. In other words, employees become less vulnerable or susceptible to work events
84
with each episode. We adopt this approach to examine sensitization and satiation to the study of
85
both positive and negative events predicting work engagement. Furthermore, a positive event like
86
praise from the supervisor may yield particularly strong effects on work engagement after a
87
negative event has occurred [16,see 18,19]. Hence, we extend the sensitization-satiation perspective
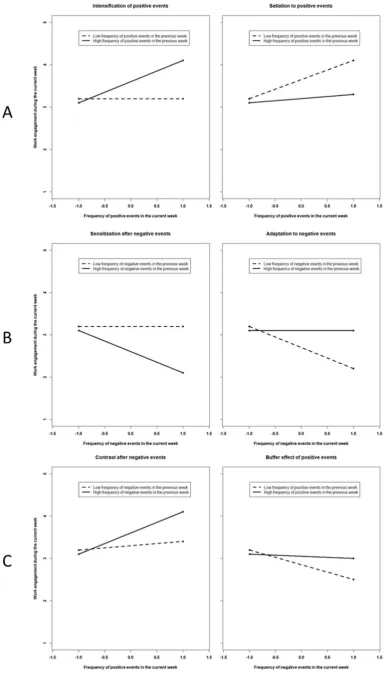
88
and scrutinize the interplay of positive events and negative events from one week to the next week.
89
Interestingly, experiencing a set of events in a given order (i.e., conflict with colleagues after praise
90
from the supervisor) may not be equivalent to the reverse order and it is likely to result in different
91
levels of work engagement. However, theory and empirical research on job characteristics and work
92
engagement so far have been largely focused on situational features work [11] and have rarely
93
considered temporal issues in depth. Put another way, research on job demands and resources
94
usually does not distinguish between experiencing a specific resource prior to or after being
95
for the order of positive and negative events and examine competing hypotheses. Given that job
97
characteristics (demands and resources) are linked to work events as more proximal precursors of
98
work engagement [12,13] our event-oriented temporal approach has implications beyond the study
99
of work events per se. In this sense, the different types of work events correspond to immediate
100
situational consequences of a broad range of job characteristics [12,13]. Hence, our research informs
101
researchers interested in the interplay of job demands and job resources and may contribute to
102
reconcile inconsistent findings on this interplay as well.
103
On a related note, it is important to gain insights into how frequent exposure to positive and
104
negative events may accumulate to affect work engagement over longer periods of time [5,20,21].
105
These insights are important as they pave the way to connect transient processes to longer-term
106
processes underlying employee well-being [20]. In the study of work events, researchers have rarely
107
gone beyond considering the cross-sectional associations or short-term effects of events over a
108
couple of hours [see 6 for a review]. Hence, we know little about sustained effects due to the
109
accumulation of negative or positive events over time. However, if work events do not have
110
longer-term implications for individual outcomes, one may question their practical relevance [20].
111
Conversely, studying accumulation effects may contribute to gain insights in how mundane events
112
in the daily grind of work add up and lead to potentially profound changes in work engagement
113
over time. We therefore conducted a week-level diary study over a period of four months, which fits
114
these aims best: Capturing meaningful events shortly after they happen, but at the same time
115
monitoring mid-term changes in work engagement applying an intensified longitudinal design.
116
Our study contributes to the literature in at least two ways. First, we consider sensitization and
117
satiation to positive and negative events. In a similar vein, we study how positive and negative
118
events combine to affect work engagement from week to week. In this sense, we follow the call for
119
applying experience sampling data for analyzing the effects of work events within the context of a
120
history of preceding events [1,15]. Second, we add a longitudinal perspective and consider whether
121
the frequent occurrence of work events predicts mid-term trajectories in work engagement over four
122
months.
123
1.1. What Happens in the Short Run: Work Events as Antecedents of Work Engagement
124
In recent years, evidence on antecedents of work engagement at the intraindividual level has
125
started to accumulate [11]. However, links between work events and work engagement have rarely
126
been considered explicitly. According to Weiss and Cropanzano [12] affective events are “things
127
[that] happen to people in work settings” to which “people react emotionally” ( p. 11). From the
128
perspective of conservation of resources theory [22] positive events signal the availability of
129
resources or opportunities for resource gain [23]. Given that positive work events refer to
130
experiences that either overlap in content with or are triggered by resources such as rewards or
131
reinforcement [11,24,25], we assume that positive events at work are positively related to work
132
engagement. Accordingly, positive work events, such as praise from the supervisor, predict work
133
engagement within [18,26] and between individuals [25]. By contrast, negative events can be
134
considered factors that detract attention and may inhibit engagement in the focal tasks [27]. So far,
135
empirical evidence on negative events and work engagement has been mixed. One study has
136
favored significant negative links between negative events and work engagement at the day-level
137
[14,see also 18]. By contrast, other researchers found negligible lagged associations with work
138
engagement [28]. Their results suggest no lagged main effects of previous day-positive event
139
intensity on work engagement the next day. Moreover, in some studies negative events
140
paradoxically even yielded beneficial lagged effects on job satisfaction [16] and work engagement
141
[18]. More specifically, these studies suggest that we need to account for what happens in the
142
aftermath of the focal events. Events probably do not affect employee well-being in isolation and it is
143
unlikely that “participants in diary studies … become a tabula rasa once they have completed the
144
diary report for a given interval” [15]. Therefore, in this study, we add a temporal component and
145
consider work events embedded in a series of events that may happen to an employee over time
146
week to affect work engagement. For the other, we consider how past events affect the impact of
148
current work events. Given that there are concurring views of how the interplay of work events
149
might look like, we derive and state competing hypotheses. Prototypical patterns of interactions are
150
depicted in Figure 1. Panel A refers to prototypical patterns of work engagement which may arise
151
from the interaction of current x lagged positive events. Panel B describes prototypical patterns for
152
interactions of current x lagged negative events. Finally, Panel C illustrates how positive events and
153
negative events may combine over time to affect work engagement. Given that we aim to extend the
154
perspective beyond prior day-level research, we focus on links and interactions at the week-level – a
155
time frame rarely applied to work events. This approach appears adequate, because the seven-day
156
week is a salient unit for structuring time [29]. Furthermore, associations from week to week tap into
157
less transient and more profound effects over time [30].
158
1.2. Temporal Patterns of Positive Events
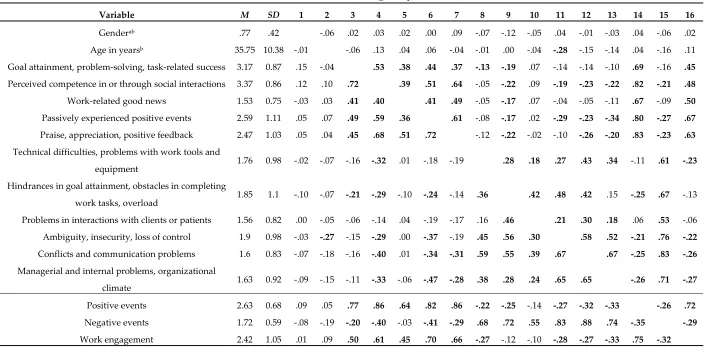
159
While the concurrent association between positive events and work engagement is
160
well-established [18,14,25,26,see also 28], the carryover effects of positive events on work
161
engagement have rarely been considered [see 28 for the only exception]. However, their study was
162
focused on negative event intensity and several features of their design (e.g., events sampled on
163
three consecutive day three days only, time frame of focal measures referred to the day level), their
164
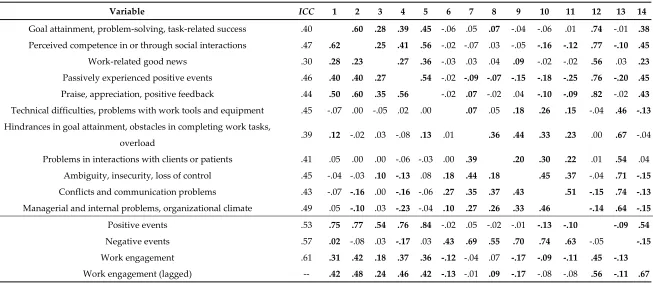
measures (e.g., affective reaction to events vs. frequency of events as predictor), and their focal
165
analyses (e.g., coefficients for positive events when controlling for several other aspects) prevent us
166
from drawing strong conclusions regarding lagged effects of positive events per se. Basically, there
167
are two perspectives: First, positive events experienced in the course of the previous workweek may
168
linger on to affect work engagement in the current week, for instance by means of positive reflection
169
(e.g., about successfully finishing a project) [31] or capitalization on the same event through social
170
sharing with others [32]. Second, positive events from the previous workweek may change the way
171
current positive events are perceived and experienced. To investigate these temporal processes,
172
Wickham and Knee [15] have suggested applying interactions of current events (concurrent) and
173
more recent events (lagged) to experience sampling data. As illustrated in Panel A of Figure 1, there
174
are two prototypical patterns of the interaction. On the one hand, employees may get used to high
175
frequencies of positive events. For instance, research on the hedonic treadmill suggests that
176
individual standards may change and positive events will be taken for granted, when positive
177
events have occurred frequently before [33]. That is, in the light of many positive events in the
178
previous week, currently high frequencies of positive events have a reduced impact on work
179
engagement. Throughout this manuscript, we label this pattern satiation effect (right side of Panel A
180
in Figure 1). On the other hand, positive events in the past may contribute to benefit even more from
181
current positive events, as positive events broaden awareness for positive events which might follow
182
[34]. Throughout this manuscript, we label this pattern intensification effect (right side of Panel A in
183
Figure 1). Positive events may even trigger behaviors of the individual that provoke positive events
184
in the future [see 35]. Given that there are competing theoretical views and prior empirical results do
185
not allow for firm conclusions, we state two competing hypotheses for satiation vs. intensification
186
effects:
187
Hypothesis 2. Concurrent positive events in week n and lagged positive events in week n-1 interact to predict
188
work engagement in week n. Lagged positive events (a) amplify (intensification) or (b) alleviate the effect of
189
191
1.3. Temporal Patterns of Negative Events
193
The rationale regarding sensitization and satiation effects presented above can also be applied
194
to negative events. Prototypical patterns of work engagement are illustrated in Panel B of Figure 1.
195
Negative work events in the previous workweek may affect employees even after a couple of days
196
have passed [36,see also 28]. So, negative events in the current workweek may shift attention to
197
negative cues in the environment and make employees react more sensitively to negative events
198
during the next workweek [21,see also 37]. In line with this perspective, [38] found that individuals
199
reacted more sensitive to negative social events on a given day, when negative events had preceded
200
the day before. A prototypical pattern of work engagement is depicted on the left side of Panel B in
201
Figure 1. Throughout this manuscript we label this pattern sensitization effect.
202
By contrast, from the perspective of the allostatic load model [39], it is also plausible that
203
employees will adapt to negative events and will not mind negative events, when they re-occur. This
204
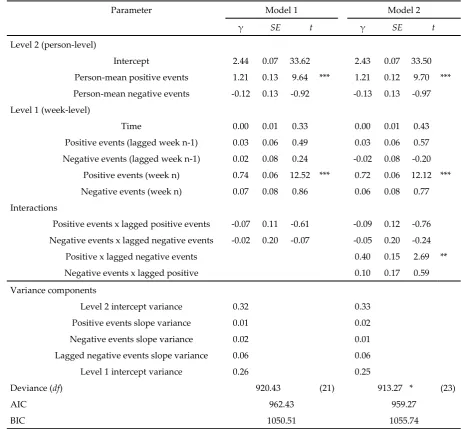
may be because employees might become more proficient in dealing with negative events [40] or
205
become more resilient due to having been challenged before [41]. Throughout this manuscript, we
206
label this pattern adaptation [42]. In sum, negative events in the previous workweek, may make
207
employees either more susceptible to the detrimental effects of negative events (sensitization) or
208
may contribute to adapting to negative events (adaptation, see right side of Panel B in Figure 1).
209
Again, we state two competing hypotheses:
210
Hypothesis 2. Concurrent negative events in week n and lagged negative events in week n-1 interact to
211
predict work engagement in week n. Lagged negative events (a) amplify (sensitization) or (b) reduce the effect of
212
concurrent negative events (adaptation).
213
1.4. The Interplay of Positive and Negative Events over Time
214
Beyond sensitization and satiation effects, our study addresses the question of whether
215
experiencing positive events in the aftermath of negative events results in different levels of work
216
engagement than experiencing positive events after a period of few positive events. Above we have
217
discussed that positive events in the previous week may broaden awareness for and strengthen the
218
impact of current positive events. In a similar way, negative events in the past may also change the
219
way current positive events are perceived. For instance, experience sampling research on work
220
events and after work fatigue suggest that employees benefit most from positive events in the face of
221
negative events and in the face of chronically high job demands [19]. Other researchers have argued
222
that work engagement results from a shift in affect in the aftermath of negative events – that is
223
down-regulation of negative affect and up-regulation of positive affect [18]. Empirically these
224
authors found that negative events enhance, rather than impair work engagement, when followed
225
by high levels of positive affect. Given that prior research is mute on the triggers of affective shift
226
and the beneficial effects on work engagement, we consider positive work events as predictors,
227
because positive events have consistently been linked to positive affective outcomes [6]. Positive
228
events in the aftermath of negative events may be particularly beneficial for work engagement,
229
because positive events create a contrast effect at the backdrop of prior negative events [43,44,see
230
also 19]. Accordingly, and in line with the contrast after negative events perspective, we expect that
231
negative events in the past and current positive events interact to predict work engagement. A
232
prototypical pattern of work engagement is depicted on the left side of Panel C in Figure 1.
233
Throughout this manuscript we label this pattern contrast effect. More specifically, we expect that
234
positive events in the aftermath of negative events will have a particularly strong effect on work
235
engagement:
236
Hypothesis 3. Concurrent positive events in week n and lagged negative events in week n-1 interact to
237
predict work engagement in week n. Lagged negative events amplify the effect of positive events (contrast effect
238
To gain a more complete picture of how positive and negative events interact over time, we
240
need to consider whether positive events in the past change the impact of current negative events.
241
We argue, that positive events in the previous workweek may also contribute to build up personal
242
resources [23,24] which change the way current negative events affect work engagement. For
243
instance, high frequencies of positive events in the previous workweek are associated with positive
244
affect [6] and may therefore replenish coping resources [45]. In this sense positive events likely
245
strengthen self-efficacy [46] and self-regulation capacity [47] as personal resources [see for instance
246
48]. Hence, after experiencing positive events in the previous workweek employees may be
247
well-equipped to face negative events in the current week. In line with this idea, [14] found that
248
habitual acceptance as a personal resource buffers the detrimental effects of negative events on work
249
engagement at the day-level. Given that positive events likely feed personal resources and resources
250
in turn attenuate the detrimental effects of negative events on work engagement, we assume that
251
positive events in the previous workweek attenuate the impact of negative events in the current
252
week. Throughout this manuscript we label this pattern buffering effect. A prototypical pattern of
253
work engagement is depicted on the right side of Panel C in Figure 1.
254
Hypothesis 4. Concurrent negative events in week n and lagged positive events in week n-1 interact to
255
predict work engagement in week n. Lagged positive events attenuate the effect of current negative events
256
(buffering effect).
257
1.5. What Happens in the Long Run: Sustained Effects of Work Events Over Time
258
Recently, Ilies, Aw, et al. (2015) have reviewed theory and empirical evidence on
259
intraindividual models of well-being and noted that we need to connect transient processes (as
260
reflected in fluctuations in well-being from day to day) to longer-term processes (as reflected in
261
changes in well-being over periods of weeks, months, or years). If applied research provides
262
evidence that, for instance, positive events are associated with sustained changes in work
263
engagement over longer periods of time these findings would underscore the practical relevance of
264
these concepts in organizations from a practitioner’s point of view. Whereas associations at the day-
265
or week-level may reflect fluctuations around characteristic average levels that might be largely
266
stable over time [see also 33], sustained effects address the issue of whether work events indeed
267
yield chronically beneficial effects [20]. Given that prior intraindividual research has not considered
268
this aspect empirically, we examine whether frequent exposure to positive and negative events is
269
associated with mid-term changes in work engagement over time at the interindividual level.
270
Drawing on conservation of resources theory [22], it has been suggested that work engagement
271
results from resource abundance [49,50]. According to Halbesleben and colleagues [24] positive
272
aspects in organizational settings like social support, justice, or trust act as signals that the
273
“investment of resources will help the individual realize his or her goal of achieving more
274
resources.” (p. 1347). Given that positive events tap into these kinds of signals, we assume that a
275
high frequency of such signals over time is associated with gains in work engagement. The frequent
276
experience of positive events over time should accumulate to feed higher levels of work
277
engagement. In other words, trajectories of work engagement should be more positive (steeper
278
increase) when positive events occur frequently compared to when positive events occur
279
infrequently.
280
Hypothesis 5. Trajectories in work engagement differ between persons dependent upon the frequency of
281
positive events over time. Higher (lower) frequencies of positive events are associated with steeper (flatter)
282
increases in work engagement.
283
Given the pioneering nature of our study with regard to mid-term trajectories of work
284
engagement dependent upon accumulation of work events, we do not state a formal hypothesis on
285
the effects the frequency of negative events over time might have. However, we do investigate the
286
positive events. Our analyses, therefore, also provide insights into the relative importance of positive
288
vs. negative events for work engagement in the long run
289
2. Materials and Methods
290
2.1. Procedure
291
Drawing on the rationale outlined above we conducted a week-level diary study across a
292
period of four months. Participants filled in a general survey containing demographics and other
293
variables assumed to be largely stable across time. After registering for the study and filling out the
294
general survey participants received emails inviting them to complete short diary questionnaires
295
across a period of fifteen consecutive weeks with two questionnaires per week. The procedure and
296
materials of this study have not undergone examination by an ethics committee, as the measures and
297
procedures of our study followed the protocols of standard self-report experience sampling research
298
in applied psychology, and we did not touch sensitive topics (like e. g. sexual orientation). Our study
299
fully complied with the standards of the Department of Psychology at the University of Hagen,
300
which included strict guidelines to guarantee anonymity of the self-reported data. Individuals
301
interested in participating in our study were informed about the general aims and the protocol of the
302
study before their participation. Our protocol did not include any form of deception of participants.
303
Participation was voluntary and participants had the opportunity to quit whenever they wanted.
304
2.2. Sample
305
Our 135 participants were employees who were enrolled in a psychology distance learning
306
program at a German university that offers these courses primarily for individuals who study
307
besides their regular jobs and occupations. Participants received course credit for filling out the
308
general survey and the diary questionnaires. Credit was commensurate with the number of
309
completed weekly surveys and participants, who completed ten or more surveys received some
310
extra credit.
311
Seventy-seven percent of our participants were female. Average age was 35.41 years (SD = 9.93),
312
ranging from 18 to 61 years. Tenure within the organization ranged from less than one year to 28
313
years (M = 6.79, SD = 7.34). Participants came from diverse industries, mainly from healthcare (19%),
314
the service sector (16%), education (10%), and commerce (9%). Participants had either full-time or
315
part-time jobs and worked on average 32.18 hours per week (SD = 9.92), 75% had a permanent
316
contract and 29% had a leadership position. In total, we received 849 observations (person-weeks)
317
for Friday from 135 persons (on average 6.3 weeks per person, 42% of the theoretically possible 2025
318
observations) suited for use in our growth curve models. Our analyses of short-term lagged effects
319
from one week to the next week, however, relied on matched observations from two consecutive
320
weeks. Given that participants had missing data for single or several weeks over the course of 15
321
weeks, our analyses of the short-term effects were based on a sample of 490 matched observations
322
from 101 employees. Descriptive information and zero-order correlations for the full sample and the
323
matched sample at the intraindividual level and at the interindividual level are presented in Tables 1
324
and 2, respectively.
325
2.3. Measures
326
We applied short versions of validated scales adapted to the purposes of our study. Participants
327
rated aspects on 5-point Likert scales to indicate the frequency of experiences during the recent
328
workweek. Unless stated otherwise, response options ranged from 1 (“never during this week”) to 5
329
(“several times a day”).
330
We measured work events within the recent workweek on Friday afternoon using eleven items
332
from the work events checklist which covers the work events clusters identified by Ohly and Schmitt
333
[6]. The work event checklist consists of 13 items, two of which refer to events not directly related to
334
the job (negative events: bad news in employees’ private lifes and health problems). Given the focus
335
and theoretical rationale of the present study, we confined analyses a set of eleven items, which were
336
explicitly job-related. However, we included the off-job events in the supplemental analyses. Five
337
items tapped into positive events during the current workweek. Sample items are “Did you get
338
confronted with positive but unexpected news or information (e.g., a promotion or a new work
339
order)?” and “Did you receive a positive feedback or a thank from anyone (e.g., supervisor,
340
colleagues or customers)?”. We applied six items to capture negative events within the recent
341
workweek. Sample items are, “Did you experience any conflicts or communication problems with
342
colleagues?” and “Did you experience a situation that negatively affected the working climate and
343
the cooperation among the employees/colleagues in your department/your company (e.g., dismissal
344
of a colleague, issues dealing with the supervisor, unsuccessful team meetings)?”. Given that work
345
events are formative rather than reflective constructs coefficient alphas are not adequate for judging
346
reliability [51]. For instance, experiencing high levels of conflicts does not necessarily imply high
347
levels of ambiguity or organizational changes at the same time.
348
2.3.2. Work engagement during the workweek.
349
We applied a brief three item measure to capture work engagement based on the UWES-9 items
350
(Utrecht Work Engagement Scale) [52]. Preliminary analyses based on cross-sectional data from the
351
baseline survey of the present study using the UWES-9 items (Utrecht Work Engagement Scale) [52]
352
suggested that all items loaded on one factor [see 53 on the structure of the UWES] and in our study
353
the three highest loading items captured engagement as reliable as the UWES-9 in our baseline
354
survey (r UWES9-UWES3 = .97). We applied the following items: “During this week, I was
355
enthusiastic about my job.”, “During this week, I was immersed in my work.”, and ”During this
356
week, I got carried away when I was working.”. We calculated multilevel alpha for work
357
engagement following procedures introduced by [54] implemented in R by [55]. Alphas for work
358
engagement were .84 at the intraindividual level and .96 at the interindividual level.
359
2.4. Analytic Strategy
360
We applied multilevel modelling [56] to account for dependence of repeated observations. We
361
applied the “nlme”- package for R [57]. As weekly observations were nested within persons, we
362
specified two-level models. Work engagement yielded an intra-class correlation coefficient (ICC(1))
363
of .61. In our focal analyses predictors at the week-level (Level-1) were centered around the
364
person-mean [58]. Given that we expected relationships between predictors and criteria to vary
365
across persons, we specified random effects for all focal predictors. We controlled for the Level
366
2-effects of our focal predictors [59,60] [see also 15] and entered the person-means of positive and
367
negative events for each person to predict the intercept of work engagement. The person-mean of
368
positive or negative events captures the amount of work events experienced over the period of 15
369
weeks. Including the person-mean of positive and negative work events at Level 2 offers the
370
advantage of being able to differentiate between differences at the interindividual level and the focal
371
short-term effects at the intraindividual level [61]. Our model is equivalent to what Kreft et al. call a
372
CWC2 model [62].
373
To analyze mid-term effects of the frequent exposure to work events over time, we specified
374
growth curve models using multilevel modeling. We followed the steps recommended by [63] for
375
growth curve modeling using a multilevel modeling approach in R. We specified linear changes
376
(decrease or increase) in work engagement over time as a random slope of time in weeks predicting
377
these outcomes. Significant random effects indicate that employees differ in the rate of change in the
378
respective outcome variable. We also probed quadratic and cubic trajectories for exploratory
379
moderators, which tests whether differences in the trajectory of work engagement (slope of time) can
381
be explained by the amount of positive and negative events experienced by each person over time.
382
Whereas the person-means as covariates depict differences in characteristic average levels of work
383
engagement due to frequent exposure to work events, the trajectories can be interpreted as increases
384
or decreases in weekly work engagement over time.
385
3. Results
386
In a first step, we examined whether each type of positive and negative work events had
387
occurred or not (once or several times vs. not at all during the workweek) and how frequently these
388
events had occurred over the course of the 15 weeks. With regard to positive events we found that
389
positive events occurred more frequently than negative events. Positive events ranged from more
390
than 335 occurrences (work-related good news) to more than 828 occurrences (goal attainment,
391
problem-solving and task-related success). Negative events ranged from more than 327 occurrences
392
(problems in interactions with clients) to more than 460 occurrences (ambiguity, insecurity, and loss
393
of control). Average frequencies for each type of event are displayed in Table 1 for descriptive
394
purposes. Whereas positive events occurred on average several times a week, negative events
395
occurred on average less than once a week during the period studied.
396
3.1. Short-Term Effects of Work Events
397
Addressing the first set of hypotheses, we specified Model 1, in which work engagement (in
398
week n) was regressed on the main effects of concurrent (week n) and lagged work events
399
(week n-1), the interactions among positive events (satiation or intensification) and among negative
400
events (adaptation or sensitization). We found that models including auto-regressive and
401
heteroscedasticity specification did not improve model fit [63] and did not alter the pattern of
402
results. Therefore, we omitted these specifications from the focal models. Results are depicted in
403
Table 3. We found a positive relationship between positive events during the workweek and work
404
engagement (γ = .74, t = 12.52, p < .001) at the intraindividual level. Concurrent negative events were
405
unrelated to work engagement (γ = .07, t = .86, p > .10). We did not find evidence for lagged main
406
effects of work events from week n-1 to week n. That is, neither positive nor negative events carried
407
over to affect work engagement from one week to the next. Furthermore, concurrent positive events
408
did not interact with lagged positive events (γ = -.07, t = -.61, p > .10). Hence, in contrast to
409
Hypothesis 1 we found neither sensitization nor satiation effects of positive events. In a similar way
410
concurrent negative events did not significantly interact with lagged negative events to predict work
411
engagement (γ = -.07, t = -.07, p > .10). Hence, in contrast to Hypothesis 2 we found neither
412
sensitization nor satiation effects of negative events. Repeated exposure to positive events does not
413
change the way positive events affect work engagement in the next week. The same is true for
414
Table 1. Correlations Among Study Variables at the Intraindividual Level
Variable ICC 1 2 3 4 5 6 7 8 9 10 11 12 13 14
1. Goal attainment, problem-solving, task-related success .40 .60 .28 .39 .45 -.06 .05 .07 -.04 -.06 .01 .74 -.01 .38
2. Perceived competence in or through social interactions .47 .62 .25 .41 .56 -.02 -.07 .03 -.05 -.16 -.12 .77 -.10 .45
3. Work-related good news .30 .28 .23 .27 .36 -.03 .03 .04 .09 -.02 -.02 .56 .03 .23
4. Passively experienced positive events .46 .40 .40 .27 .54 -.02 -.09 -.07 -.15 -.18 -.25 .76 -.20 .45
5. Praise, appreciation, positive feedback .44 .50 .60 .35 .56 -.02 .07 -.02 .04 -.10 -.09 .82 -.02 .43
6. Technical difficulties, problems with work tools and equipment .45 -.07 .00 -.05 .02 .00 .07 .05 .18 .26 .15 -.04 .46 -.13
7. Hindrances in goal attainment, obstacles in completing work tasks,
overload .39 .12 -.02 .03 -.08 .13 .01 .36 .44 .33 .23 .00 .67 -.04
8. Problems in interactions with clients or patients .41 .05 .00 .00 -.06 -.03 .00 .39 .20 .30 .22 .01 .54 .04
9. Ambiguity, insecurity, loss of control .45 -.04 -.03 .10 -.13 .08 .18 .44 .18 .45 .37 -.04 .71 -.15
10. Conflicts and communication problems .43 -.07 -.16 .00 -.16 -.06 .27 .35 .37 .43 .51 -.15 .74 -.13
11. Managerial and internal problems, organizational climate .49 .05 -.10 .03 -.23 -.04 .10 .27 .26 .33 .46 -.14 .64 -.15
12. Positive events .53 .75 .77 .54 .76 .84 -.02 .05 -.02 -.01 -.13 -.10 -.09 .54
13. Negative events .57 .02 -.08 .03 -.17 .03 .43 .69 .55 .70 .74 .63 -.05 -.15
14. Work engagement .61 .31 .42 .18 .37 .36 -.12 -.04 .07 -.17 -.09 -.11 .45 -.13
15. Work engagement (lagged) -- .42 .48 .24 .46 .42 -.13 -.01 .09 -.17 -.08 -.08 .56 -.11 .67
Note. Correlations above the diagonal are week-level correlations in the full sample (k = 849). Correlations below the diagonal are week-level correlations in the matched sample (k = 490). Correlations in bold type are significant at p < .05.
Table 2. Means, Standard Deviations, and Correlations Among Study Variables at the Interindividual Level
Variable M SD 1 2 3 4 5 6 7 8 9 10 11 12 13 14 15 16
1. Genderab .77 .42 -.06 .02 .03 .02 .00 .09 -.07 -.12 -.05 .04 -.01 -.03 .04 -.06 .02
2. Age in yearsb 35.75 10.38 -.01 -.06 .13 .04 .06 -.04 -.01 .00 -.04 -.28 -.15 -.14 .04 -.16 .11
3. Goal attainment, problem-solving, task-related success 3.17 0.87 .15 -.04 .53 .38 .44 .37 -.13 -.19 .07 -.14 -.14 -.10 .69 -.16 .45
4. Perceived competence in or through social interactions 3.37 0.86 .12 .10 .72 .39 .51 .64 -.05 -.22 .09 -.19 -.23 -.22 .82 -.21 .48
5. Work-related good news 1.53 0.75 -.03 .03 .41 .40 .41 .49 -.05 -.17 .07 -.04 -.05 -.11 .67 -.09 .50
6. Passively experienced positive events 2.59 1.11 .05 .07 .49 .59 .36 .61 -.08 -.17 .02 -.29 -.23 -.34 .80 -.27 .67
7. Praise, appreciation, positive feedback 2.47 1.03 .05 .04 .45 .68 .51 .72 -.12 -.22 -.02 -.10 -.26 -.20 .83 -.23 .63
8. Technical difficulties, problems with work tools and
equipment 1.76 0.98 -.02 -.07 -.16 -.32 .01 -.18 -.19 .28 .18 .27 .43 .34 -.11 .61 -.23
9. Hindrances in goal attainment, obstacles in completing
work tasks, overload 1.85 1.1 -.10 -.07 -.21 -.29 -.10 -.24 -.14 .36 .42 .48 .42 .15 -.25 .67 -.13
10. Problems in interactions with clients or patients 1.56 0.82 .00 -.05 -.06 -.14 .04 -.19 -.17 .16 .46 .21 .30 .18 .06 .53 -.06
11. Ambiguity, insecurity, loss of control 1.9 0.98 -.03 -.27 -.15 -.29 .00 -.37 -.19 .45 .56 .30 .58 .52 -.21 .76 -.22
12. Conflicts and communication problems 1.6 0.83 -.07 -.18 -.16 -.40 .01 -.34 -.31 .59 .55 .39 .67 .67 -.25 .83 -.26
13. Managerial and internal problems, organizational
climate 1.63 0.92 -.09 -.15 -.11 -.33 -.06 -.47 -.28 .38 .28 .24 .65 .65 -.26 .71 -.27
14. Positive events 2.63 0.68 .09 .05 .77 .86 .64 .82 .86 -.22 -.25 -.14 -.27 -.32 -.33 -.26 .72
15. Negative events 1.72 0.59 -.08 -.19 -.20 -.40 -.03 -.41 -.29 .68 .72 .55 .83 .88 .74 -.35 -.29
16. Work engagement 2.42 1.05 .01 .09 .50 .61 .45 .70 .66 -.27 -.12 -.10 -.28 -.27 -.33 .75 -.32
Note. Correlations above the diagonal are person-level correlations in the full sample (n = 135). Correlations below the diagonal are person-level correlations in the matched sample (n = 101). Correlations in bold type are significant at p < .05.
a 0 male, 1 female; b for gender and age N = 131 (full sample) and N = 99 (matched sample)
419
Table 3. Results from Multilevel Analysis Predicting Work Engagement
Parameter Model 1 Model 2
γ SE t γ SE t
Level 2 (person-level)
Intercept 2.44 0.07 33.62 2.43 0.07 33.50
Person-mean positive events 1.21 0.13 9.64 *** 1.21 0.12 9.70 ***
Person-mean negative events -0.12 0.13 -0.92 -0.13 0.13 -0.97
Level 1 (week-level)
Time 0.00 0.01 0.33 0.00 0.01 0.43
Positive events (lagged week n-1) 0.03 0.06 0.49 0.03 0.06 0.57
Negative events (lagged week n-1) 0.02 0.08 0.24 -0.02 0.08 -0.20
Positive events (week n) 0.74 0.06 12.52 *** 0.72 0.06 12.12 ***
Negative events (week n) 0.07 0.08 0.86 0.06 0.08 0.77
Interactions
Positive events x lagged positive events -0.07 0.11 -0.61 -0.09 0.12 -0.76
Negative events x lagged negative events -0.02 0.20 -0.07 -0.05 0.20 -0.24
Positive x lagged negative events 0.40 0.15 2.69 **
Negative events x lagged positive 0.10 0.17 0.59
Variance components
Level 2 intercept variance 0.32 0.33
Positive events slope variance 0.01 0.02
Negative events slope variance 0.02 0.01
Lagged negative events slope variance 0.06 0.06
Level 1 intercept variance 0.26 0.25
Deviance (df) 920.43 (21) 913.27 * (23)
AIC 962.43 959.27
BIC 1050.51 1055.74
Note. SE = standard error. df = degrees of freedom. * p < .05. ** p < .01. *** p < .001. Deviance = (-2 Residual Log Likelihood). AIC = Akaike information criterion. BIC = Bayesian information criterion
420
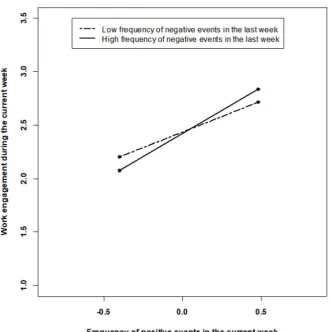
Addressing Hypothesis 3 (contrast after negative events) and 4 (buffering effect) we examined
421
the interactions of lagged negative events x current positive events and of lagged positive events x
422
current negative events. In line with Hypothesis 3, we found that lagged negative events and
423
concurrent positive events interact to predict work engagement (γ = -39, t = 2.36, p = .008). The
424
pattern of the interaction is depicted in Figure 2 and suggests that frequent negative events in the
425
last week amplify the positive association between positive events and work engagement in the
426
current week (Simple slopes: γ low negative events = .60, t = 7.70, p < .001, γ high negative events =
427
.86, t = 11.41, p < .001). Gains in work engagement at the week-level due to positive events are
428
greatest in weeks when many negative events have preceded in the week before. In contrast to
429
Hypothesis 4, lagged positive events did not change the effects of concurrent negative events (γ =
430
.11, t = .67, p > .10). In sum, our results are compatible with the basic idea of a contrast effect after
431
negative events. However, we did not find evidence for sensitization or satiation effects across
432
434
Figure 2. Interaction of current positive and lagged negative events at the week-level
435
3.2. Mid-Term Changes in Work Engagement Due to Work Events
436
Results from linear growth curve models predicting changes in work engagement over time are
437
shown in Table 4 (Growth Model 1). In a first step, we found a significant negative effect of time
438
(γ = -.01, t = -2.05, p = .04), indicating that on average work engagement slightly decreases over the
439
period of four months. Given that we found significant slope variance, we considered the frequency
440
of positive and negative events over time as cross-level moderators in Growth Model 2. In line with
441
Hypothesis 5, positive events were predictive of the slope of time (γ = .03, t = 1.97, p = .04). In
442
contrast, negative events did not contribute to explain slopes in work engagement over time (γ =
443
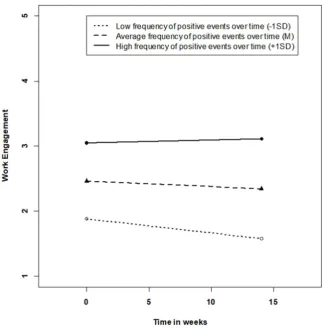
-.02, t = -1.13, p > .10). The trajectories of work engagement over the course of time dependent upon
444
accumulation of positive events are depicted in Figure 3. Inspection of the slopes reveals that lower
445
frequencies of positive events over time are related to steeper decreases in work engagement over
446
time, whereas work engagement remains constant when high frequencies of positive events occur.
447
Further inspection of simple slopes using tools developed by [64] suggests that work engagement
448
decreases when the frequency of positive events over time is close to the grand-mean or below and
449
that work engagement might even increase when very high frequencies of positive events are
450
present (region of significance -.01 > w > 1.57) (Simple slopes: γ low positive events = -.03, t = 2.97, p <
451
.01, γ high positive events = -.00, t = .04, p > .10). Besides the trajectories over time, the
452
person-mean of positive events was also predictive of the intercept (γ = .98, t = 8.36, p < .001). That is,
453
differences in individual “characteristic average levels” [20] of work engagement were attributable
454
to the frequency of positive events over time. Work engagement was higher for individuals who
455
457
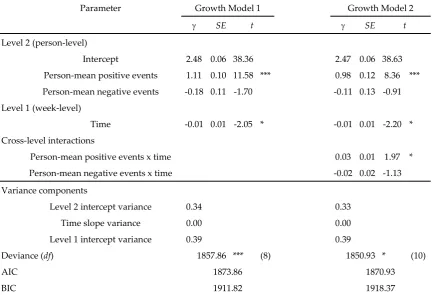
Table 4. Growth Curve Modeling Analysis Predicting Trajectories of Work Engagement Over Time
Parameter Growth Model 1 Growth Model 2
SE t SE t
Level 2 (person-level)
Intercept 2.48 0.06 38.36 2.47 0.06 38.63
Person-mean positive events 1.11 0.10 11.58 *** 0.98 0.12 8.36 ***
Person-mean negative events -0.18 0.11 -1.70 -0.11 0.13 -0.91
Level 1 (week-level)
Time -0.01 0.01 -2.05 * -0.01 0.01 -2.20 *
Cross-level interactions
Person-mean positive events x time 0.03 0.01 1.97 *
Person-mean negative events x time -0.02 0.02 -1.13
Variance components
Level 2 intercept variance 0.34 0.33
Time slope variance 0.00 0.00
Level 1 intercept variance 0.39 0.39
Deviance (df) 1857.86 *** (8) 1850.93 * (10)
AIC 1873.86 1870.93
BIC 1911.82 1918.37
Note. SE = standard error. df = degrees of freedom. * p < .05. ** p < .01. *** p < .001. Deviance = (-2 Residual Log Likelihood). AIC = Akaike information criterion. BIC = Bayesian information criterion
3.3. Additional Analyses
458
We ran a couple of additional analyses to scrutinize the robustness of our results, to address
459
potential alternative explanations, and to explore additional issues related to the link between work
460
events and work engagement. First, to rule out systematic bias due to missing data, we reran Models
461
1 through 4 using sub-samples of participants, who had provided either at least 8 (n = 51) or 10 (n =
462
39) out of 15 weekly reports. The pattern of results did not differ from our focal analyses. That is, all
463
main effects and interactions remained significant. These findings suggest that the number of
464
missing observations did not systematically affect the focal results and implies that the focal effects
465
are robust. Models using a sub-sample of participants who provided at least 12 reports per person
466
yielded convergence problems in Model 2 due to the low number of participants (n = 20) and fall
467
below the threshold for minimum sample sizes at Level 2. Detailed results of the supplemental
468
analyses will be provided upon request to the first author.
469
Second, in our focal analyses, we have combined different types of positive events to a global
470
measure of positive events and we applied the same strategy to negative events. This approach helps
471
draw comparisons to prior research that has distinguished between positive vs. negative events in
472
general terms. However, in our study we applied an 11-item work-events checklist and also
473
included two items referring to off-job events, namely health-related problems and negative news in
474
employees` private lifes. Hence, our study allows for a more fine-grained analysis of the relative
475
strength of association between work events and work engagement. Whereas prior research
476
basically tells us that positive events tend to be beneficial for work engagement, it would be
477
interesting to know, which types of events may be most relevant for work engagement at the
478
week-level and hence, which classes of events are actual drivers of work engagement. Following a
479
ran multilevel models and regressed work engagement at the week-level on all types of work events.
481
We applied the full sample for these analyses and specified random intercepts and fixed slopes for
482
each type of work event, because the sample sizes at both levels of analysis do not permit specifying
483
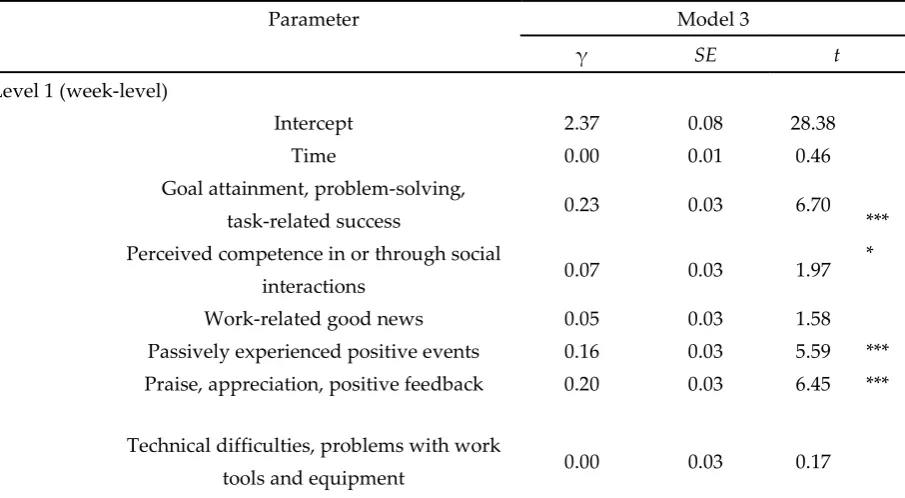
eleven random slopes within the same model. The results are displayed in Table 5. In essence, we
484
found almost all types of positive work events uniquely contribute to explain variance in week-level
485
work engagement. More specifically, goal attainment events (γ = .23, t = 6.69, p < .001), passively
486
experienced positive events (γ = .16, t = 5.59, p < .001), and episodes of praise, appreciation, and
487
positive feedback (γ = .20, t = 6.45, p < .001) were positively related to levels of work engagement.
488
Furthermore, perceived competence through social interactions was significantly related to higher
489
levels of work engagement at the week-level, too (γ = .07, t = 1.97, p = .049), albeit the coefficient was
490
a bit lower than for the other work events. By contrast, negative events were unrelated to week-level
491
work engagement, except for episodes of ambiguity, insecurity and loss of control. Interestingly, the
492
coefficient for this type of negative work event was positive rather than negative (γ = .07, t = 2.11, p =
493
.034. Hence, this type of negative event contributes to enhance rather than diminish work
494
engagement, when considered in concert with all other types of work events. As the other negative
495
work events, negative off-job events did not yield significant associations with work engagement.
496
497
Figure 3. Trajectories of work engagement over 15 weeks dependent upon accumulation of positive
498
events over time.
499
Third, our study provides the opportunity to assess whether associations between positive
500
work events and work engagement within the same week are due to common method bias only.
501
More specifically, we leveraged the matched sample and ran an alternative version of Model 2
502
regressing work engagement in week n on positive and negative work events in week n, lagged
503
other words, we controlled for prior levels of the outcome variable when predicting week-level work
505
engagement. Finding significant associations between our focal predictors and work engagement
506
under these circumstances would facilitate interpretation of results as work events predicting
507
changes in work engagement rather than both phenomena co-occurring at the same time. The results
508
are presented in Table 6. In essence, we found the same pattern of results as in our focal analyses.
509
That is, the main effect of positive work events at Level 1 (γ = .72, t = 12.19, p < .001) and the
510
interaction at Level 1 remained significant (γ = .37, t = 2.43, p = .015). Not surprisingly, previous
511
week’s work engagement was positively linked to current week’s work engagement (γ = .27, t = 6.29,
512
p < .001). Of note however, the inclusion of work engagement from the previous week resulted in a
513
significant lagged effect of positive events in week n-1 on work engagement in week n (γ = -.19, t =
514
-2.85, p = .005).
515
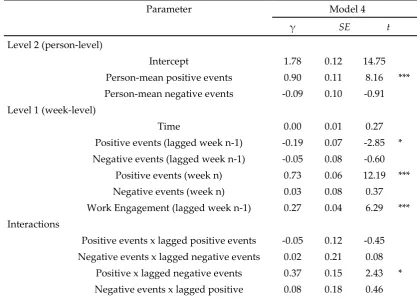
Finally, we probed whether positive and negative events interact within the same week to predict
516
work engagement. This perspective would be in line with the perspective of prior research on work
517
events, that has not accounted for the order of events (e.g., [19]). Moreover, this kind of concurrent
518
work events interaction corresponds to the perspective taken in experience-sampling research on job
519
demands and resources. We specified an alternative version of Model 2 including the interaction of
520
positive x negative events within the same week. In essence, when analyzing the full sample we
521
found evidence for the positive link between positive events and work engagement at the week-level
522
(γ = .69, t = 13.35, p < .001) and that positive and negative events interact to predict work engagement
523
(γ = -.31, t = -2.76, p = .006). Inspection of the simple slopes confirms that within the same week
524
negative events alleviate the link of positive events and work engagement. However, when
525
analyzing concurrent interactions across two consecutive weeks in the matched sample including all
526
combinations of positive events, negative events, and lagged positive events and lagged negative
527
events, we found no interactions of concurrent positive and negative events within the same week (γ
528
= -.13, t = -0.83, p = .41). These supplemental analyses suggest that the pattern of interaction of
529
concurrent positive and negative events is opposite to the pattern of interaction when taking into
530
account the order of events. Negative events alleviate the link between positive events, when
531
measured concurrently with positive events. However, negative events amplify the link between
532
positive events and work engagement, when measured prior to positive events.
533
534
Table 5. Results from Multilevel Analysis Predicting Work Engagement by Specific Positive and Negative Events Within the Same Week
Parameter Model 3
γ SE t
Level 1 (week-level)
Intercept 2.37 0.08 28.38
Time 0.00 0.01 0.46
Goal attainment, problem-solving,
task-related success 0.23 0.03 6.70 ***
Perceived competence in or through social
interactions 0.07 0.03 1.97
*
Work-related good news 0.05 0.03 1.58
Passively experienced positive events 0.16 0.03 5.59 *** Praise, appreciation, positive feedback 0.20 0.03 6.45 ***
Technical difficulties, problems with work
Health Complaints -0.01 0.02 -0.30
Private issues -0.02 0.03 -0.51
Hindrances in goal attainment, obstacles in
completing work tasks, overload -0.04 0.03 -1.52 Problems in interactions with clients or
patients 0.03 0.04 0.80
Ambiguity, insecurity, loss of control 0.07 0.03 2.12 *
Conflicts and communication problems -0.01 0.04 -0.25 Managerial and internal problems,
organizational climate 0.03 0.03 0.10
Variance components
Level 2 intercept variance 0.77
Time slope variance 0.00
Level 1 intercept variance 0.27
Deviance (df) 1693.77 (19)
AIC 1731.77
BIC 1821.91
Note. SE = standard error. df = degrees of freedom. * p < .05. ** p < .01. *** p < .001. Deviance = (-2 Residual Log Likelihood). AIC = Akaike information criterion. BIC = Bayesian
information criterion
535
Table 6. Results from Multilevel Analysis Predicting Work Engagement in Week n Controlling for Work Engagement in Week n-1
Parameter Model 4
γ SE t
Level 2 (person-level)
Intercept 1.78 0.12 14.75
Person-mean positive events 0.90 0.11 8.16 *** Person-mean negative events -0.09 0.10 -0.91 Level 1 (week-level)
Time 0.00 0.01 0.27
Positive events (lagged week n-1) -0.19 0.07 -2.85 * Negative events (lagged week n-1) -0.05 0.08 -0.60
Positive events (week n) 0.73 0.06 12.19 *** Negative events (week n) 0.03 0.08 0.37 Work Engagement (lagged week n-1) 0.27 0.04 6.29 *** Interactions
Positive events x lagged positive events -0.05 0.12 -0.45 Negative events x lagged negative events 0.02 0.21 0.08
Variance components
Level 2 intercept variance 0.17 Positive events slope variance 0.01 Negative events slope variance 0.04 Lagged negative events slope variance 0.07 Level 1 intercept variance 0.27
Deviance (df) 889.48 (24)
AIC 937.48
BIC 1038.14
Note. SE = standard error. df = degrees of freedom. * p < .05. ** p < .01. *** p < .001. Deviance = (-2 Residual Log Likelihood). AIC = Akaike information criterion. BIC = Bayesian
information criterion
4. Discussion
536
In this study, we have examined how positive and negative events dynamically interact to
537
predict fluctuations in work engagement from week to week. Notably, we have added a temporal
538
component [18], which might resolve inconsistent findings in prior research. Furthermore, our study
539
is among the first to explicitly consider whether the accumulation of work events is predictive of
540
mid-term trajectories of work engagement over a period of four months. Our approach complements
541
prior research on job demands and resources as more distal feature-oriented antecedents of work
542
engagement [11,65] and provides a more nuanced picture of the interplay of positive and negative
543
events over time.
544
First, our results extend prior research, which has reported that negative events may, under
545
certain circumstances, be beneficial for work engagement, dependent upon what happens
546
afterwards [18]. The present study contributes to clarify the dynamics underlying these seemingly
547
paradoxical effects [16]. Specifically, our results suggest that the occurrence of positive events is
548
tightly related to high levels of work engagement and that current positive events affect work
549
engagement particularly in the light of recent negative events. High levels of work engagement
550
result from a contrast that evolves when experiencing positive events in the aftermath of negative
551
events. The amplifying effect of recent negative events on the association between current positive
552
events and work engagement is consistent with research on the affective-shift model of work
553
engagement [18] and is also in line with the interplay of job demands and job resources as postulated
554
in job demands-resources theory [5]. However, taking into account the order of positive and
555
negative events provides a more differentiated picture. Whereas recent negative events interacted
556
with current positive events, recent positive events did not interact with current negative events to
557
predict work engagement. So, timing of positive and negative events may play a crucial role. In this
558
sense, our results illustrate the value of studying the experience of work through the lens of work
559
events and taking the order of events into account. Our results suggest that, for instance,
560
experiencing support after struggling with overload results in different levels of work engagement
561
than facing overload in the aftermath of support. In feature-oriented research on job demands and
562
resources researchers usually do not account for this distinction. Our results suggest that we need to
563
consider these temporal aspects to avoid inconsistent results in the future. Our supplemental
564
analyses show that while negative events alleviate the link between positive events and week-level
565
work engagement, negative events amplify the link between positive events and work engagement,
566
when negative events precede positive events. In this sense, our study may help explain why
567
interactions of demands and resources have emerged in some studies, but have not been found in
568
other studies applying feature oriented approaches to the interplay of job characteristics measured