Dissertation
zur Erlangung des Doktorgrades der Fakultät für Chemie und
Pharmazie der Ludwig-Maximilian-Universität München
Improved nonviral gene vectors: Efficient and non-toxic
polyplexes with enhanced endosomolytic activity
vorgelegt von
Sabine Boeckle
aus Nürnberg
Erklärung
Diese Dissertation wurde im Sinne von § 13 Abs. 3 bzw. 4 der Promotionsordnung vom 29. Januar 1998 von Prof. Dr. Ernst Wagner betreut.
Ehrenwörtliche Versicherung
Diese Dissertation wurde selbständig, ohne unerlaubte Hilfe erarbeitet.
München, 28.02.2005, Sabine Boeckle
Dissertation eingereicht am 21.01.2005
1. Gutacher: Prof. Dr. Ernst Wagner
2. Gutacher: Prof. Dr. Wolfgang Frieß
Table of Contents
1 INTRODUCTION...6
1.1 Gene therapy ...6
1.2 Viral and nonviral vectors...6
1.2.1 Viral vectors ...6
1.2.2 Nonviral vectors ...8
1.2.3 Gene delivery with PEI polyplexes ...9
1.2.4 Barriers to gene transfer with PEI polyplexes ...10
1.2.5 Key issues for improved PEI polyplexes ...14
2 MATERIALS AND METHODS ...19
2.1 Chemicals and reagents ...19
2.2 Quantitative analysis of B-PEI and L-PEI...20
2.2.1 TNBS assay ...20
2.2.2 Copper complex assay...21
2.3 Covalent labeling of DNA and PEI ...21
2.4 Conjugate synthesis...22
2.4.1 Synthesis of 3-(2-pyridyldithio)-propionate-modified B-PEI...22
2.4.2 Synthesis of C-mel-PEI and N-mel-PEI conjugates ...22
2.4.3 Synthesis of CMA-PEI conjugates ...23
2.5 Polyplex formation...24
2.6 Measurement of particle size and zeta potential ...25
2.7 Purification of polyplexes by size exclusion chromatography...25
2.8 Cell culture ...26
2.9 Luciferase reporter gene expression...26
2.10 EGFP reporter gene expression...27
2.11 Metabolic activity of transfected cells ...28
2.12 Flow cytometric analysis of cellular polyplex association ...28
2.13 Laser scanning microscopy...28
2.14 Transmission light and epifluorescence microscopy ...29
2.15 Video fluorescence microscopy...30
2.17 Liposome leakage assay...31
2.18 Cell lysis assay...32
3 RESULTS...33
3.1 Purification of PEI polyplexes...33
3.1.1 Purification of PEI polyplexes by size exclusion chromatography ...33
3.1.2 Reporter gene expression and toxicity of purified polyplexes ...34
3.1.3 Enhanced cellular association of purified PEI polyplexes ...39
3.1.4 Delayed administration of free PEI enhances gene expression ...40
3.1.5 Intracellular co-localization of free PEI and purified polyplexes ...41
3.2 Comparison of C-versus N-terminally linked melittin-PEI conjugates...43
3.2.1 Synthesis and purification of C-mel-PEI and N-mel-PEI conjugates ...43
3.2.2 Reporter gene expression of N-mel-PEI polyplexes with melittin in all-(D) versus all-(L)-configuration...44
3.2.3 Reporter gene expression of C-mel-PEI and N-mel-PEI polyplexes ...45
3.2.4 Toxicity of C-mel-PEI and N-mel-PEI polyplexes ...48
3.2.5 Cell lysis induced by C-mel-PEI polyplexes ...50
3.2.6 Lytic activities of C-mel-PEI and N-mel-PEI at neutral pH...51
3.2.7 Endosomolytic activity of C-mel-PEI and N-mel-PEI ...53
3.3 Improved endosomolytic melittin-PEI conjugates...55
3.3.1 Synthesis and purification of PEI conjugates with melittin analogs ...55
3.3.2 Endosomolytic activities of CMA-PEI conjugates ...56
3.3.3 Lytic activities of CMA-PEI conjugates at neutral pH ...58
3.3.4 Improved endosomolytic melittin-PEI conjugates enhance reporter gene expression...59
3.3.5 Toxicity of CMA-PEI polyplexes ...60
3.4 Towards artificial viruses...61
3.4.1 Shielding and targeting of melittin-PEI polyplexes ...61
3.4.2 Reporter gene expression of shielded and EGFR-targeted melittin-PEI polyplexes ...63
4 DISCUSSION...68
4.1 Purification of PEI polyplexes highlights the role of free PEI...68
4.2 C- versus N-mel-PEI: the site of linkage strongly influences the biological activity ...71
4.3 Improved melittin-PEI conjugates enhance gene transfer...78
4.4 Towards artificial viruses...81
5 SUMMARY...85
6 APPENDIX ...87
6.1 Abbreviations ...87
6.2 Publications...89
6.2.1 Original Papers ...89
6.2.2 Reviews and Book chapters...89
6.2.3 Oral presentations...90
6.2.4 Poster presentations ...90
7 REFERENCES...91
8 ACKNOWLEDGMENTS...100
1 Introduction
1.1 Gene
therapy
Gene therapy, as first proposed 1972 by Friedman and Roblin (1), aims at the delivery of nucleic acids (DNA or RNA) into target cells in order to cure patients suffering from different diseases. The transferred nucleic acids are mostly used to turn on or restore a gene function (‘gain of function’). A relatively new field in gene therapy applies nucleic acids to suppress specific gene functions (‘loss of function’) by turning off genes with antisense oligonucleotides or double-stranded small interfering RNA (siRNA).
Although gene therapy has not yet been established as standard treatment, it was already applied in various clinical studies, e.g. in the field of cancer therapy (most clinical trials), monogenic diseases (Hemophilia A and B, cystic fibrosis, severe combined immunodeficiency syndrome (SCID)), infectious diseases, vascular diseases, or DNA vaccination (2). Gene therapy may hold the potential to revolutionize modern molecular medicine, provided that appropriate nucleic acid delivery systems (‘vector systems’) are available.
1.2 Viral and nonviral vectors
Current vectors can be divided into two major groups, namely viral vectors derived from natural viruses and nonviral, synthetically manufactured vectors.
1.2.1 Viral vectors
Retroviral vectors and adenoviral vectors have been most commonly used in clinical trials (2). Other viruses that were used to develop viral vectors include adeno-associated virus (AAV), herpes virus, pox virus, and more recently lentivirus. Viruses in general are highly efficient regarding cellular uptake and intracellular delivery of therapeutic genes to the nucleus. Therefore, few viral particles are sufficient for the transduction of cells.
Gene transfer activity of viral vectors also strongly depends on the type of virus used for transduction. Murine retroviral vectors, for example, are very useful for ex vivo
gene transfer because of their high efficiency to integrate into the host cell genome. In particular, they have been optimized for gene transfer into hematopoietic stem cells. The gene therapy of human SCID-X1 can be regarded as the first success story in gene therapy (3). All ten children treated in this trial were cured of the immunodeficiency symptoms. The therapy, however, was associated with the incidence of leukemia in two of the treated children, and subsequent chemotherapy was required. Insertional oncogenesis by the retroviral vector was identified as the reason for this severe side effect, highlighting a serious risk of such stably but randomly integrating viral vector systems that may cause fatal long term changes in gene expression in addition to the desired therapeutic effect.
Such host responses are obviously independent of the type of virus and of viral gene expression but they are rather attributed to the viral infection process and to viral proteins in the vector particle. Inflammatory and immune host responses to viruses therefore exclude repeated in vivo administration of viral vectors in general.
1.2.2 Nonviral vectors
Nonviral vectors are more flexible in terms of type and size of the delivered nucleic acids (8). A broad range of nucleic acids from small double-stranded RNA for interfering with gene expression up to large artificial chromosomes can be used for transfection. Both the nucleic acids and the carrier molecules can be produced at large scale with rather low cost. Their synthetic design allows high flexibility of the formulation that can be easily modified by diverse chemical reactions and physical interactions. The great advantage of nonviral vectors is their low immunogenicity, since synthetic vectors present far less or no immunogenic proteins or peptides in comparison to viral vectors. Nonviral vectors are usually based on chemically defined lipids or polycations and can be generated protein-free or using non-immunogenic human or humanized proteins and peptides only.
An obvious weakness of nonviral vectors is their low efficiency in intracellular nucleic acid delivery which currently is partly compensated by administration of large amounts of the vectors. Direct injection of mg quantities of ‘naked’ DNA is usually well tolerated but still only yields very low levels of transfection. Nevertheless, application of naked DNA led to protein expression that was sufficient for triggering immune responses and was used for human DNA vaccination trials (9). To enhance the delivery of naked DNA, a series of strategies have been applied that used physical forces, such as electric pulses, mechanical forces, or hydrodynamic pressure. Electroporation, for example, enhanced transgene expression by two or three orders of magnitude and was sufficient to stimulate strong immune responses in DNA vaccine applications (10).
‘lipoplexes’ or ‘polyplexes’, respectively. The cationic agents bind to DNA or RNA due to electrostatic interactions and form particles of nanometer range. Such compaction protects the nucleic acids from enzymatic degradation. Cationic lipids usually consist of a cationic headgroup for electrostatic binding to the nucleic acid and a lipophilic tail, which enables the generation of a nucleic acid/lipid complex (for review see (11)). Polycationic carriers are naturally occurring proteins like histones or protamines, chemically synthesized polyaminoacids, e.g. polylysine and polyarginine, or other polycationic polymers (for review see (12) and (13)). More recently, polyethylenimine (PEI) has been described as an useful carrier for the condensation of DNA, and it has become one of the most efficient reagents for gene delivery into cells (for review see (14)).
1.2.3 Gene delivery with PEI polyplexes
Jean-Paul Behr and colleagues were the first to report the successful use of PEI for the delivery of DNA and oligonucleotides (15). PEI polymers can be synthesized with a linear or a branched topology (Fig. 1) and are available in a wide range of molecular weights (16).
Fig. 1 Structure of linear and branched PEI
PEI is the organic macromolecule with the highest density of protonable amine functions and is therefore ideal to condense nucleic acids into particles of nanometer range (17). The amino groups allow easy chemical modification, and different biologically active moieties such as cell targeting ligands or compounds promoting intracellular delivery have been coupled to PEI (18). Since these compounds mimic
H3C-CH2-NH-[CH2-CH2-NH]n-CH2-CH2-NH3
Linear PEI
Branched PEI
N N NH NH2N
NH2
H
N N
N H
NH
N H
N N N
H
NH2
N
NH2
H
N N
N H
NH
viral delivery functions, such complex vector systems carrying multiple functional domains have been termed ‘artificial viruses’ (18).
The condensation process of DNA with the polycation PEI has been studied extensively. The particle size of DNA/PEI complexes depends on the molar ratio of PEI nitrogen to DNA phosphate (N/P ratio) and on the present salt concentration. Small individual particles are formed at low salt concentration (< 50 mM NaCl) and/or N/P ratios above 5, whereas formation of large aggregated particles is observed in the presence of salt (> 50 mM NaCl) at lower N/P ratios (19;20). The net positive surface charge and an excess of free PEI during complex formation can prevent aggregation by repulsion of positive charges, whereas an increase in salt concentration reduces the hydration layer around the particles and promotes particle aggregation.
1.2.4 Barriers to gene transfer with PEI polyplexes
For successful gene delivery, gene vectors have to overcome a number of extracellular and intracellular barriers until the carried nucleic acids reach their final destination, the nucleus. The in vivo delivery of viral vectors is strongly hampered by extracellular barriers. For example, systemic targeting of viral vectors towards the desired tissue is difficult to realize due to host immune responses that trigger viral clearance. Viral vectors, however, are very efficient in overcoming intracellular barriers such as internalization into the host cell and delivery of the therapeutic gene towards the nucleus. In contrast, poor intracellular delivery of the carried nucleic acid remains the major barrier to effective gene transfer with nonviral vectors. The following section gives an overview of barriers to nonviral vectors in general and gives examples of how these barriers can be overcome using PEI polyplexes.
1.2.4.1 Extracellular barriers
As explained above, many nonviral vectors are generated using positively charged lipids or polycations resulting in particles with a net positive surface charge. Although positively charged vectors like PEI polyplexes expose high gene transfer activity in
into mice, complexes were rapidly cleared from the circulation and mainly accumulated in the lung. Gene expression levels found in the lung were several log units higher than in any other organ (for example see (21)). In addition, gene transfer at effective DNA doses was associated with acute toxicity. Ex vivo experiments revealed that positively charged polyplexes induced aggregation of erythrocytes. It was proposed that both unspecific lung expression and toxicity were attributed to the aggregation of initially small polyplexes with blood components and their subsequent entrapment in the lung capillary bed (22). Obviously, the positive surface charge of complexes mediates unspecific interactions with non-target cells and blood-components resulting in the observed systemic side effects. These adverse effects can be overcome by ‘shielding’ of the positive surface charge of the vectors with hydrophilic polymers like polyethylene glycol (PEG). PEGylation of PEI polyplexes prevented erythrocyte aggregation, enhanced systemic circulation time and reduced toxicity of polyplexes (21;23). Shielding with PEG, however, also reduces the overall transfection efficiency because of reduced interaction with cell membranes of all cells including the target cells.
1.2.4.2 Intracellular barriers
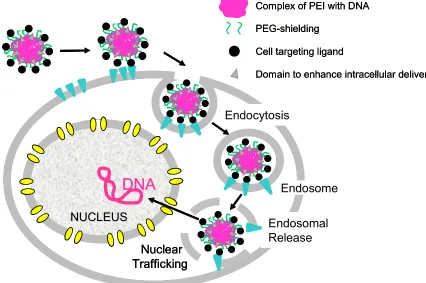
After cellular association of nonviral vectors to the target cells, particles are internalized by receptor-mediated endocytosis, macropinocytosis, phagocytosis or related processes (35-37). For successful transgene expression, several intracellular barriers then have to be overcome. Fig. 2 illustrates cellular uptake of artificial virus-like PEI polyplexes carrying multiple functional domains to overcome these barriers.
Fig. 2 Cellular uptake of artificial virus-like PEI polyplexes. PEG-shielded and receptor-targeted PEI polyplexes are mainly internalized into cells by receptor-mediated endocytosis after association of polyplex-ligands to receptors present on the plasma membrane. Internalized particles are captured in intracellular vesicles such as endosomes. For effective gene delivery, polyplexes need to escape from endosomes by endosomal release, and the released particles and/or the carried nucleic acid need to traffic towards the nucleus, enter the nucleus and expose the DNA to the cell’s transcription machinery. Different functional domains incorporated into the polyplexes may help to overcome these intracellular barriers.
Internalized gene transfer complexes are mostly found in intracellular vesicles such as endosomes. Entrapment in endosomes is thought to be associated with degradation of the complexes upon endosomal acidification. Therefore, subsequent release of particles into the cytoplasm represents a major bottleneck to gene delivery (38;39). PEI polyplexes can promote endosomal escape to some degree because of the ‘proton sponge’ effect (16). PEI polyplexes and free PEI have considerable
NUCLEUS NUCLEUS Endosomal Release Endocytosis Endosome Nuclear Trafficking
DNA
* * * * * * *** * * * * * * ** * * * * * * * * * *** * * * * * * * * * * * * *** * * * * * * ** * * * * * * * * * *** * * * * * * * * * * * * *** * * * * * * *** ***** * * * *** * * * * * * * * * * * * *** * * * * * * ** ** * * * * * * * *** * * * * * * * * * * * * *** * * * * * * ** ** * * * * * * * *** * * * * * *Complex of PEI with DNA
Cell targeting ligand
Domain to enhance intracellular delivery PEG-shielding NUCLEUS NUCLEUS Endosomal Release Endocytosis Endosome Nuclear Trafficking
DNA
* * * * * * *** * * * * * * ** * * * * * * * * * *** * * * * * * * * * * * * *** * * * * * * ** * * * * * * * * * *** * * * * * * * * * * * * *** * * * * * * *** ***** * * * *** * * * * * * * * * * * * *** * * * * * * ** ** * * * * * * * *** * * * * * * * * * * * * *** * * * * * * ** ** * * * * * * * *** * * * * * * NUCLEUS NUCLEUSNUCLEUS NUCLEUSNUCLEUS NUCLEUSNUCLEUS NUCLEUSNUCLEUS NUCLEUSNUCLEUS NUCLEUS Endosomal Release Endocytosis Endosome Nuclear TraffickingDNA
Nuclear Trafficking Nuclear TraffickingDNA
* * * * * * *** * * * * * * ** * * * * * * * * * *** * * * * * * * * * * * * *** * * * * * * ** * * * * * * * * * *** * * * * * * * * * * * * *** * * * * * * ** * * * * * * * * * *** * * * * * * * * * * * * *** * * * * * * ** * * * * * * * * * *** * * * * * * * * * * * * *** * * * * * * *** ***** * * * *** * * * * * * * * * * * * *** * * * * * * *** ***** * * * *** * * * * * * * * * * * * *** * * * * * * ** ** * * * * * * * *** * * * * * * * * * * * * *** * * * * * * ** ** * * * * * * * *** * * * * * * * * * * * * *** * * * * * * ** ** * * * * * * * *** * * * * * * * * * * * * *** * * * * * * ** ** * * * * * * * *** * * * * * *Complex of PEI with DNA
Cell targeting ligand
Domain to enhance intracellular delivery PEG-shielding
Complex of PEI with DNA
Cell targeting ligand
buffering capacity, because PEI is only partially protonated at physiological pH (40). Upon intracellular delivery of the DNA particle, the natural acidification within the endosome triggers protonation of complex-bound and free PEI, inducing chloride ion influx, osmotic swelling and destabilization of the vesicle which finally leads to release of the polyplexes into the cytoplasm (41). However, this proton sponge effect is apparently not sufficient to release the majority of PEI particles from the vesicles. In particular, endosomal escape represents a major hurdle to efficient gene transfer with small PEI polyplexes at low concentrations (19).
Since viruses have developed mechanisms to induce efficient endosomal escape, inactivated viruses, for example adenovirus, have been combined with PEI polyplexes to promote better endosomal release (42). A major drawback in using viruses, however, is their immunogenicity as well as their capacity to trigger inflammatory responses. To overcome these obstacles, a novel strategy to improve intracellular delivery of nonviral vectors was to incorporate membrane active peptides into the vector system. Such peptides were derived from viral proteins (25), toxins (43;44) or were synthetically designed (43;45); for review see (46). Among these membrane active peptides, the bee venom peptide melittin displayed particular strong membrane destabilizing activity, and this peptide successfully enhanced gene transfer with lipoplexes (47) and PEI polyplexes (48;49).
interaction with an excess of anionic macromolecules such as RNA (53) and/or exchange reactions with positively charged histone proteins.
Despite these barriers, some nonviral vectors such as PEI polyplexes have reached high transfection efficiencies in vitro and also in vivo. For example, PEI polyplexes carrying a DNA vector for TNF-α expression demonstrated encouraging therapeutic effects in various tumor models (54). Notably, tail vein administration of such TNF-α
polyplexes into tumor bearing mice led to tumor-specific TNF-α expression, tumor necrosis and remarkable tumor regression. Therefore, PEI polyplexes are promising candidates for the development of improved vector systems.
1.2.5 Key issues for improved PEI polyplexes
For improved gene delivery with PEI polyplexes two major issues are i) to improve the toxicity profile of the applied vectors and ii) to enhance endosomal escape, one of the major barriers limiting gene transfer efficiency.
1.2.5.1 Improving the toxicity profile of PEI polyplexes
Therefore, the first aim of this thesis was to develop an easy and effective method which allows complete removal of free PEI from polyplexes. Based on this method, a further aim was to study transfection properties of such purified polyplexes in vitro
and to evaluate their toxicity profiles in comparison to non-purified polyplexes. Moreover, the aim was to clarify the role of free PEI in gene delivery with PEI polyplexes at the cellular level.
1.2.5.2 Enhancing endosomal escape of PEI polyplexes
As mentioned above, one major barrier limiting the transfection efficiencies of current polyplexes is poor endosomal release. The membrane active peptide melittin is one example of a pore-forming peptide that has been used to enhance the delivery of lipoplexes (47) and polyplexes (48). Melittin is the major toxic component of the honey bee venom and consists of 26 amino acids. Its structure can be divided into three domains (Fig. 3): an α-helical, hydrophobic domain (residue 1 to 13), an α -helical amphipathic region (residue 14 to 20) and a non--helical positively charged C-terminal region (residue 21 to 26).
Fig. 3 Structure of melittin. Melittin contains a hydrophobic (residue 1 to 13) and an amphipathic (residue 14 to 20) α-helical region, which are connected by the helix breaker proline at position 14. The cationic C-terminal region (residue 21 to 26) is non-helical.
transfected cells. To achieve efficient and stable gene transfer formulations endosomal release agents like melittin have to be stably incorporated into the complexes. Therefore, melittin was covalently bound to the lipophilic residue dioleoyl-phosphatidylethanolamine. The hybrid molecule dioleoyl-melittin enabled efficient binding to DNA and high levels of reporter gene expression in different mammalian cells (47). Melittin was also used in PEI polyplexes. Melittin covalently attached to PEI significantly increased reporter gene expression in a broad range of cell lines, and even slowly dividing primary cells were susceptible to transfection (48). Another melittin-PEI conjugate with low molecular weight PEI was used to successfully enhance the delivery of RNA polyplexes (49). In these melittin-PEI conjugates, the polycation was covalently bound to the N-terminus of melittin.
These results indicate that melittin has the capacity to improve endosomal escape of nonviral vectors such as PEI polyplexes. The cationic character of melittin is of advantage for the use in polycation-based gene delivery systems, since covalent attachment of a positive peptide to a polycation will not lead to aggregation effects due to charge interactions between the peptide and the polycation. Incorporation of melittin into DNA polyplexes can even further stabilize the complex with DNA. In addition, synthetic all-(D)-melittin has hemolytic and antibacterial activities comparable to the L-enantiomer (61;62) which offers the opportunity to use non-immunogenic all-(D)-melittin for the generation of non-immunogenic polyplexes. Therefore, melittin was of special interest in the current thesis for the development of optimized PEI polyplexes with improved endosomal release capacity.
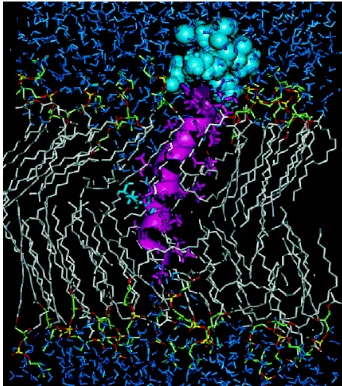
Fig. 4 Model of melittin inserted into a lipid bilayer. The cationic C-terminus of melittin (blue) anchors the peptide at the negatively charged lipid headgroups. The hydrophobic and amphipathic α-helical regions of melittin (purple) are inserted into the lipophilic core of the bilayer. Adapted from Bachar et al. (65).
With an increase in membrane-bound melittin, the peptide induces transmembrane pores according to the carpet or toroidal model (Fig. 5) (67). This results in lysis of bilayer membranes, e.g. lysis of erythrocytes. Sequence requirements for lytic melittin analogs include a free positively charged N-terminus (68;69) and a positively charged C-terminus (69;70).
Fig. 5 Schematics of the toroidal model. The dark layers represent the headgroup regions of bilayers. Melittin monomers are represented by the red cylinders with the cationic C-terminal region shown in blue. The toroidal pore is formed by the lipid monolayer and melittin peptides which are in contact with the lipid headgroups. Adapted from Yang et al. (67).
Although the exact mechanism of pore formation remains to be elucidated, covalent attachment of the polycation PEI to the N-terminus of melittin is expected to prevent
+
+
+
+
+
+
+
+
+
+
+
+
+
+
+
+
+
+
+
+
+
+
+
+
NH
2
NH
2
NH
membrane insertion and pore formation, whereas conjugation via the C-terminus is thought to enhance membrane anchoring and insertion of melittin.
To determine the optimal site of melittin-linkage to PEI, the strategy applied in this thesis was to synthesize two different melittin-PEI conjugates with PEI covalently attached to either the C-terminus or the N-terminus of non-immunogenic all-(D) -melittin. Polyplexes generated with these conjugates should be compared regarding their gene transfer efficiency, their membrane destabilizing activity and their capacity to induce endosomal release. The conjugate which shows the highest potency of membrane destabilization should then be further optimized for lytic activity at pH 5 to produce conjugates that are highly active inside acidic vesicles such as endosomes.
To obtain melittin-PEI conjugates with high lytic activity at pH 5, sequence modifications with glutamic acid residues or histidine residues were introduced at the C-terminus or the N-terminus of melittin. At physiological pH such melittin analogs do not fulfill the charge requirements of active melittin analogs. At acidic pH, however, glutamic acid and histidine are fully protonated which should restore all sequence requirements resulting in active pore-forming peptides and peptide conjugates.
2
Materials and Methods
2.1 Chemicals and reagents
Branched PEI (B-PEI) with an average molecular weight of 25 kDa was obtained from Sigma-Aldrich (Taufkirchen, Germany). Linear PEI (L-PEI) with an average molecular weight of 22 kDa is available from Euromedex (Exgen 500, Euromedex, Souffelweyersheim, France). PEI was used at a 1 mg/ml stock solution neutralized with HCl.
Succinimidyl 3-(2-pyridyldithio) propionate (SPDP) was purchased from Fluka (Buchs, Switzerland).
Cysteine-modified melittin peptides and melittin analogs were obtained from Genzentrum (group of G.J. Arnold, Munich, Germany), or IRIS Biotech (Marktredwitz, Germany). Peptides were synthesized with a purity of > 95 % and were used as acetate salts after lyophilization in 4 % acetic acid.
Melittin with a cysteine residue at the N-terminus of melittin (N-mel) had the following sequence:
N-mel: CIGA VLKV LTTG LPAL ISWI KRKR QQ
Glycine-1 of native melittin was replaced by cysteine.
The sequence of melittin with cysteine at the C-terminus of melittin (C-mel) was:
C-mel: GIGA VLKV LTTG LPAL ISWI KRKR QQC
Cysteine was added to the sequence of native melittin at position 27.
N-mel was synthesized both in all-(L) and in all-(D)-configuration. C-mel was synthesized using (D)-amino acids.
C-mel-analogs (CMA) with acidic modified sequences were synthesized using (L )-amino acids and had the following structures:
CMA-1: EE GIGA VLKV LTTG LPAL ISWI KRKR QQC
CMA-3: GIGA VLKV LTTG LPAL ISWI KRKR EEC
CMA-4: EE GIGA VLKV LTTG LPAL ISWI HHHH QQC
Egg phosphatidylcholine (egg PC) was purchased from Lipoid (Ludwigshafen, Germany). Calcein, trinitrobenzenesulfonic acid (TNBS) and all other chemicals were purchased from Sigma-Aldrich (Taufkirchen, Germany).
PEG-PEI22 (molar ratio of 20 kDa PEG to 22 kDa L-PEI was 2/1) and PEG-PEI25 conjugates (molar ratio of 20 kDa PEG to 25 kDa B-PEI was 1/1) were synthesized and purified as previously described in Kursa et al. (71). EGF-PEG-PEI25 conjugate linked with a heterobifunctional 3.4 kDa PEG derivative was synthesized as described in (28).
Plasmid pCMVLuc (Photinus pyralis luciferase under control of the CMV enhancer/promoter) described in Plank et al. (25) was produced endotoxin-free by Elim Biopharmaceuticals (San Francisco, CA, USA) or Aldevron (Fargo, ND, USA). Plasmid pEGFP-N1 (encoding Enhanced Green Fluorescent Protein (EGFP) under the control of the CMV promoter) was purchased from Clontech Laboratories, Inc. (Palo Alto, CA, USA).
2.2 Quantitative analysis of B-PEI and L-PEI
2.2.1 TNBS assay
2.2.2 Copper complex assay
L-PEI was also quantified by a copper complex assay at 285 nm following the procedure published by Ungaro et al. (73). Equal amounts (100 µl) of Copper-(II)-sulfate dissolved 0.1 M sodium acetate (0.23 mg/ml), pH 5.4 were mixed with standard L-PEI samples or test solutions of L-PEI containing 10 to 60 µg/ml L-PEI diluted in water. The resulting Cu(II)/PEI-complexes were quantified by measuring the absorbance at 285 nm using a Cary 3 Bio spectrophotometer (Varian, Mulgrave, Australia). For the quantification of L-PEI in the presence of DNA, the concentration of L-PEI is calculated by the equation:
C L-PEI = (ABSTOT – ABSDNA) / ε L-PEI/Cu(II) ∗ b
ABSTOT: absorbance at 285 nm of L-PEI/Cu(II) in the presence of DNA
ABSDNA: absorbance at 285 nm of the L-PEI polyplex
ε L-PEI/Cu (II): molar absorptivity of L-PEI/Cu(II) at 285 nm (ε L-PEI/Cu(II) = 6.31 x 10⁵) b: fixed optical path length (cm)
Since the L-PEI content is measured at 285 nm (as L-PEI/Cu(II) complex), the absorption of DNA (ABSDNA) present in the solution is substantial and must be subtracted from the total absorption (ABSTOT).
2.3 Covalent labeling of DNA and PEI
Plasmid pCMVLuc was covalently labeled with the fluorophore Cy3 using the Label IT kit (MIRUS, Madison, WI, USA) according to the manufacturer’s instructions. Cy3 content was measured by absorption at 552 nm and DNA was quantified by measuring the absorbance at 260 nm. On average one Cy3 molecule was bound per 50 bp.
663 nm; PEI content was measured by TNBS assay (2.2.1). The molar ratios of PEI/Cy5 were 1/2 and 2/1 for L-PEI and B-PEI, respectively.
2.4 Conjugate
synthesis
2.4.1 Synthesis of 3-(2-pyridyldithio)-propionate-modified B-PEI
B-PEI (1.25 µmol) in 2 ml buffer (0.35 M NaCl, 20 mM HEPES, pH 8) was mixed with 3-(2-pyridyldithio)propionic acid N-hydroxy-succinimide ester (SPDP, 25 µmol) dissolved in 200 µl dimethyl sulfoxide (DMSO). After 2 h at RT B-PEI with pyridyldithio-propionate-linkers (B-PEI-PDP) was purified by gel filtration using an Äkta Basic HPLC System (Amersham Biosciences, Freiburg, Germany) equipped with a Sephadex G-25 superfine HR 10/30 column (Pharmacia Biotech, Uppsala, Sweden) equilibrated in 250 mM NaCl, 20 mM HEPES, pH 7.4; the flow rate was 0.5 ml/min. The void fractions containing PEI were pooled, aliquots were snap frozen in liquid nitrogen and stored at -80°C. PEI content was measured by TNBS assay (2.2.1). The degree of modification with dithiopyridine linker was determined spectrophotometrically at 343 nm by release of pyridine-2-thion (molar absorptivity = 8080 M-1 cm-1) after reduction of an aliquot with excess dithiothreitol (DTT, 100 mM). For the synthesis of mel-PEI and CMA-PEI conjugates, two different PEI-PDP batches were used with a molar ratio of PEI/PDP of approximately 1/15 and 1/10, respectively.
2.4.2 Synthesis of C-mel-PEI and N-mel-PEI conjugates
Conjugates were eluted between 2 and 3 M NaCl as monitored at 230 nm and 280 nm. Main fractions were pooled, concentrated and desalted (final salt concentration 75 to 150 mM) on Centricon Plus-20 centrifugal filter units (10 kDa cut off, Millipore, Bedford MA, USA). Conjugates were sterile filtered and aliquots were snap frozen in liquid nitrogen and stored at -80°C. B-PEI content of the melittin-PEI conjugates was determined by TNBS assay (2.2.1). Melittin also reacts with TNBS but molar absorptivity of trinitrophenylated melittin derivatives is approximately 10-fold lower than the colored product with PEI and, therefore, quantification of B-PEI is not significantly affected by the presence of melittin. The concentration of melittin in the conjugates was measured by absorption at 280 nm (molar absorptivity of melittin = 5570 M-1 cm-1). C-mel-PEI and N-mel-PEI conjugates were obtained with a mean recovery of 55 % based on analysis of PEI (50 nmol of PEI and 840 nmol of melittin). The molar ratio of PEI to melittin was 1/16.
2.4.3 Synthesis of CMA-PEI conjugates
reaction of the peptides with the PDP linkers, the amount of conjugated peptide was determined at 343 nm by release of pyridine-2-thion from residual PDP linkers after reduction with DTT. Conjugates were obtained with recoveries based on analysis of PEI of 40 % (CMA-1-PEI, 80 nmol PEI, 380 nmol CMA-1), 7 % (CMA-2-PEI, 10 nmol PEI, 80 nmol CMA-2), 15 % (CMA-3-PEI, 35 nmol PEI, 225 nmol CMA-3) and 11 % (CMA-4-PEI, 20 nmol PEI, 150 nmol CMA-4); the molar ratios of PEI to CMA-peptide were 1/5-8.
An improved purification procedure was developed for the synthesis of CMA-2-PEI and CMA-3-PEI conjugates. The new protocol is based on size exclusion chromatography and leads to higher yields of purified conjugates. Superdex 75 prep grade (60 ml) in water (Amersham Biosciences, Freiburg, Germany) was conditioned by drop wise application of 10 ml B-PEI (10 mg) to reduce unspecific binding of the conjugates. The conditioned gel material was filled into a HR 10/30 column (Pharmacia Biotech, Uppsala, Sweden) and equilibrated in 0.5 M NaCl, 20 mM sodium acetate, pH 5 at a flow rate of 0.5 ml/min. Conjugates were applied to the column and the void fractions containing PEI were dialyzed against 50 mM NaCl 20 mM HEPES, pH 7.4 using a 5 ml QuixSep dialyzer (Roth, Karlsruhe, Germany) equipped with a 14 kDa cut off membrane. After dialysis, conjugates were sterile filtered and aliquots were snap frozen in liquid nitrogen and stored at -80°C. CMA-2-PEI and CMA-3-CMA-2-PEI conjugates were obtained with a recovery of 53 % (CMA-2-CMA-2-PEI, 100 nmol PEI, 900 nmol CMA-2) and 30 % (CMA-3-PEI, 60 nmol PEI, 540 nmol CMA-3) based on analysis of PEI.
2.5 Polyplex
formation
receptor-targeted polyplexes were prepared by first diluting and mixing EGF-PEG-PEI and EGF-PEG-PEI conjugates with free PEI or peptide-PEI conjugates at indicated ratios in HBG. The used ratios (% w/w) were all based on the PEI content of the different components. The PEI conjugate buffer solution was then mixed with plasmid DNA diluted in HBG at an N/P ratio of 6 and a final DNA concentration of 20 or 100 µg/ml.
Targeted and non-targeted polyplexes were allowed to stand for at least 20 min at RT before use.
2.6 Measurement of particle size and zeta potential
Particle size of transfection complexes was measured by laser-light scattering using a Malvern Zetasizer 3000HS (Malvern Instruments, Worcestershire, UK). Polyplexes were generated in HBG at DNA concentrations of 100 or 200 µg/ml and subsequently diluted to 10 µg/ml prior to measurement. Targeted polyplexes were prepared and analyzed in HBS at a DNA concentration of 20 µg/ml. For estimation of the surface charge, transfection complexes were diluted in 10 mM NaCl to give a final DNA concentration of 2 µg/ml and the zeta potential was measured as previously described (75). The average conductivity observed for all formulations was approximately 1 mS.
2.7 Purification of polyplexes by size exclusion chromatography
40 µg/ml for DNA bound to L-PEI or B-PEI, respectively. These values have been calculated by comparing standard PEI polyplexes with free plasmid DNA (1 OD260 = 50 µg/ml). L-PEI content of the fractions was quantified by copper complex assay (2.2.2) and B-PEI content was analyzed by TNBS assay (2.2.1). The TNBS assay is not significantly affected by the presence of DNA. From the concentrations of PEI and DNA determined in the purified polyplexes, their final N/P ratios were calculated. N/P ratios of purified complexes were also verified by DNA mobility shift assay using agarose gel electrophoresis (76).
2.8 Cell
culture
Cell culture media, antibiotics and fetal calf serum (FCS) were purchased from Invitrogen GmbH (Karlsruhe, Germany). All cultured cells were grown at 37° C in 5 % CO2 humidified atmosphere. CT 26 murine colon carcinoma cells (ATCC CRL-2638), B16-F10 murine melanoma cells (kindly provided by I.J. Fidler, Texas Medical Center, Houston, TX, USA) and HeLa human cervical carcinoma cells (ATCC CCL-2) were cultured in DMEM supplemented with 10 % FCS. A-10 rat aortic smooth muscle cells (DSZM, ACC 132) were grown in DMEM supplemented with 20 % FCS. Neuro2A murine neuroblastoma cells (ATCC CCl-131) and Renca-EGFR mouse renal carcinoma cells stably transfected with pLTR-EGFR and pSV2neo (kindly provided by Winfried Wels, Georg-Speyer-Haus, Frankfurt am Main, Germany) were cultured in RPMI-1640 with Glutamax I medium supplemented with 10 % FCS and 0.5 mg/ml geneticin (for Renca-EGFR only). HUH-7 hepatocellular carcinoma cells (JCRB 0403; Tokyo, Japan) were grown in DMEM high glucose/F12 (1/1) supplemented with 10 % FCS. Primary endothelial cells (PEC) were isolated from explants of porcine aortic vessels and cultured in M 199 medium supplemented with 10 % FCS, 4 mM glutamine, 100 U/ml penicillin, 100 µg/ml streptomycin and 2.5 mg/ml amphotericine B as described in (77).
2.9 Luciferase reporter gene expression
(pCMVLuc) were added to the cells in 100 µl fresh culture medium containing 100 U/ml penicillin and 100 µg/ml streptomycin. Culture medium (100 µl) was added 4 h after transfection. When using targeted polyplexes for transfection, medium was replaced after 4 h by 200 µl fresh culture medium. Gene expression was measured after 24 h. Detection of luciferase activity was carried out as described recently (48). Transfection efficiency was expressed as relative light units (RLU) per seeded cells (mean +/- SD of triplicates). Two ng of recombinant luciferase (Promega, Mannheim, Germany) correspond to 107 light units.
2.10 EGFP reporter gene expression
2.11 Metabolic activity of transfected cells
Cells were plated in white, clear bottom 96 well plates (Nalge Nunc International, Naperville, IL, USA) at a density of 5 x 10³ cells per well 24 h prior to transfection. Transfection of cells was carried out as described above (2.9). Metabolic activity was assayed 24 h after transfection using the CellTiter-Glo Luminescent Cell Viability Assay (Promega, Mannheim, Germany) according to the manufacturer’s instructions. The assay is based on the quantitative measurement of the cellular ATP content. Metabolic activity was calculated as percentage of non-transfected control cells (corresponding to 100 % metabolic activity).
2.12 Flow cytometric analysis of cellular polyplex association
Cells were seeded in 12 well plates (TPP, Trasadingen, Switzerland) at a density of 105 cells per well 24 h prior to transfection. PEI polyplexes containing Cy3-labeled DNA (10 %) and Cy5-labeled PEI (2 % or 10 % for L-PEI or B-PEI, respectively) were added to the cells at a concentration of 3 µg/ml DNA per well in 1 ml fresh culture medium. Cells were harvested after 4 h incubation at 37° C by treatment with trypsin/EDTA solution (Invitrogen GmbH, Karlsruhe, Germany) and kept on ice until cell association of polyplexes was assayed using a Cyan MLE flow cytometer (DakoCytomation, Copenhagen, Denmark). The fluorophores Cy3 and Cy5 were excited at 488 nm and 635 nm, respectively, and emission was detected at 575±25 nm and 665±20 nm, respectively. Data acquisition was performed in linear mode and data were analyzed in logarithmic mode. To discriminate between viable and dead cells, cells were appropriately gated by forward versus sideward scatter; to exclude doublets cells were gated by forward scatter versus pulse width, and 2 x 10⁴ gated events per sample were collected. Experiments were performed at least in triplicates.
2.13 Laser scanning microscopy
supplemented with 20 mM HEPES, pH 7.4. For co-localization analysis, free PEI containing 75 % Cy5-labeled PEI was added simultaneously or 4 h post-transfection.
Live cell imaging was performed 8 h after transfection using a confocal laser scanning microscope (LSM 510 Meta, Carl Zeiss, Jena, Germany) equipped with an argon and two helium/neon lasers delivering light at 488, 543 and 633 nm, respectively. Light was collected through a 63 x 1.4 NA oil immersion objective (Zeiss). Cy3 fluorescence was excited with the 543 nm line; emission was collected using a 560 nm long-pass filter. Excitation of Cy5 fluorescence was achieved by using the 633 nm line, with the resulting fluorescent wavelengths observed using a 650 nm long-pass filter. No signal overspill between the individual fluorescence channels was observed. An optical section thickness of 0.6 µm was chosen. Transmitted light images (excitation at 488 nm) were collected using differential interference contrast (DIC). Digital image recording and image analysis were performed with the LSM 5 software, version 3.0 (Zeiss).
2.14 Transmission light and epifluorescence microscopy
Cells were seeded in 48 well plates at a density of 3 x 10⁴ cells per well 24 h prior to transfection. Cells were transfected with DNA complexes encoding for EGFP at a concentration of 2 µg/ml or 4 µg/ml DNA per well in 500 µl fresh culture medium. Transmission light microscopy of living cells was performed 2 h after transfection using an Axiovert 200 microscope (Carl Zeiss, Jena, Germany) equipped with a Sony DSC-S75 digital camera (Sony Corporation, Tokyo, Japan). Light was collected through a 32 x 0.25 NA objective (Zeiss), and images were captured using phase contrast.
emission was collected through a 615 nm long-pass filter. Digital image recording and image analysis were performed with the Axiovision 3.1 software (Zeiss).
2.15 Video fluorescence microscopy
processed into AVI movies by using the Volocity 3-D/4-D Visualization software (Improvision, Lexington, KY, USA).
2.16 Erythrocyte leakage assay
Human erythrocytes were isolated from fresh citrate treated blood and washed in phosphate-buffered saline (PBS) by four centrifugation cycles, each at 800 g for 10 min at 4° C. The erythrocyte pellet was diluted 10-fold in 150 mM NaCl. Peptides and peptide conjugates were serially diluted in 90 µl buffer (HBS, pH 7.1 or 150 mM NaCl, 15mM citric acid, pH 5) using a V-bottom 96 well plate, resulting in peptide concentrations of 0.25 – 16 µM. For 100 % lysis, control wells contained buffer with 1 % Triton-X-100. Erythrocyte suspension (10 µl, containing approximately 109 erythrocytes) was added to each well and the plates were incubated at 37 °C for 30 min under constant shaking. After centrifugation at 300 g for 10 min, 50 µl supernatant was analyzed for hemoglobin release at 450 nm using a microplate plate reader (Spectrafluor Plus, Tecan Austria GmbH, Grödig, Austria). Experiments were performed in duplicates.
2.17 Liposome leakage assay
of diluted peptide conjugates in black 96 well plates. For 100 % lysis, liposomes were added to control wells containing 1 % Triton-X-100 in buffer. After 30 min incubation at RT, plates were assayed for calcein fluorescence at 530 nm (excitation at 485 nm) on a microplate reader (Spectrafluor Plus, Tecan Austria GmbH, Grödig, Austria). Experiments were performed in duplicates.
2.18 Cell lysis assay
3 Results
3.1 Purification of PEI polyplexes
3.1.1 Purification of PEI polyplexes by size exclusion chromatography
PEI polyplexes were prepared in HEPES-buffered glucose (HBG) resulting in the formation of 100-150 nm particles (see also (19;20)). Size exclusion chromatography (SEC) on a Sephacryl S-200 matrix pre-conditioned with PEI was used to purify PEI polyplexes after polyplex formation. SEC allowed complete removal of free PEI from polyplexes (Fig. 6). Column conditioning with PEI reduced unspecific binding of polyplexes and improved polyplex recovery. Up to 80 % recovery rates for both plasmid DNA and PEI were obtained (mean recovery of 53 % or 63 % for DNA and 68 % or 72 % for PEI after SEC of L-PEI and B-PEI polyplexes, respectively).
Fig. 6. Purification of PEI polyplexes by SEC. Typical elution profile of DNA and L-PEI after purification of 650µl DNA/L-PEI polyplex N/P 6 in HBG containing 200µg/ml DNA
The biophysical properties of L-PEI and B-PEI polyplexes before and after SEC were analyzed (Table 1). For both PEI polyplexes, size and surface charge were not significantly changed after the removal of free PEI by SEC. SEC of polyplexes with different N/P ratios ranging from 6 to 12 resulted in purified polyplexes with a similar final N/P ratio of approximately 2.5, suggesting that at this N/P ratio all DNA phosphate residues are saturated with positively charged PEI nitrogens.
0 20 40 60 80 100
3.0 4.2 5.4 6.6 7.8 9.0 elution volume (ml)
µg /m l D N A 0 5 10 15 20 25 30 µg /m l PEI DNA PEI 0 20 40 60 80 100
3.0 4.2 5.4 6.6 7.8 9.0 elution volume (ml)
Table 1. Biophysical properties of polyplexes before and after SEC purification
Purification was also tested with polyplexes generated at a low N/P ratio of 3 or in a salt containing buffer (75 mM NaCl, 2.5 % glucose). Polyplex recovery, however, was as low as 10 % (data not shown). This is most likely attributed to the increased initial particle size (> 300 nm and > 1 µm, respectively) and subsequent loss of the material on the column. Aggregated polyplexes probably could not pass in between the gel beads and therefore got stuck on the column.
3.1.2 Reporter gene expression and toxicity of purified polyplexes
Reporter gene expression (luciferase activity) and cellular toxicity were evaluated in three different tumor cell lines (CT 26, B16-F10 and HeLa cells) after the application of different polyplex preparations (Fig. 7). For transfection experiments, all polyplexes were generated at an N/P ratio of 6. Polyplex preparations included non-purified polyplexes, SEC-purified polyplexes and purified polyplexes supplemented with free PEI equivalent to the amount of free PEI present in non-purified polyplexes (purified plus free PEI).
2.3 23.0 +/- 7.5
103 +/- 25 +
12 41.7 +/- 7.2
116 +/- 26
-B-PEI N/P 12
2.8 21.6 +/- 2.6
124 +/- 10 +
6 27.6 +/- 5.6
130 +/- 27
-B-PEI N/P 6
2.5 23.8 +/- 3.6
140 +/- 31 +
6 20.8 +/- 3.2
150 +/- 35
-L-PEI N/P 6
N/P ratio Zeta potential (mV) Size (nm) SEC Polyplex 2.3 23.0 +/- 7.5
103 +/- 25 +
12 41.7 +/- 7.2
116 +/- 26
-B-PEI N/P 12
2.8 21.6 +/- 2.6
124 +/- 10 +
6 27.6 +/- 5.6
130 +/- 27
-B-PEI N/P 6
2.5 23.8 +/- 3.6
140 +/- 31 +
6 20.8 +/- 3.2
150 +/- 35
-L-PEI N/P 6
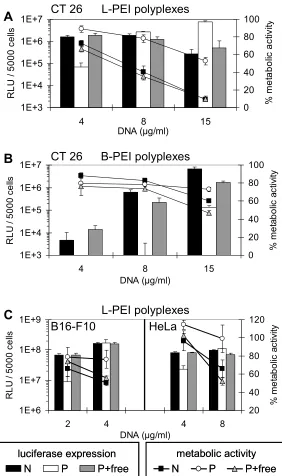
Fig. 7. Reporter gene expression and metabolic activity in different tumor cell lines. CT 26 cells were transfected with L-PEI (A) and B-PEI polyplexes (B) with increasing concentrations of DNA. (C) B16-F10 cells (left) and HeLa cells (right) were transfected with L-PEI polyplexes. Luciferase activity is displayed in bars (RLU, left y-axis), metabolic activity is displayed as lines in % of untransfected control cells (right y-axis). ‘N’: non-purified polyplexes; ‘P’: purified polyplexes; P + free: purified polyplexes plus free PEI added. Mean values + SD of triplicates are shown.
At low DNA concentrations, purified L-PEI polyplexes (Fig. 7A and C) were up to 20-fold less efficient in transfection compared to polyplexes containing free PEI (with or without SEC). At high DNA concentrations [≥ 8 µg/ml (Fig. 7A CT 26, Fig. 7C HeLa) and ≥ 4 µg/ml (Fig. 7C, B16-F10)], however, purified L-PEI polyplexes showed equivalent or even higher transfection efficiency than polyplexes with free PEI. The
1E+3 1E+4 1E+5 1E+6 1E+7
4 8 15
DNA (µg/ml) R L U / 50 00 c e lls 0 20 40 60 80 100 % m e tabol ic ac tivi ty A 1E+6 1E+7 1E+8 1E+9
2 4 4 8
DNA (µg/ml)
R
L
U
/ 5000 cel
ls 20 40 60 80 100 120 % m e ta b o lic a ctiv ity 1E+3 1E+4 1E+5 1E+6 1E+7
4 8 15
DNA (µg/ml)
RLU
/ 5000 cel
ls 0 20 40 60 80 100 % m e ta b o lic a ctiv ity B C luciferase expression N P P+free
metabolic activity N P P+free luciferase expression
N P P+free
metabolic activity N P P+free
enhanced transfection efficiency may be attributed to a low toxicity of purified particles, resulting in the survival of more transfected cells in the absence of excess PEI.
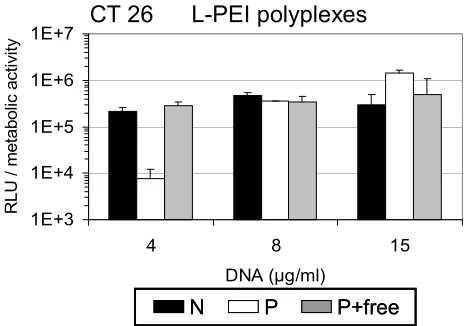
In order to evaluate toxicity of purified polyplexes, metabolic activity of cells was determined 24 h after transfection by measuring intracellular ATP levels. L-PEI polyplexes containing free PEI exerted high toxicity at high DNA doses [≥ 8 µg/ml (Fig. 7A CT 26, Fig. 7C HeLa) and ≥ 4 µg/ml (Fig. 7C, B16-F10)]; metabolic activity determined 24 h after transfection was reduced to as low as 10 % of the untransfected control cells (Fig. 7A). Using purified L-PEI polyplexes, however, metabolic activity was maintained at 50 - 90 % compared to control cells (Fig. 7A and Fig. 7C). This indicated that at high DNA doses the calculated enhanced transfection efficiency of purified polyplexes was mainly due to the lower toxicity of these particles in comparison to non-purified complexes. Therefore, to better estimate gene expression of surviving cells, luciferase activity was calculated as RLU related to metabolic activity (Fig. 8). Notably, at high DNA doses (15 µg/ml) normalized gene expression of purified, low toxic polyplexes was still five-fold higher than that of non-purified polyplexes which displayed pronounced toxicity (viability 10%, Fig. 7A right).
Fig. 8 Normalized gene expression. Luciferase activity data from Fig. 7A (transfection of CT 26 cells with L-PEI polyplexes) were normalized to the metabolic activity. ‘N’: non-purified polyplexes; ‘P’: purified polyplexes; P + free: purified polyplexes plus free PEI added. Mean values + SD of triplicates are shown.
In line with the results obtained with L-PEI particles, purified B-PEI polyplexes showed reduced transfection efficiency in CT 26 cells in comparison to polyplexes containing free PEI (Fig. 7B). Furthermore, Fig. 7B shows that the difference in
1E+3 1E+4 1E+5 1E+6 1E+7
4 8 15
DNA (µg/ml)
R
LU
/ m
eta
bo
lic
a
cti
vi
ty
L-PEI polyplexes CT 26
transfection efficiency is becoming smaller with rising DNA concentrations. Similar results were obtained with B16-F10 and HeLa cells (data not shown). At DNA concentrations below 15 µg/ml metabolic activity after transfection with all B-PEI polyplexes was only slightly reduced compared to untransfected control cells (Fig. 7B). At the highest DNA dose tested (15 µg/ml DNA) purified B-PEI polyplexes were the least toxic resulting in 10 - 20 % higher metabolic activity compared to polyplexes with free PEI.
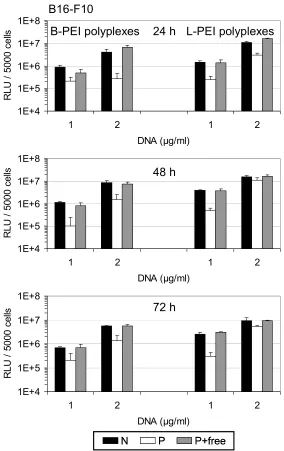
Fig. 9 Long term reporter gene expression. B16-F10 cells were transfected with B-PEI (left) and L-PEI (right) polyplexes. Luciferase activity was analyzed 24 h, 48 h and 72 h after transfection. ‘N’: non-purified polyplexes; ‘P’: non-purified polyplexes; P + free: non-purified polyplexes plus free PEI added. Mean values + SD of triplicates are shown.
1E+4 1E+5 1E+6 1E+7 1E+8
1 2 1 2
DNA (µg/ml)
RL
U /
5
00
0 c
ells
1E+4 1E+5 1E+6 1E+7 1E+8
1 2 1 2
DNA (µg/ml)
RL
U /
5
00
0 c
ells
1E+4 1E+5 1E+6 1E+7 1E+8
1 2 1 2
DNA (µg/ml)
RL
U /
5
00
0 c
el
ls
B-PEI polyplexes L-PEI polyplexes B16-F10
24 h
48 h
72 h
Long term gene expression using low doses of DNA was analyzed 48 h and 72 h after transfection of B16-F10 cells with purified polyplexes or polyplexes containing free PEI, and gene expression levels were compared to the levels measured after 24 h (Fig. 9). The applied low DNA doses were overall non-toxic and transfection with all polyplexes resulted in stable levels of gene expression over 72 h. Luciferase activity after transfection with purified polyplexes was reduced compared to polyplexes with free PEI over the whole expression time monitored.
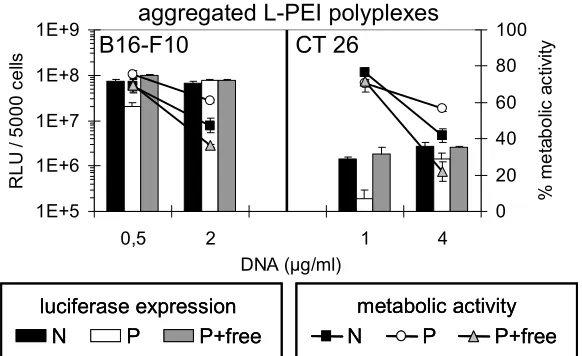
Fig. 10 Reporter gene expression and metabolic activity after transfection with aggregated polyplexes. B16-F10 cells (left) and CT 26 cells (right) were transfected with aggregated L-PEI polyplexes (size
> 1µm) with increasing concentrations of DNA. Polyplex aggregates were obtained by adding salt to polyplexes generated in HBG. Luciferase activity is displayed in bars (RLU, left y-axis), metabolic activity is displayed as lines in % of untransfected control cells (right y-axis). ‘N’: non-purified polyplexes; ‘P’: purified polyplexes; P + free: purified polyplexes plus free PEI added. Mean values + SD of triplicates are shown.
Aggregated polyplexes (≥ 1 µm) are known to mediate high gene transfer efficiency
in vitro (19;20). Therefore, aggregated L-PEI polyplexes were generated by adding HEPES-buffered saline (HBS, 150 mM NaCl) to polyplexes prepared in HBG (final DNA concentration 20 µg/ml, final buffer concentration 75 mM NaCl). HBS was added 30 min prior to transfection to either non-purified or purified L-PEI polyplexes with or without free PEI. Particle size of all aggregated L-PEI polyplexes was larger than 1 µm. Gene transfer with non-purified aggregated polyplexes was up to 10-fold higher than with the respective purified polyplexes. Metabolic activity with aggregated polyplexes containing free PEI was 20 – 70 % compared to control cells, whereas the metabolic activity was 60 – 70 % with purified polyplexes (Fig. 10). The influence of
1E+5 1E+6 1E+7 1E+8 1E+9
0,5 2 1 4
DNA (µg/ml)
R
L
U
/ 500
0 cel
ls
0 20 40 60 80 100
%
m
e
ta
b
o
lic
a
ctiv
ity
B16-F10 CT 26
aggregated L-PEI polyplexes
luciferase expression N P P+free
metabolic activity N P P+free luciferase expression
N P P+free
free PEI on both gene transfer and toxicity was less pronounced with aggregated polyplexes than observed with the small polyplexes generated in HBG.
3.1.3 Enhanced cellular association of purified PEI polyplexes
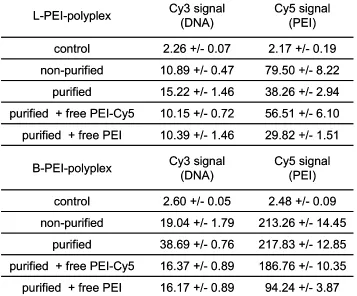
Since purified polyplexes displayed lower transfection efficiency at low DNA concentrations, it was further investigated whether this was due to altered cellular association. This was studied by flow cytometry using Cy3-labeled plasmid and Cy5-labeled PEI for complex formation (Table 2).
Table 2. Cellular association of double-labeled L-PEI and B-PEI polyplexes determined by flow cytometry. Median channel values +/- SD of at least triplicates are shown.
For both L-PEI and B-PEI polyplexes, cellular association of DNA (Cy3 signal) was increased with purified polyplexes, and DNA association was reduced upon addition of free PEI (purified plus free PEI or free Cy5-PEI). The absence of free PEI in purified polyplexes led to significantly reduced total PEI association (Cy5 signal) after incubation with L-PEI polyplexes, whereas total PEI association was not altered in the corresponding experiment with B-PEI polyplexes. For both L-PEI and B-PEI polyplexes, the addition of unlabeled PEI to purified polyplexes reduced cellular PEI
94.24 +/- 3.87 16.17 +/- 0.89
purified + free PEI
186.76 +/- 10.35 16.37 +/- 0.89
purified + free PEI-Cy5
217.83 +/- 12.85 38.69 +/- 0.76
purified
213.26 +/- 14.45 19.04 +/- 1.79
non-purified
2.48 +/- 0.09 2.60 +/- 0.05
control Cy5 signal (PEI) Cy3 signal (DNA) B-PEI-polyplex
29.82 +/- 1.51 10.39 +/- 1.46
purified + free PEI
56.51 +/- 6.10 10.15 +/- 0.72
purified + free PEI-Cy5
38.26 +/- 2.94 15.22 +/- 1.46
purified
79.50 +/- 8.22 10.89 +/- 0.47
non-purified
2.17 +/- 0.19 2.26 +/- 0.07
control Cy5 signal (PEI) Cy3 signal (DNA) L-PEI-polyplex
94.24 +/- 3.87 16.17 +/- 0.89
purified + free PEI
186.76 +/- 10.35 16.37 +/- 0.89
purified + free PEI-Cy5
217.83 +/- 12.85 38.69 +/- 0.76
purified
213.26 +/- 14.45 19.04 +/- 1.79
non-purified
2.48 +/- 0.09 2.60 +/- 0.05
control Cy5 signal (PEI) Cy3 signal (DNA) B-PEI-polyplex
29.82 +/- 1.51 10.39 +/- 1.46
purified + free PEI
56.51 +/- 6.10 10.15 +/- 0.72
purified + free PEI-Cy5
38.26 +/- 2.94 15.22 +/- 1.46
purified
79.50 +/- 8.22 10.89 +/- 0.47
non-purified
2.17 +/- 0.19 2.26 +/- 0.07
association. Control experiments confirmed that fluorescence intensities of Cy5-PEI and Cy3-DNA before and after polyplex formation were similar (no fluorescence quenching upon DNA compaction), and there was no signal overspill between the two fluorescence channels for Cy3 and Cy5 (data not shown).
Despite enhanced cellular association, gene transfer efficiency of purified polyplexes was reduced compared to non-purified complexes. These results implicated that not cellular association but reduced internalization and/or intracellular delivery were the major obstacles to efficient gene delivery with purified polyplexes.
3.1.4 Delayed administration of free PEI enhances gene expression
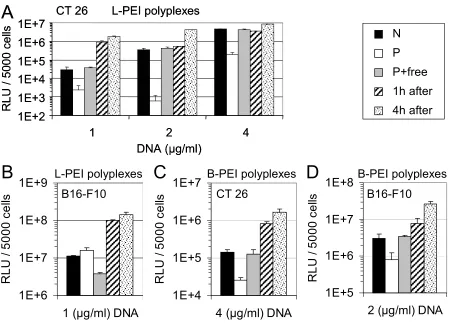
To determine whether simultaneous application of free PEI with the polyplexes was required for the observed transfection effects, a time course experiment was performed. L-PEI was added to CT 26 cells at equivalent amounts that had been removed by SEC, either simultaneously with purified L-PEI polyplexes or at 1 h or 4 h after transfection without replacing the transfection medium. Luciferase expression was determined 24 h after transfection (Fig. 11).
Fig. 11. Reporter gene expression in CT 26 and B16-F10 cells with free L-PEI or B-PEI added at different time points. CT 26 cells (A) or B16-F10 cells (B) were transfected with the indicated concentrations of L-PEI polyplexes (both purified and non-purified) and free L-PEI was added to the cells at different time points after transfection without replacing the transfection medium. CT 26 cells (C) and B16-F10 cells (D) were transfected with B-PEI polyplexes and free B-PEI was added at different time points. ‘N’: non-purified polyplexes; ‘P’: purified polyplexes; P + free: purified polyplexes plus free PEI added simultaneously; ‘1 h after’: purified polyplexes plus free PEI added 1 h after transfection; ‘4 h after’: purified polyplexes plus free PEI added 4 h after transfection. Luciferase activity is presented as mean values + SD of triplicates. Metabolic activity of all transfected cells was > 80 %.
3.1.5 Intracellular co-localization of free PEI and purified polyplexes
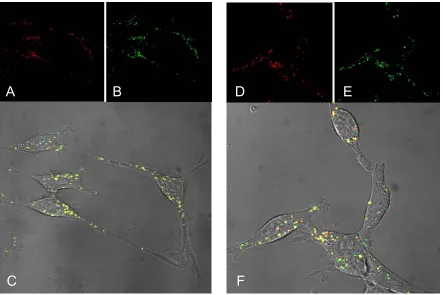
Free Cy5-labeled L-PEI was added to the cells either simultaneously with Cy3-labeled purified L-PEI polyplexes (Fig. 12A-C) or 4 h post-transfection when polyplexes were already completely internalized (Fig. 12D-F). After both simultaneous and delayed addition, the majority of free PEI was found to be co-localized with the internalized polyplexes at 8 h post-transfection. Control experiments with non-purified polyplexes revealed no differences in the intracellular pattern of Cy3-DNA distribution in comparison to purified polyplexes. Similar results
A
1 2 4
DNA (µg/ml) 1E+2 1E+3 1E+4 1E+5 1E+6 1E+7 R L U / 50 00 ce lls L-PEI polyplexes CT 26
A
1 2 4
DNA (µg/ml) 1E+2 1E+3 1E+4 1E+5 1E+6 1E+7 R L U / 50 00 ce lls L-PEI polyplexes CT 26 1E+5 1E+6 1E+7 1E+8
2 (µg/ml) DNA
R
L
U
/ 5000 cel
ls B16-F10 B-PEI polyplexes 1E+6 1E+7 1E+8 1E+9
1 (µg/ml) DNA
R L U / 5000 cel ls L-PEI polyplexes B16-F10 1E+4 1E+5 1E+6 1E+7
4 (µg/ml) DNA
R L U / 5000 cel ls B-PEI polyplexes CT 26
B
C
D
were obtained with B-PEI polyplexes (data not shown). These microscopic experiments were performed in cooperation with Katharina von Gersdorff.
Fig. 12. Cellular localization of polyplexes and free PEI in CT 26 cells. CT 26 cells were transfected with DNA-labeled (Cy3) purified L-PEI polyplexes. Free Cy5-PEI was added either simultaneously (A, B, C) or 4h post-transfection (D, E, F) without replacing the transfection medium. Confocal laser scanning microscopy with living cells was carried out 8 h after transfection. (A, D) Cy3 fluorescence of labeled polyplexes (red fluorescence); (B, E) Cy5 fluorescence of labeled free L-PEI (green fluorescence); (C, F) overlay of both fluorescence channels (Cy3 and Cy5) with transmitted light (DIC). Yellow fluorescence indicates co-localization of Cy3-labeled polyplexes and Cy5-labeled free PEI.
In summary, purified PEI polyplexes demonstrated low cellular toxicity compared to polyplexes with free PEI. The removal of unbound PEI by SEC reduced the transfection efficiency of these purified vectors suggesting that free PEI played an important role in intracellular delivery of polyplexes. Cellular co-localization of free PEI with internalized PEI polyplexes implicated that free PEI most likely enhanced the release of polyplexes from endosomal vesicles after internalization. Hence, alternative measures to improve the transfection efficiency of purified PEI polyplexes are required, such as incorporation of endosomolytic peptides into the particles. To this end, the membrane active peptide melittin and melittin analogs were coupled to PEI and the resulting polyplexes were analyzed for their activities in gene transfer.
D
E
F
C
A
B
D
E
F
C
3.2 Comparison of C- versus N-terminally linked melittin-PEI
conjugates
3.2.1 Synthesis and purification of C-mel-PEI and N-mel-PEI conjugates
B-PEI was coupled to the C-terminus (C-mel-PEI) or the N-terminus (N-mel-PEI) of all-(D)-melittin by the formation of a disulfide bond (Fig. 13). In addition, B-PEI was attached to the N-terminus of melittin in all-(L)-configuration. Dithiopyridine groups were first introduced into B-PEI by reaction of its primary amino groups with SPDP (78). Upon mixing of B-PEI-PDP with cysteine-modified melittin peptides, the dithiopyridine groups react with the free sulfhydryl groups of cysteine to the desired conjugates.
Fig. 13 Synthesis of melittin-PEI conjugates. The primary amino groups of PEI react with the succinimidyl group of SPDP resulting in PEI modified with dithiopyridine groups. In a second synthesis step the free sulfhydryl groups of cysteine at the N-terminus or the C-terminus of melittin react with dithiopyridine to the desired melittin-PEI conjugates.
Purification of the conjugates was performed by cation-exchange chromatography. The conjugate reaction mixture was loaded onto the column at a medium salt concentration of 0.5 M NaCl to avoid irreversible binding of the polycations to the resin, and subsequent salt gradient elution was performed from 0.5 to 3 M NaCl. This allowed relatively high melittin-PEI conjugate recovery rates with an approximate yield of 50 % based on analysis of PEI.
S S N N H
PEI
O S SN O N
O O
O
N H2
S H
S S N
H
PEI
O + + SPDP melittin(Cys)PEI
melittin(Cys) S S N N HPEI
O S SN O N
O O
O
N H2
S H
S S N
3.2.2 Reporter gene expression of N-mel-PEI polyplexes with melittin in all-(D)
versus all-(L)-configuration
In contrast to previously published N-mel-PEI conjugates (48) which were synthesized with all-(L)-peptides, in this thesis the optimal site of melittin linkage to PEI was investigated using non-immunogenic all-(D)-melittin-PEI conjugates. All
-(D)-and all-(L)-melittin were shown to have the same hemolytic and antibacterial activities (61;62). Nevertheless, it was unclear whether the transfection efficiency of melittin-PEI polyplexes depended on the peptide’s enantiomeric configuration. Therefore, melittin-PEI was covalently attached to the N-terminus of all-(L)-melittin or all-(D)-melittin resulting in conjugates with 10 molecules melittin conjugated to one molecule PEI. The conjugates all-(L)-N-mel-PEI and all-(D)-N-mel-PEI were used to generate polyplexes, and transfection efficiency was determined in B16-F10 cells and HeLa cells in comparison to melittin-free B-PEI polyplexes. Mel-PEI polyplexes mediated 10-fold (all-(L)-N-mel-PEI) and 5-fold (all-(D)-N-mel-PEI) higher levels of luciferase activity than polyplexes without melittin (B16-F10, Fig. 14A). Moreover, FACS-analysis showed that 33 % and 26 % of HeLa cells were EGFP positive after transfection with all-(L)-N-mel-PEI and all-(D)-N-mel-PEI polyplexes, respectively, whereas transfection with melittin-free B-PEI polyplexes resulted in only 0.5 % EGFP positive cells (Fig. 14B).
Fig. 14 Transfection efficiency of N-mel-PEI polyplexes containing all-(L)-melittin or all-(D)-melittin. B16-F10 cells (A) and HeLa cells (B) were transfected with B-PEI polyplexes or N-mel-PEI polyplexes of all-(L) or all-(D) melittin. Luciferase (A) and EGFP expression (B) was analyzed 24 h after transfection. Mean values + SD of triplicates are shown.
1E+5 1E+6 1E+7 1E+8
2.5 DNA (µg/ml)
R
LU
/
10
00
0 c
el
ls
0 10 20 30 40
3.3 DNA (µg/ml)
%
E
G
F
P
p
osi
tiv
e cel
ls
B-PEI all-L-N-mel-PEI all-D-N-mel-PEI B-PEI all-L-N-mel-PEI all-D-N-mel-PEI
HeLa B16-F10