DETERMINATION OF SHALLOW SUBSTRATE FROM
SATELLITE REMOTE SENSING DATA WITH BIO-OPTIC BASED
ALGORITHM
NORIN NAZIRA BINTI HAMID
DETERMINATION OF SHALLOW SUBSTRATE FROM SATELLITE REMOTE SENSING DATA WITH BIO-OPTIC BASED ALGORITHM
NORIN NAZIRA BINTI HAMID
A thesis submitted in fulfillment of the requirements for the award of the degree of
Master of Science (Remote Sensing)
Faculty of Built Environment and Surveying Universiti Teknologi Malaysia
DEDICATION
This work is dedicated to my beloved
parents Hamid bin Keling and Asmah binti Isnin, my caring sister Azwa Hashima and Nadia Nurulzanna, my responsible younger brothers Aidia Nadzir and Nur Aqib
and my soulmate
my husband Mohd Samsuri Md Nor
and little caliph Nur Raisha Sofia binti Mohd Samsuri
ACKNOWLEDGEMENTS
Assalamualaikum w.b.t.;
Alhamdulillah. Praise to Allah for His permission for letting me to finish my thesis. Instead of that, true support from the organization and people around make this work success. I might not easily finish this thesis without these true supports. Firstly, I would like to give a special thanks to my supervisor, Prof. Sr. Dr. Mazlan Hashim who always teach, encourage, share experience and tips and be patient to me in order to help me to finish this thesis. I would also like to thank Nurul Nadiah bt Yahya and Syarifuddin bin Misbari, my seagrass team for their support and kindness in sharing their experiences and supporting me in many ways.
My thanks also go to my lecturers who have taught me during the course. To all the staff of INSTEG and other staff in the Faculty of Geoinformation and Real Estate, thank you for your support. Instead of that, thanks to my labwork friends and student under the same supervisor. They are very kind in supporting, share knowledge and guide to become a good writer and student.
ABSTRACT
ABSTRAK
TABLE OF CONTENTS
CHAPTER TITLE PAGE
DECLARATION ii
DEDICATION iii
ACKNOWLEDGEMENTS iv
ABSTRACT v
ABSTRAK vi
TABLE OF CONTENTS vii
LIST OF TABLES xi
LIST OF FIGURES xii
LIST OF ABBREVIATIONS xvi
LIST OF SYMBOLS xviii
LIST OF APPENDICES xx
1 INTRODUCTION
1.1 Background 1
1.2 Problem Statement 3
1.3 Objectives of Study 4
1.4 Scope of study 4
1.6 Significance of Study 9
1.7 Thesis Structure 11
2 LITERATURE REVIEW
2.1 Introduction 13
2.2 The concept of bio-optic algorithm 14
2.2.1 Inherent optical properties 14
2.2.2 Apparent optical properties 15
2.2.3 Case 1 and case 2 waters 16
2.3 The bio-optic techniques and it applications 18
2.3.1 Bio-optic techniques 18
2.3.2 Bio-optic applications 21
2.4 Selective bio-optical optimization technique used for mapping sea bottom substrate
22
2.5 Summary 27
3 RESEARCH METHODOLOGY
3.1 Introduction 30
3.2 Data Sources and Materials 31
3.2.1 Satellite Image 31
3.2.2 Hydrographic map 35
3.2.3 Tidal Chart 36
3.2.4 In situ data 38
3.3 Data Pre-processing 38
3.3.1 Satellite Images 40
3.3.1.2 Image Subset 43
3.3.1.3 Image Masking 44
3.3.1.4 Sunglint Removal 47
3.3.1.5 Conversion of DN to Radiance 54 3.3.1.6 Conversion of Radiance to TOA
reflectance
57
3.3.2 Hydrographic map 61
3.3.3 Insitu data 64
3.4 Data Processing 66
3.4.1. Bio-optic algorithm 66
3.4.2. Image Classification 68
3.5 Analyses method 69
3.6 Summary 70
4 RESULTS, ANALYSIS AND DISCUSSION
4.1 Introduction 71
4.2 Results 71
4.2.1 Image Pre-processing 72
4.2.2 Image processing 73
4.2.2.1 Bio-optic algorithm 73
4.2.2.2 Image classification 76
4.2.3 Image map 78
4.3 Analysis 82
4.3.1 Transection analysis 82
4.3.2 Confusion Matrix 86
4.4.1 Combinations of band 95
4.4.2 Water Tidal 96
4.4.3 Water Leaving Radiance/reflectance 96
4.4.4 Bio-optic Algorithm 97
4.5 Summary 97
5 CONCLUSIONS AND RECOMMENDATION
5.1 Conclusions 98
5.2 Recommendations 100
REFERENCES 101-109
LIST OF TABLES
TABLE NO. TITLE PAGE
1.1 Example of endangered species in Malaysia ocean 10
2.1 Formulation of empirical algorithm 19
2.2 Review on previous study on bio-optic technique and its applications
27
3.1 Satellite imagery information 32
3.2 Worldview-2 specification 33
3.3 Landsat-8 (OLI) specification 34
3.4 Absolute radiometric calibration and effective bandwidth for Worldview-2 image
55
3.5 Worldview-2 Band-Averaged Solar Spectral Irradiance 57
3.6 Level of agreement of Kappa coefficient 69
4.1 Omission and Commission errors at Merambong Island 90
4.2 Omission and Commission errors at Tinggi Island (Worldview-2)
90
4.3 Omission and Commission errors at Tinggi Island (Landsat-8)
LIST OF FIGURES
FIGURE NO. TITLE PAGE
1.1 Area of study 7
1.2 Tinggi Island area 8
2.1 Diagram shows the schematic representation of the optical relationship of the coastal zone ecosystem and influence by the sunlight.
17
2.2 Worldview-2 satellite spectral bands (Globe 2010) 24
2.3 Illustration of sun glint in a variety of optical imagery. 26
3.1 Satellite Worldview-2 images 32
3.2 Satellite Landsat-8 images 32
3.3 Hydrographic map (digitizied) at Merambong Island (a) and Tinggi Island (b) , Johor, Malaysia
35-36
3.4 Tidal chart of (a) Merambong Island and (b) Tinggi Island
37
3.5 Instruments used to collect in situ data; (a) GPS (Garmin) and (b) Spectroradiometer
38
3.7 Worldview-2 multispectral image with 2 meter spatial resolution at Merambong area.
41
3.8 Worldview-2 panchromatic image with 0.5 meter spatial resolution at Merambong area.
41
3.9 Worldview-2 multispectral image with 2 meter spatial resolution at Tinggi Island area.
41
3.10 Worldview-2 panchromatic image with 0.5 meter spatial resolution at Tinggi Island area.
41
3.11 Result of Worldview-2 pan-sharpen images 42-43
3.12 Subset of satellite image for Tinggi Island area 44
3.13 Image masking to land 45
3.14 Masked images of satellite data 46
3.15 Sun glint occurs by the red line 48
3.16 Relationship between RGB band width and NIR band width for satellite imagery at Merambong Island.
49
3.17 The relationship between RGB band width and NIR band width for satellite imagery at Tinggi Island.
49
3.18 Images of Band 2 (blue), Band 3 (green), Band 5 (red) before sunglint removal (left) and after deglinted (right) and images after combining RGB band for deglinted process for both (a) Merambong Island and (b) Tinggi Island
50-53
3.19 Radiance images by band for Merambong area 55
3.20 Radiance images by band for Tinggi Island area for Worldview-2 image
56
Merambong (a) and Tinggi Island (b) for Worldview-2 image.
3.22 Reflectance images by band for Merambong area 59
3.23 Reflectance images (Worldview-2) by band for Tinggi Island area
59
3.24 Reflectance images (Landsat-8) by band for Tinggi Island area
60
3.25 Reflectance images of band combination RGB for Merambong (a), Tinggi Island (b) for Worldview-2 and Tinggi Island (c) for Landsat 8
60-61
3.26 Water depth point data. 62
3.27 Bottom depth images for Merambong (a) and Tinggi Island (b)
63
3.28 In situ data using underwater camera 65
4.1 Bio-optic images of Merambong Island for Band 2, Band 3 and Band 5
73
4.2 Bio-optic images of Tinggi Island (Worldview-2) for Band 2, Band 3 and Band 5
74
4.3 Bio-optic images of Tinggi Island (Landsat-8) for Band 2, Band 3 and Band 4
75
4.4 Maximum likelihood classification image at Merambong Island
76
4.5 Maximum likelihood classification image (Worldview-2) at Tinggi Island
77
4.6 Maximum likelihood classification image (Landsat-8) at Tinggi Island
77
4.7 Map of sea bottom substrate (left) and bottom depth (right) at Merambong Island, Johor, Malaysia
4.8 Map of sea bottom substrate (left) and bottom depth (right) at Tinggi Island, Johor, Malaysia (Worldview-2)
80
4.9 Map of sea bottom substrate (left) and bottom depth (right) at Tinggi Island Johor, Malaysia (Landsat-8),
81
4.10 Transection area for Merambong area 83
4.11 Transection chart for the respected area 84-85
4.12 Overall accuracy by band combination versus percentage
87
4.13 Kappa coefficient between area and level of agreement 89
4.14 Producer and user accuracy of substrate features for combination of Band 2 and Band 3 at Merambong Island
91
4.15 Producer and user accuracy of substrate features for combination of Band 3 and Band 5 at Merambong Island
91
4.16 Producer and user accuracy of substrate features for combination Band 2 and Band 3 at Tinggi Island (Worldview-2)
92
4.17 Producer and user accuracy of substrate features for combination Band 3 and Band 5 at Tinggi Island (Worldview-2)
93
4.18 Producer and user accuracy of substrate features for combination band 2 and 3 at Tinggi Island (Landsat-8)
94
4.19 Producer and user accuracy of substrate features for combination band 3 and 4 at Tinggi Island (Landsat-8)
LIST OF ABBREVIATIONS
ADEOS-II : Advanced Earth Observation Satellite II AOP : Apparent Optical Properties
BRI : Bottom Reflectance Index
CASI : Compact Airborne Spectral Imager CDOM : Coloured Dissolved Organic Matter CZCS : Coastal Zone Color Scanner
DIB : Depth-Invariant Bottom
DII : Depth Invariant Index
DN : Digital Number
ETM : Enhanced Thematic Mapper
GLI : Global Imager
GPS : Global Positioning System
GSD : Ground Sample Distance
IOP : Inherent Optical Properties
MERIS : MEdium Resolution Imaging Spectrometer
MSS : Multi Spectral Sensor
NIR : Near Infrared
OCTS : Ocean Color and Temperature Sensor
OLI : Operational Land Imagery
RGB : Red, Green, Blue
SPM : Suspended Particulate Matter
SPOT : Satellite Pour I’Observation de la Terre (French) or Satellite for Observation of Earth
SWIR : Short-wave Infrared
TIRS : Thermal Infrared Sensor
TM : Thematic Mapper
TOA : Top of Atmosphere
UTM : Universal Transverse Mercator
VIS : Visible
WCR : Wider Caribbean Region
LIST OF SYMBOLS
R - Irradiance reflectance
rrs - Remote sensing reflectance
P - Probability
Li(VIS)’ - Deglinted image
Li(VIS) - Pixel value in band i
Bi - Regression slope
L(NIR) - Pixel value in NIR band
Lmin (NIR) - Minimum pixel value in NIR band
ρ λ - TOA reflectance values
Lλ - TOA radiance value
θs - Solar Zenith angle
dES - Earth-Sun distance
α - Total absorption coefficient
βb - Total backscattering coefficient
θ - Illumination
θw - Viewing geometry
H - Bottom depth
- Absorption of water
- Absorption of phytoplankton
- Absorption of suspended particulate matter
- Absorption of coloured dissolved organic matter
- Backscattering of water
- Backscattering of phytoplankton
- Backscattering of suspended particulate matter
Λ - Wavelength
Z - depth
LIST OF APPENDICES
APPENDIX TITLE PAGE
A Bottom Depth Of Merambong Island 110
B Bottom Depth Of Tinggi Island 114
C Satellite Worldview-2 Metadata File At Merambong Island
117
D Satellite Worldview-2 Metadata File At Tinggi Island
123
E Sea Substrate data 129
F Insitu Data at Merambong Island 131
CHAPTER 1
INTRODUCTION
1.1 Background
Remote sensing technique has been broadly used to extract remotely information by using a sensor, attached to a flying object at different levels of height from the surface of the earth. It is widely used in many applications involving land, atmosphere and ocean studies. A mathematical equation can be applied to the remote sensing method to generate a new algorithm to extract information. Furthermore, these algorithms are useful in producing accurate output.
In this study, the satellite remote sensing data, Worldview-2 and Landsat OLI (Operational Land Imager) were used for processing imagery and developing the mathematical equation namely bio-optic-based algorithm and then applied to the data. The water substrate function can be found in the algorithm. Thus, the algorithm was used to characterize the underwater substrates and study the bio-physical oceanography attributes.
some energy is scattered and absorbed by the air and water particles. However, these elements for each coastal and sea water are different from one another. The backscattering and the absorption of water particles as well as water depth, have become the main elements that influence the optic parameters. Thus, the bio-optic-based algorithm was applied to detect the water substrates available at shallow depth.
In the ocean environment, the optical properties can be divided into three major groups: (1) phytoplankton, (2) suspended particulate matters (SPM), and (3) yellow substances (commonly known as coloured dissolved organic matter; CDOM). On the contrary, for the coastal study, the optical properties are more complex because of the water constituents and ocean current. Life and activities near the coastal areas, such as the development areas, the industrial areas or tourism areas trigger to the complexity of optical properties across the coastal areas.
In the scope of bio-optic studies, the ocean water optical properties can be categorised into two: ‘Case 1’ and ‘Case 2’. In Case 1, only phytoplankton plays an important role in the variations of the water optical properties, whereas in Case 2 water, the properties of the water not only influenced by phytoplankton but also by the suspended particles and yellow substances. Therefore, this study will focus on Case 2 waters at shallow depth.
Most studies which used the bio-optical algorithm in detecting chlorophyll and ocean colour were conducted in and off Malaysian waters. A study was conducted in Peninsular Malaysia’s waters on bio-optical properties and its application for ocean colour algorithm (Bowers et al., 2012). Besides, outside Malaysia, a study was also conducted in Brazil on implications of bio-optical properties to the ocean colour algorithm (Carvalho et al., 2014). Moreover, a study conducted by Orek (2013) used concept of bio-optic to determine the inherent optical properties during the period of maximum runoff at Lena River (northern Siberia, Russia). There was also a study conducted in discriminating sea bottom features by using different water column correction methods, such as depth invariant index (DII), bottom reflectance index (BRI), and different satellite data. However, the bio-optic algorithm, used in this study to detect the sea bottom substrates, was the first time effort.
1.2 Problem Statement
Understanding water column properties of coastal water is very crucial in the remote sensing feature extractions of substrates. These substrates include seagrass, benthic mud, coral, seaweed, and other pertinent features to coastal and marine ecology. Interaction of irradiance into the water column is best described by the bio-optic algorithm.
1.3 Objectives of Study
The main objective is to produce a sea bottom map in Merambong Island and Tinggi Island using the bio-optic algorithm. Specific objectives of this study are:
(i) to investigate the suitability of the selected bio-optic algorithms for detecting shallow sea-bottom substrates;
(ii) to formulate and assess the suitability of the selected bio-optic algorithm for shallow coastal water with high-resolution satellite data; and
(iii) to verify the relationship between water constituent of bio-optic algorithm and substrate leaving radiance/reflectance, and to map the sea bottom features of Merambong and Tinggi Island area.
1.4 Scope of Study
The scope of this study are as follows:
(ii) The selected bio-optic-based algorithm had been analysed as best fit with high-resolution data. This was proven by Lyons (2011) who used Quickbird data as their high spatial resolution data which potentially provide coastal information routinely. In this study, the satellite Worldview-2 data with high spatial resolution was used. Furthermore, the satellite imagery with good bandwidth penetration can penetrate through the shallow water and near the coastal area that contains numerous suspended sediment and particles. Even so, the satellite imagery still provides good results, with less time consuming, cheaper and more outgoing especially on ocean study, where the point location is not easily pinned and a huge area to cover as compared to fieldwork observation.
(iii) The relationship between the water properties and the sea bottom substrates was studied. The bio-optic algorithm used was a mathematical equation that combines with many parameters. Some of the parameters, such as water properties and depth will affect the water leaving radiance/reflectance. Thus, this study will investigate the relationship between the water parameters, such as the depth and clarity, and different type of areas and conditions. Merambong Island is near to an industrial area and under development while Tinggi Island is a tourism area (Marine Park) and reserve forest. Finally, the maps of sea bottom substrate for both Merambong Island and Tinggi Island were produced.
(iv) Substrate in marine biology is define as the earthy materials in the bottom of a marine habitat like dirt, rocks, sand and gravel. However, in this study the substrate refer to seagrass, seaweed, coral/mud and sand.
1.5 Study area
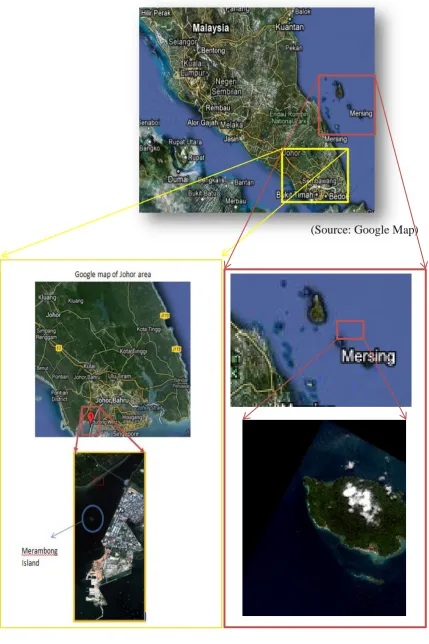
Two study areas were selected in this study, which are Merambong Island located at the south-east part of Johor coastal waters at the Straits of Johor and Tinggi Island, Mersing located at the east part of Johor coastal water, facing the South East China Sea as shown in Figure 1.1. Merambong Island is closely located to Tanjung Adang, Tanjung Kupang and Tanjung Pelepas Port (PTP). They are surrounded by narrow and busy navigational channel. Merambong Island is also known as habitat of seagrass species where nine species can be found (Japar et al., 2006).
In contrast, the physical characteristic of Tinggi Island is well known as tourism area with good quality of water and was chosen for Marine Park. It has also become a protected area for coral habitat and other marine life.
(Source: Google Map)
Figure 1.1 Area of study
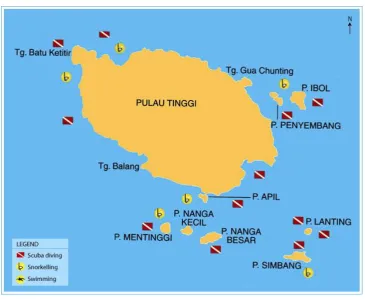
On the other hand, Tinggi Island was developed as a tourism area with the attraction of Marine Park such as Jahat Island, Ceben Island, Babi Tengah Island, Babi Hujong Island, Babi Besar Island, Gual Island, Sibu Hujong Island and Mentigi Island as referred to the Establishment of Marine Parks Malaysia (Amendment) Order 2012. These small islands have become the source of economic development of Malaysia. Various underwater activities such as snorkelling and diving can be offered because of the clear and shallow water (Figure 1.2).
Figure 1.2 Tinggi Island area
1.6 Significance of Study
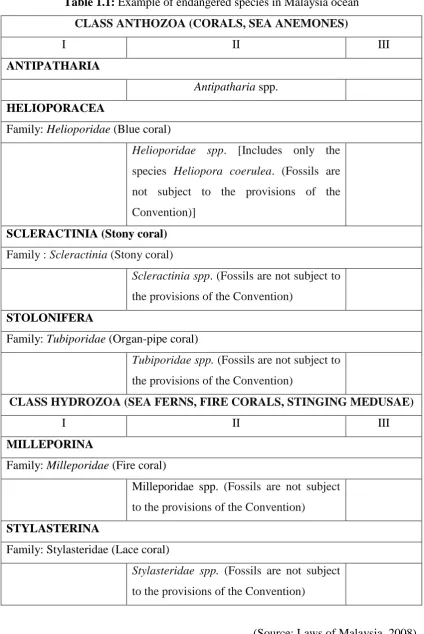
Due to the development in the area, Merambong Island is facing challenges when the area is dumped by sand, consequently, degrading habitats of seagrass, flora, fauna and other marine life that play an important role in stabilising the marine ecosystem. The water substrate will increase significantly as this happens. Even the Fisheries Act 1985 stated that permission is required to import or export fishes from the port (https://www.dof.gov.my). This endangers the marine life in that area. This study aims to map the area that has the potential to be highly destructive by the sea water substrate and provide earlier information to the fishery industry, marine scientists and tourism industry. This information is beneficial as the Merambong Island is in a developing phase to become an attractive place.
Table 1.1: Example of endangered species in Malaysia ocean CLASS ANTHOZOA (CORALS, SEA ANEMONES)
I II III
ANTIPATHARIA
Antipatharia spp. HELIOPORACEA
Family: Helioporidae (Blue coral)
Helioporidae spp. [Includes only the
species Heliopora coerulea. (Fossils are not subject to the provisions of the Convention)]
SCLERACTINIA (Stony coral) Family : Scleractinia (Stony coral)
Scleractinia spp. (Fossils are not subject to
the provisions of the Convention) STOLONIFERA
Family: Tubiporidae (Organ-pipe coral)
Tubiporidae spp. (Fossils are not subject to
the provisions of the Convention)
CLASS HYDROZOA (SEA FERNS, FIRE CORALS, STINGING MEDUSAE)
I II III
MILLEPORINA
Family: Milleporidae (Fire coral)
Milleporidae spp. (Fossils are not subject to the provisions of the Convention)
STYLASTERINA
Family: Stylasteridae (Lace coral)
Stylasteridae spp. (Fossils are not subject
to the provisions of the Convention)
1.7 Thesis Structure
This thesis consists of five chapters: Chapter 1 (Introduction), Chapter 2 (Literature review), Chapter 3 (Methodology), Chapter 4 (Results and Discussions) and Chapter 5 (Conclusions and Recommendations).
Chapter 1 describes the fundamentals and background study, problem statement, objectives, the scope of the study, study area and significance of the research. This chapter also describes briefly on the concepts and the difference between present study compared to previous studies.
In order to relate the concept of this study as stated in Chapter 1, literature reviews on previous studies have been presented in Chapter 2. Chapter 2 discusses previous studies on remote sensing data suitability for shallow water substrate and bio-optical-based algorithm in a different perspective, as well as the application of bio-optic-based algorithm used in this study.
After reviewing the previous studies, Chapter 3 explains the method used in this study in detail including the processing data technique and materials used to carry out this study, especially during the data acquisition and laboratory work. This chapter also explains the pre-processing steps such as satellite data correction and extracting substrate information.
The analysis and discussion of the results obtained are written in Chapter 4. The results are shown in detail for every processing, and comparisons were made where the difference in each processed data were discussed. The output/results were analysed using two different way; transection and confusion matrix, to clearly observe the findings of this study. In addition, comparison of this study with previously related studies, also discussed.
References
Allen G.P. and Chambers J.L.C. (1998). Sedimentation in the modern and miocene Mahakam Delta, Indonesian Petroleum Association, P235.
Alsubaie N. M. (2012). The potential of using Worldview-2 imagery for shallow water depth mapping. Master of Science, University of Calgary
Ambarwulan, W. (2002). Mapping of TSM concentrations from SPOT and Landsat
TM satellite images for Integrated Coastal Zone Management in Teluk Banten,
Indonesia. Master of Science, ITC, Enschede, The Netherlands; 130 p.
Annia S. S., James A. G., Lenio S. G., Claudio C. F. B., Thiago S. F. S. and Evlyn M. L. de M. N. (2013). Sunglint removal in high spatial resolution hyperspectral images under different viewing geometrie. Anais XVI Simpósio Brasileiro de Sensoriamento Remoto - SBSR, Foz do Iguaçu, PR, Brasil, 13 a 18 de abril de 2013, INPE.
Anatoly A.G., Daniela G., Wesley M and Tadd B. (2009). A bio-optical algorithm for the remote estimation of the chlorophyll-a concentration in case 2 waters. Papers in Natural Resources, 284.
Beck, M. W., Heck, K. L., Jr., Able, K. W., Childers, D. L., Eggleston, D. B., Gillanders, B. M., Halpern, B. S., Hays, C. G., Hoshino, K., Minello, T. J., Orth, R. J., Sheridan, P. F., & Weinstein, M. P. (2003). The Role of Nearshore Ecosystems as Fish and Shellfish Nurseries. Washington, D.C: Ecological Society of America 12 pp.
Bierwirth P.N., Lee T.J. and Burne R.V. (1993). Shallow seam floor reflectance and water depth derived by unmixing multispectral imagery. Photogrammetric Engineering & Remote Sensing, Vol. 59, No. 3, March 1993, pp. 331-338.
Bowers D. G., Md-Suffian I. and Mitchelson-Jacob, E. G. (2012). Bio-optical properties of east coast Malaysia waters in relation to remote sensing of chlorophyll. International Journal of Remote Sensing, 33(1), 150-169. doi: 10.1080/01431161.2011.584917.
Carder K.L., Chen R.F., Lee Z.P. and Hawes S.K. (1991). Semianalytical
moderate-resolution imaging spectrometer algorithms for chlorophyll a and absorption
with bio-optic domain based on nitrate-depletion temperatures. Journal of
Geophysical Research104:5403-5421.
Carvalho M., Ciotti A. M., Gianesella S. M. F.,Correa F. M. P. S. and Costa R. R. (2014). Bio-Optical properties of the inner continental shelf off Santos
Estuarine System, Southeastern Brazil, and their implications for ocean color
algorithm performance. Brazilian Journal of Oceanography. Braz. j.
oceanogr. vol.62 no.2 Sao Paulo.
Cob Z.C., Ghaffar M.A., Arshad A. and Bujang J. S. (2009). Exploring the Use of Empirical Methods to Measure the Secondary Production of Strombus canarium (Gastropoda: Strombidae) Population in Johor Straits, Malaysia. Sains Malaysiana 38(6)(2009).
Congalton R.G. and Green K. (1999). Assessing the accuracy of remotely sensed data.: principle and practices. (2nd ed.) CRC Press.Taylor and Francis Group. United State of America
Doerffer, R. and Fischer, J. (1987). Sun stimulated chlorophyll fluorescence within a daily cycle. In: The Use of Chlorophyll Fluorescence Measurements from Space for Separating Constituents of Sea Water. ESA Contract No. RFQ 3-5059/84/NL/MD Vol.2.
Dekker A.G., Brandon V.E., Anstee J.M., Pinnel N., Kutser T., Hogenboom H.J., Asterkamp R., Peters S.W.M., C. Olbert R.J. Vos and Malthus T.J. (2001). Imaging spectrometry of water, Imaging Spectrometry: Basic principles and
perspective applications. Dord recht: Kluwer Academic Publisher, p.p 307-359.
Dekker, A.G., S.W.M. Peters, M. Rijkeboer, and H. Berghuis. (1998). Analytical
processing of multitemporal SPOT and Landsat images for estuarine
management in Kalimantan Indonesia. In: Nieuwnhuis, G.J.A., R.A. Vaughan,
and M. Molenaar (Eds.). 1999. Operational Remote Sensing for Sustainable
Development. A.A. Balkema Publishers, Rotterdam, The Netherlands;
pp.315-323.
DigitalGlobe (2013) Worldview Satellite Imagery Products: Product Guide.
Longmount, Colorado.
Elsharkawy, A., M. Elhabiby and N. El-Sheimy. (2012). Quality control on the Radiometric Calibration of the Worldview-2 Data. Proceeding of Global Geospatial Conference 2012.
Fischer, J. (1983). Remote sensing of suspended matter, phytoplankton and yellow substances over coastal waters, part 1: aircraft measurements. In: Degens, E. T., Kempe, S. and Soliman, H. (Eds) Transport of Carbon and Minerals in Major World Rivers, Pt.2. Mitt. Geol.-Paläont. Inst. Univ. Hamburg, SCOPE/UNEP Sonderbd. 55, pp. 85-95.
Gitelson A.A., Gurlin D., Moses W.J. and Barrow T. (2009). A bio-optical algorithm for the remote estimation of the chlorophyll-a concentration in case 2 waters. Environment research letters doi:10.1088/1748-9326/4/4045003.
Goodman, J.A., Lee Z. and Ustin S.L. (2008). Influence of Atmospheric and
Sea-Surface Corrections on Retrieval of Bottom Depth and Reflectance Using a
Semi-Analytical Model: A Case Study in Kaneohe Bay, Hawaii. Appl. Opt.
2008, 47, F1-F11.
Gordon H.R. (1991). Absorption and scattering estimates from irradiance
measurement. Monte Carlo simulations. Limnology and Oceanography, 36:
769-777.
Green E.P., Mumby P.J., Edwards E.J. and Clark C. D. (2000). Remote sensing
Handbook for Tropical Coastal Management. Coastal Management Source
Books 3. 121-128. Paris:UNESCO.
Hamid, N. N., Hashim, M., & Misbari, S. (2015). Analyzing the effective of bio-optic algorithm to detect sea bottom substrate using remote sensing data. In ACRS 2015 - 36th Asian Conference on Remote Sensing: Fostering Resilient Growth in Asia, Proceedings Asian Association on Remote Sensing.
Hedley J. D., Harborne A. R. and Mumby P. J. (2005). Technical Note: Simple and
robust removal of sun glint for mapping shallow water benthos. International
Japar Sidik, B., Muta Harah, Z. & Aziz, A. (2006). Distribution and significance of seagrass ecosystems in Malaysia. Aquatic Ecosystem Health and Management 9: 203-214.
Jennifer P. C. andKendall L. C. (2009). Estimating chlorophyll a concentrations from remote-sensing reflectance in optically shallow waters. Remote Sensing of Environment, 101, 13-24.
Jensen, J. R. (2005). Introductory Digital Image Processing: A Remote Sensing Perspective. (3rd ed.). Upper Saddle River, NJ: Prentice Hall.
Jupp, D. L. B. (1988) Background and extensions to depth of penetration (DOP) mapping in shallow coastal waters. Proceedings of the Symposium on Remote Sensing of the Coastal Zone, pp. IV.2.1-IV.2.19. Gold Coast, Queensland.
Kishino M., Tanaka A. and Ishizika J. (2005). Retrieval of Chlorophyll a, suspended solids, and colored dissolved organic matter in Tokyo Bay using ASTER data. Remote Sensing of Environment, 99, 66-74.
Kishino M., Ishimaru T., Furuya K., Oishi T. and Kawasaki K. (1998). In-water Algorithms for ADEOS/OCTS. Journal of Oceanography. Vol 54 pp 431 to 436.
Landsat8 Data Users Handbook.pdf (2016). Department of the Interior U.S. Geological survey.
Lee Z., Carder K.L., Mobley C.D., Steward R.G. and Patch J.S. (1998). Hyperspectral remote sensing for shallow waters: 1. A semianalytical model. Applied optics. Vol 37 No. 27 pg 6329-6338.
Liew S. C., Chia A.S., Lim K. H. and Kwoh L. K. (2001). Modeling the reflectance spectra of tropical coastal waters. Ocean optics: Remote Sensing and Underwater Imaging, Ed. G.D. Gilbert, R.J. Frouin, SPIE Proc. Vol. 4488, pp. 248-255,2001.
Linhai L., Lin L. and Kaishan S. (2010). A Bio-optical approach to estimating chlorophyll-a concentration from hyperspectral remote sensing. Remote Sensing and Modelling of Ecosystem for Sustainaability VII, Proc. Of SPIE Vol. 7809, doi:10.1117/12.859484.
Lyons M., Phinn S. and Roelsfema C. (2011). Integrating Quickbird multi-spectral satellite and field data: mapping bathymetry, seagrass cover, seagrass species and change in Moreton bay, Australia in 2004 and 2007. Remote sensing 3, 42-64, doi: 10.3390/rs3010042.
Malthus T.J. and Karpouzli E. (2003). Integrating field and high spatial resolution satellite based methods for monitoring shallow submersed aquatic habitats in the Sound of Eriskay, Scotland, UK. Int. J Remote sensing 24: 2585-2593.
Mitchell B. G. and Kahru M. (2009). Bio-Optical Algorithms for ADEOS-, GLI. Journal of The Remote Sensing Society of Japan. Vol. 29 No.1(2009) pp 80-85.
Morel A. (2001). Bio-optical Models. Academic Press, doi:10.1006/rwos.2001.0407.
Mustard J., Staid M. and Fripp W. (2001). A Semianalytical approach to the calibration of AVIRIS data to reflectance over water application in a Temperate Estuary. Remote Sensing of Environment, 75, 335-349.
Nurul. N. Y. (2012). Mapping of sea bottom features using high resolution satellite
data. Master of Science, Universiti Teknologi Malaysia.
Orek H., Doerffer R., Rottgers R. Boersma M. and Wilfshire K. H. (2013).
Contribution to a bio-optic model for remote sensing of Lena river water.
Biogeosciences. 10, 7081-7094, 2013.
Pasterkamp R., Peters S.W.M. and Laanen M. (2001). Measurement protocol for the
determination of specific inherent optical propertiesof Natural surface waters.
Report Number wa/15. Institute for Environment Studies, Vrije University,
Amsterdam, The Netherlands.
Pearce, A.F. and Pattiaratchi, C.B. (1997). Applications of satellite remote sensing to the marine environment in Western Australia. Journal of the Royal Society of Western Australia, 80 (1),1-14.
Peters S.W.M., Vos R.J., Hoogenboom E.J., Hakvoort H., Vand der Woerd HJ.,
Rijkeboer M. and Pasterkamp R. (2001). MERIMON-2000 MERIS for water
quality monitoring in the Belgian-Dutch-German coastal zone. USP-2 01-25,
Netherlands Remote Sensing Board (BCRS), Program Bureau, Rijkswaterstaat
Survey Department, Delft, The Netherlands; 122 p.
Pope, R.M. and Fry E.S. (1997). Absorption spectrum (380 – 700 nm) of pure water :II. Intergrating cavity measurements. Applied optics 36(33), 8710-8723.
Rasib A. W and Hashim M. (1997). Mapping seagrass from satellite remote sensing data. Asian Conference on Remote Sensing (ACRS). Proceeding papers.
Sathyendranath S, Morel A (1983) Llght emerging from the sea-interpretation and uses in remote sensing. In: Cracknell AP fed) Remote sensing applications in marine science and technology. D Reidel Publishing Company. Dordrecht, p 323-357
Simis S.G.H., Peter S.W.M. and Gons H.J., (2005). Remote sensing of the cyanobac-terial pigment phycocyanin in turbid inland water. Limnology and Oceanogra-phy 50(1), 237-245.
Sipelgas L, Ossipova V., Raudsepp U. and Lindfors A. (2009). A bio-optical model
for the calculation of suspended matter concentration from MODIS data in the
Pakri Bay, the Gulf of Finland. Boreal Environment Research 14: 415-426.
Stramski, D, Kiefer D. A. (1991). Light-Scattering by Microorganisms in the Open Ocean. Progress in Oceanography. 28:343-383.
Susan K., John D. H. and Samantha L. (2009). Sun Glint Correction of High and Low Spatial Resolution Images of Aquatic Scenes: a Review of Methods for Visible and Near-Infrared Wavelengths. Remote Sensing. 2009, 1, 697-730.
Syarif B. Tjeerd H. and Zoltan V. (1992). Remote Sensing for Mapping TSM Concentration in Mahakam Delta: an Analytical Approach. International Institute for Geo-Information Science and Earth Observation – ITC, The Netherlands.
Updike T. and Comp C. (2010). Radiometric Use of Worldview-2 Imagery. Technical Note, Digital Globe Inc.
Akta Peraturan Perintah Penubuhan Taman Laut Malaysia (Pindaan) 2012.pdf
Vanderstraete T., Goossens R. and Ghabour T. K. (2004). Coral Reef Bottom-Type Mapping in the Red Sea (Hurghada, Egypt) Based on Remote Sensing. EARSeL eProceedings, Vol. 3, No. 2, pp. 191-207.
Wabnitz C.C., Andrefoute S., Torres-Pulliza D., Muller-Karger F. E., and Kramer P.A. (2008). Regonal-scale seagrass habitat mapping in the Wider Caribbean region using Landsat sensor: Applications to conservation and ecology. Remote sensing of Environment, 200. doi:10.1016/j.rse.2008.01.020