REMOTE SENSING BASED EVALUATION OF UNCERTAINTIES ON MODELLING OF STREAMFLOW AFFECTED BY CLIMATE CHANGE
TAN MOU LEONG
REMOTE SENSING BASED EVALUATION OF UNCERTAINTIES ON MODELLING OF STREAMFLOW AFFECTED BY CLIMATE CHANGE
TAN MOU LEONG
A thesis submitted in fulfilment of the requirements for the award of the degree of
Doctor of Philosophy (Remote Sensing)
Faculty of Geoinformation and Real Estate Universiti Teknologi Malaysia
iii
DEDICATION
ACKNOWLEDGEMENT
v
ABSTRACT
ABSTRAK
vii
TABLE OF CONTENTS
CHAPTER TITLE PAGE
DECLARATION ii
DEDICATION iii
ACKNOWLEDGEMENT iv
ABSTRACT v
ABSTRAK vi
TABLE OF CONTENTS vii
LIST OF TABLES xii
LIST OF FIGURES xv
LIST OF SYMBOLS xxii
LIST OF ABBREVIATIONS xxvii
LIST OF APPENDICES xxxv
1 INTRODUCTION 1
1.1 Background of Study 1
1.2 Statement of the Problem 6
1.3 Research Questions 9
1.4 Objectives of the Study 9
1.5 Scope of the Study 10
1.6 Significance of the Study 11
2 LITERATURE REVIEW 14
2.1 Introduction 14
2.2 Hydrological Cycle 18
2.2.1 Tropical Hydrological Cycle 20
2.2.2 Streamflow 21
2.3 Hydrological Modelling 22
2.4 Remote Sensing in Hydrological Modelling 25
2.5 Digital Elevation Model 26
2.6 Digital Elevation Model Uncertainty Assessment 27
2.7 Satellite Precipitation 28
2.8 Satellite Precipitation Uncertainty Assessment 29
2.9 Satellite Land-use 30
2.10 Satellite Land-use Uncertainty Assessment 32 2.11 Land-use Change and Hydrological Modelling 33 2.12 Climate Change and Hydrological Modelling 35
2.13 Climate Scenarios 36
2.14 General Circulation Models 38
2.15 Downscaling of General Circulation Models 41 2.15.1 Hydrology Studies in Malaysia 43 2.16 Uncertainties of Climate Change on Hydrological
Modelling 44
2.17 Climate Projection Uncertainty 45
2.18 Studies of Climate Change Impacts on Streamflow
in Asia 48
2.19 Climate Change Impacts on Streamflow in
Malaysia 53
2.20 Summary of Literature Review 55
3 METHODOLOGY 58
3.1 Introduction 58
3.2 Study Area 58
3.2.1 Johor River Basin 59
ix
3.3 Satellite Data Sets 64
3.3.1 Digital Elevation Model 65
3.3.2 Satellite Precipitation Products 70 3.3.2.1 TRMM 3B42RT and 3B42V7 71
3.3.2.2 GPCP-1DD 72
3.3.2.3 PERSIANN-CDR 72
3.3.2.4 CMORPH 72
3.3.3 Satellite Land-use 73
3.4 Observed Data Sets 74
3.4.1 Climate Data 74
3.4.2 Soil Map 76
3.4.3 Streamflow Data 79
3.5 Digital Elevation Models Uncertainty Assessment 80 3.5.1 Vertical Accuracy Assessment of Digital
Elevation Models 80
3.5.2 Basin Delineation and River Network
Correction 81
3.6 Satellite Precipitation Products Validation 83 3.6.1 Statistical Analysis of Satellite Precipitation
Products 87
3.6.2 Bias Correction of Satellite Precipitation
Product 91
3.7 Soil and Water Assessment Tool 92
3.7.1 Theoretical Concepts of Soil and Water
Assessment Tool 93
3.7.2 Soil and Water Assessment Tool
Modification and Set Up 97 3.7.3 Soil and Water Assessment Tool Calibration 100 3.7.4 Soil and Water Assessment Tool Validation 101 3.8 Past Land-use and Climate Changes 103
3.9 Future Climate Projection 104
3.9.1 Download General Circulation Models and
3.9.2 General Circulation Models Downscaling 106 3.9.3 Modified QUEST-GSI Methodology 107
3.10 Streamflow Analysis 107
3.11 Summary 109
4 RESULTS AND DISCUSSION (SATELLITE
DATA UNCERTAINTIES ASSESSMENT) 110
4.1 Introduction 110
4.2 Vertical Accuracy Assessment of Digital Elevation
Models 110
4.3 DEM-based Basin Delineation and River Network
Correction 116
4.4 Validation of Satellite Precipitation Products 126
4.4.1 Annual Precipitation 126
4.4.2 Seasonal Precipitation 128
4.4.3 Monthly Precipitation 130
4.4.4 Daily Precipitation 132
4.5 Spatial Variability Assessment 133
4.6 Rain Detection Ability Assessment 135
4.7 Rain Intensity Assessment 137
4.8 2006/2007 Flood Event Assessment 141
4.9 Basin Assessment 143
4.10 Hydrological Modelling Assessment 146 4.11 Bias Correction of Satellite Precipitation Product 149
5 RESULTS AND DISCUSSION (LAND-USE AND
CLIMATE CHANGES ASSESSMENT) 152
5.1 Introduction 152
5.2 Soil and Water Assessment Tool Parameters
Sensitivity Analysis 152
5.3 Soil and Water Assessment Tool Calibration and
Validation 154
xi
5.4.1 Johor River Basin 157
5.4.2 Kelantan River Basin 164
5.5 Land-use Change Detection 172
5.6 Historical Land-use and Climate Change Impacts
on Streamflow 174
5.6.1 Impacts of Land-use Change (S2 vs S1) 174 5.6.2 Impacts of Climate Change (S3 vs S1) 178 5.6.3 Combined Impacts of Land-use and Climate
Change (S4 vs S1) 179
5.7 Modified QUEST-GSI Methodology 180
5.7.1 General Circulation Models Performance
Evaluation 180
5.7.2 Future Climate Projection 186 5.8 Impacts of Future Climate Change on Streamflow 194 5.9 Climate Projection Uncertainties Assessment 198
6 CONCLUSIONS AND RECOMMENDATIONS 204
6.1 Conclusions 204
6.1.1 Digital Elevation Model Uncertainties
Assessment 205
6.1.2 Satellite Precipitation Uncertainties
Assessment 205
6.1.3 Soil and Water Assessment Tool 206 6.1.4 Impacts of Historical Land-use and Climate
Change on Streamflow 207 6.1.5 Impacts and Uncertainties of Future Climate
Change on Streamflow 208
6.2 Recommendations for Future Work 209
REFERENCES 211
LIST OF TABLES
TABLE NO. TITLE PAGE
2.1 Popular hydrological models in climate change
impact assessment 24
2.2 Satellite imagery for land use mapping 32
2.3 CMIP5 General Circulation Models 40 2.4 Advantages and disadvantages of statistical and
dynamical downscaling 42
2.5 The QUEST-GSI methodology climate projection 46 2.6 Studies that employed the QUEST-GSI
methodology 47
2.7 Simulated streamflow historical (1984-1993) and future periods (2025-2034 and 2041-2050) at major
basins of Peninsular Malaysia 54
3.1 Total population by gender and household of Johor
River Basin, Malaysia 61
3.2 Total population by gender and household of
Kelantan River Basin, Malaysia 64
3.3 Basic information on SPPs used in this study 71
3.4 Details of climate stations 75
3.5 Soil information 77
3.6 Details of stream gauges 80
3.7 Thirty-eight principal rain gauges across Malaysia,
from the Malaysia Meteorological Department 85 3.8 Contingency table for comparing gauge and
xiii
3.9 Climate parameters in SWAT model 99
3.10 Soil parameters in SWAT model 100
3.11 Model performance rating guidelines 103
3.12 The modified QUEST-GSI scenarios 108
4.1 T-test statistical analysis of the GCPs elevation of topographic map and various DEMs scenarios
(significance level: 0.05) 116
4.2 DEMs vertical accuracy assessment studies 117 4.3 Student t test analysis between observed and
estimated precipitations 128
4.4 Statistical analysis of the annual, seasonal, monthly and daily precipitation (2003-2007) between
precipitation products and rain gauges 129 4.5 Overall rain-detection capability of each
precipitation products over Malaysia 136 4.6 Statistical analysis of SPPs with rain gauges for
2006/07 flood event at highly affected region from
December 2006 to January 2007 142
4.7 Statistical analysis of monthly rainfall between satellite precipitation products and rain gauges over the Kelantan River Basin and Johor River Basin
from 2003 to 2007 144
4.8 Statistical analysis between monthly observed and SWAT-simulated streamflow by satellite precipitation products (2003-2007) at Jam Guillemard (KRB) and Rantau Panjang (JRB)
stations 149
4.9 Statistical analysis of raw and corrected PERSIANN-CDR at the Jan Guillermard (KRB) and Rantau Panjang (JRB) stations from 2003 to
2007 150
5.1 Calibrated parameters for the SWAT model in JRB
5.2 Calibrated parameters for the SWAT model in
KRB (1: most sensitive) 154
5.3 Analysis of Mann-Kendall statistic (Z) and Sen’s slope (β) for annual and temperature precipitation
in JRB 163
5.4 Analysis of Mann-Kendall statistic (Z) and Sen’s slope (β) for annual precipitation and temperature
in KRB 171
5.5 Land-use changes JRB (1990 vs 2008) 173
xv
LIST OF FIGURES
FIGURE NO. TITLE PAGE
1.1 “Top down” framework for climate change
impact on hydrological cycle studies 5 2.1 Schematic view of the components of the climate
system, their processes and interactions 15 2.2 Mean changes of global (a) temperature and (b)
precipitation over the twenty-first century according to the ensembles mean CMIP5 GCMs
under RCP 8.5 scenario 16
2.3 The global hydrological storage and fluxes with
anthropogenic and natural cycles 18
2.4 Tropical hydrological cycle 21
2.5 Hydrological model classification 24
2.6 Reported application of hydrological models for assessing climate change impact between 2000
and 2014 25
2.7 Workflow of climate change streamflow impact
study 36
2.8 a) 2100 radiative forcing trend; (b) CO2 emission versus 2100 radiative forcing; and (c) greenhouse
gases level of 2100 radiative forcing 38 2.9 Relative changes of (a) mean flow, (b) high flow
and (c) low flow under RCP 8.5 scenario for the 2071-2100 period compared to baseline
2.10 Observed and projected changes in annual mean
temperature and precipitation over Asia 51 2.11 Annual and seasonal streamflow changes trend in
China (shaded area are dominated by decreasing
streamflow) 52
2.12 Simulated historical and future annual mean air
temperature of Peninsular Malaysia 55 2.13 Simulated historical and future annual mean
precipitation of Peninsular Malaysia 55
3.1 Johor River Basin 60
3.2 Kelantan River Basin 63
3.3 ASTER GDEM of the Johor River Basin 66
3.4 EarthEnv-DEM90 of the Johor River Basin 67
3.5 SRTM v4.1 of the Johor River Basin 67
3.6 ASTER GDEM of the Kelantan River Basin 68
3.7 EarthEnv-DEM90 of the Kelantan River Basin 69
3.8 SRTM v4.1 of the Kelantan River Basin 70
3.9 Soil map of the Johor River Basin 78
3.10 Soil map of the Kelantan River Basin 79
3.11 River network of the Johor River Basin 82
3.12 River network of the Kelantan River Basin 83 3.13 Distribution of rain gauges (MMD = Malaysia
Meteorological Department; DID = Department of Irrigation and Drainage Malaysia) and
topography of Malaysia 85
3.14 Schematic representation of the hydrological
cycle in SWAT 94
3.15 SWAT modelling procedure 97
4.1 GCPs well distributed over the Johor River Basin 112 4.2 GCPs well distributed over the Kelantan River
Basin 113
xvii 90m, and (c) EarthEnv-DEM90 90m in the Johor
River Basin 114
4.4 Scatter plot of GCPs elevation of topographic map vs (a) ASTER GDEM2 30m, (b) SRTM v4.1 90m, and (c) EarthEnv-DEM90 90m in the
Kelantan River Basin 115
4.5 Real, corrected and uncorrected river network for
the Johor River Basin 118
4.6 Real, corrected and uncorrected river networks for region (a) one, (b) two, (c) three, (d) four, (e)
five, and (f) six in the Johor River Basin 119 4.7 Real, corrected and uncorrected river network for
the Kelantan River Basin 122
4.8 Real, corrected and uncorrected river networks for region (a) one, (b) two, (c) three, (d) four, (e)
five, and (f) six in the Kelantan River Basin 123 4.9 Spatial distribution of average annual
precipitation for the period 2003-2007 estimated from (a) 3B42RT, (b) 3B42V7, (c) GPCP-1DD, (d) PERSIANN-CDR, (e) CMORPH, and (f) rain
gauges 127
4.10 Two-dimensional histogram of mean monthly precipitation between satellite precipitation products with the rain gauges for the period
2003–2007 131
4.11 Coefficient of determination (R2) of daily precipitation between rain gauges and (a) 3B42RT, (b) 3B42V7, (c) GPCP-1DD, (d) PERSIANN-CDR and (e) CMORPH over
Malaysia 134
PERSIANN-CDR and (e) CMORPH over
Malaysia 135
4.13 The probability of detection (POD) of daily precipitation between satellite precipitation
products and rain gauges over Malaysia 137 4.14 The occurrence probability distribution functions
(PDF) of daily precipitation (2003-07) aggregated from 342 rain gauges over (a)
Malaysia and (b-h) different regions of Malaysia 139 4.15 Comparison of daily precipitation series between
precipitation products and selected rain gauges (highly affected area) for the 2006/2007 flood
event 143
4.16 Monthly rainfall pattern between observed and satellite precipitation products at (a) station 48615, (b) 48616, (c) 48672 and (d) 48679 during
2003-2007 145
4.17 Monthly observed and SWAT-simulated streamflow by five satellite precipitation products at the (a) Jam Guillemard (KRB) and (b) Rantau Panjang (JRB) station between 2003 and
2007 148
4.18 Monthly streamflow of monthly observed against raw and corrected PERSIANN-CDR at (a) Jam Guillemard and (b) Rantau Panjang station for
the period of 2003 to 2007 151
5.1 Observed and simulated streamflowat Rantau
Panjang station 155
5.2 Observed and simulated streamflow at Jam
Guillemard station 155
5.3 (a) Annual precipitation and (b-d) temperature
xix 5.4 Monthly (a) precipitation and (b) temperature
changes at the 48672 station (1985-1998 vs
1999-2012) 159
5.5 Annual (a) precipitation and (b-d) temperature
changes at the 48679 station (1985-2012) 160 5.6 Annual precipitation and temperature changes at
the 48679 station (1985-2012) 161
5.7 Annual precipitation trend at various (a-h)
precipitation stations in JRB (1985-2012) 162 5.8 (a) annual precipitation and (b-d) temperature
changes at the 48616 station (1985-2012) 165 5.9 Monthly (a) precipitation and (b) temperature
changes at the 48616 station (1985-1998 vs
1999-2012) 166
5.10 Annual precipitation trend at various
precipitation stations in KRB (1985-2012) 167 5.11 Land use changes of the Johor River Basin (JRB)
and Kelantan River Basin (KRB) (1990 vs 2008) 173 5.12 Annual streamflow changes under land-use (S2),
climate (S3) and combined impact (S4) scenarios
in Johor River Basin 175
5.13 Annual streamflow changes under land-use (S2), climate (S3) and combined impact (S4) scenarios
in Kelantan River Basin 175
5.14 Annual streamflow changes under land-use (S2), climate (S3) and combined impact (S4) scenarios
in Johor River Basin for various (a-d) sub-basins 176 5.15 Annual streamflow changes under land-use (S2),
climate (S3) and combined impact (S4) scenarios
in Kelantan River Basin for various sub-basins 177 5.16 (a) NME and (b) NRMSE for annual
precipitation from 1985 to 2004 in JRB. The red
5.17 (a) NME and (b) NRMSE for annual precipitation from 1985 to 2004 in JRB. The red
dotted lines are the uncertainty bounds 183 5.18 (a) NME and (b) NRMSE for annual
precipitation from 1985 to 2004 in KRB. The red
dotted lines are the uncertainty bounds 184 5.19 (a) NME and (b) NRMSE for annual
precipitation from 1985 to 2004 in KRB. The red
dotted lines are the uncertainty bounds 185 5.20 Annual (a) precipitation, (b) maximum and (c)
minimum temperature changes of Ensemble_5 at Kluang station (48672) under three RCPs scenarios for the 2015-2034, 2045-2064 and
2075-2094. 188
5.21 Monthly (a) precipitation, (b) maximum and (c) minimum temperature changes of Ensemble_5 at Kluang station (48672) under three RCPs scenarios for the 2015-2034, 2045-2064 and
2075-2094 189
5.22 Annual (a) precipitation, (b) maximum and (c) minimum temperature changes of Ensemble_5 at Senai station (48679) under three RCPs scenarios
for the 2015-2034, 2045-2064 and 2075-2094 190 5.23 Monthly (a) precipitation, (b) maximum and (c)
minimum temperature changes of Ensemble_5 at Senai station (48679) under three RCPs scenarios
for the 2015-2034, 2045-2064 and 2075-2094 191 5.24 Annual (a) precipitation, (b) maximum and (c)
minimum temperature changes of Ensemble_5 at Kuala Krai station (48616) under three RCPs scenarios for the 2015-2034, 2045-2064 and
xxi 5.25 Monthly (a) precipitation, (b) maximum and (c)
minimum temperature changes of Ensemble_5 at Kuala Krai station (48616) under three RCPs scenarios for the 2015-2034, 2045-2064 and
2075-2094 193
5.26 (a) Annual and (b) monthly streamflow changes at Rantau Panjang station of Ensemble_5 under RCP 2.6, RCP 4.5 and RCP 8.5 for the periods of
2020s, 2050s and 2080s 196
5.27 a) Annual and (b) monthly streamflow changes at Jam Guillemard station of Ensemble_5 under RCP 2.6, RCP 4.5 and RCP 8.5 for the periods of
2020s, 2050s and 2080s 197
5.28 Changes of annual streamflow against the baseline at Rantau Panjang station for climate scenarios: (a) Prescribed temperature, (b) GCM
structure, and (c) 2oC increase in temperature 200 5.29 Changes of monthly streamflow against the
baseline at Rantau Panjang station for climate scenarios: (a) Prescribed temperature, (b) GCM
structure, and (c) 2oC increase in temperature 201 5.30 Changes of annual streamflow against the
baseline at Jam Guillemard station for climate scenarios: (a) Prescribed temperature, (b) GCM
structure, and (c) 2oC increase in temperature 202 5.31 Changes of monthly streamflow against the
baseline at Jam Guillemard station for climate scenarios: (a) Prescribed temperature, (b) GCM
LIST OF SYMBOLS
x
P
- Mean of the DEM elevationref
P
- Mean of reference elevation ( , )P x y - Precipitation different between the satellite and observed data at a
given point ( , )
S x y
P - Satellite precipitation at a specific location (x,y) ( , )
G x y
P - Gauge precipitation at a specific location (x,y) ( , )intx y
P - Spatially interpolated different map .
s corrected
P
- Satellite precipitation after correctiont
SW
- Final soil water contento
SW
- Initial soil water content on day iday
R - The amount of precipitation on day i
surf
Q - Amount of surface runoff on day i
a
E
- Amount of evapotranspiration on day iseep
w - Amount of water entering the vadose zone from the soil profile on day i
gw
Q - Amount of return flow on day i
surf
Q - Accumulated runoff or rainfall excess day
R - Rainfall depth for the day
a
I
- Initial abstraction which includes surface storage, interception and infiltration prior to runoffxxiii
,
inf t
f - Infiltration rate at time t
e
K
- Effective hydraulic conductivity wf
- Wetting front matric potentialv
- Change in volumetric moisture content across the wetting front,
inf t
F - Cumulative infiltration at time t
o
E
- Potential evapotranspiration - Latent heat of vaporization
o
H
- Extra-terrestrial radiationmx
T
- Maximum air temperature for a given daymn
T
- Minimum air temperature for a given day avT - Mean air temperature for a given day
ch
q
- Rate of flow in the channelch
A
- The cross-sectional area of flow in the channelch
R
- Hydraulic radius for a given depth of flowch
slp
- Slope along the channel lengthn
- Manning’s coefficient for the channelΔ
V
stored - Change in volume of storage during the time stepin
V
- Volume of inflow during the time stepout
V
- Volume of outflow during the time stepsin
q
- Inflow rateout
q
- Discharge rateK
- Storage time constant for the reachX
- Weighting factoro - Mean observed streamflow p - Mean simulated streamflow
,
delta daily
T - Delta downscaled daily temperature ,
obs daily
T - Observed daily temperature fut
bas
T - GCM average monthly temperature of the baseline period ,
delta daily
P - Delta downscaled daily precipitation ,
obs daily
P - Observed daily precipitation fut
P - GCM average monthly precipitation of the future period bas
P - GCM average monthly precipitation of the baseline period
' - Minute
'' - Second
% - Percentage
± - Plus-minus
° - Degree
A - Hits (event forecast to occur, and did occur)
ACC - Accuracy
B - False alarm (event forecast to occur, but did not occur) C - Misses (event forecast not to occur, but did occur) CH_K2 - Channel effective hydraulic conductivity
CH_N2 - Manning’s value for main channel CN2 - Initial SCS Curve Number II value CSI - Critical success index
D - Correct negative (event forecast not to occur but occur) Ensemble_5 - Ensemble of five selected GCMs
ESCO - Soil evaporation compensation factor FAR - False alarm ratio
G - Gauge precipitation
GHz - Gigahertz
GW_REVAP - Groundwater “revap” coefficient
GWQMN - Threshold water depth in the shallow aquifer for flow HSS - Heidke skill score
km - Kilometre
km2 - Square kilometre km3 - Cubic kilometre
km3/year - Cubic kilometre per year
xxv m.a.s.l - Above mean sea level
m3/day - Cubic metre per day m3s-1 - Meter cubic per second
ME - Mean error
MJkg-1 - Megajoules per kilogramme mm/day - Millimetre per day
mm/day - Millimeter per day mm/month - Milimetre per month mm/year - Millimetre per year
n - Number of gcps
NME - Normalize mean error
NRMSE - Normalize root mean square error NSE - Nash sucliffe efficiency
o - Observed streamflow
oC - Celsius
oN - North
oS - South
p - Simulated streamflow
PB - Percentage bias
POD - Probability of detection
Pref - Reference elevation (gcps from topographic map)
Px - DEM elevation
R2 - Coefficient of determination
RB - Relative bias
REVAP_MN - Threshold depth of water in the shallow aquifer for “revap” to occur
RMSE - Root mean square error
RSR - Ratio of root mean square error S - Satellite precipitation
SB - Sub-basin
SOL_AWC - Available water capacity
t - Time
xxvii
LIST OF ABBREVIATIONS
3D - Three dimensional
ACCESS1-0 - Australia Community Climate and Earth System Simulator, version 1
AMJ - April, May and Jun
ANION_EXCL - Fraction of porosity (void space) from which anions are excluded
AOGCMs - Atmospheric-ocean general circulation models
APHRODITE - Asian Precipitation Highly Resolved Observational Data Integration Towards the Evaluation of Water Resources
AR4 - Assessment Report 4
AR5 - Assessment Report 5
ASTER - Advanced Spaceborne Thermal Emission and Reflection Radiometer
AVHRR - Advanced Very High Resolution Radiometer
BCC-CSM1-1 - Beijing Climate Centre Climate System Model, version 1.1 BNU-ESM - Beijing Normal University, Earth System Model
CanESM2 - Canadian Earth System Model, version 2 Cat-PDM - Probability Distributed Model
CCCma - Canadian Centre for Climate Modelling and Analysis CCSM3 - Community Climate System Model, version 3
CCSM4 - Community Climate System Model, version 4 CESM1-
CAM5
- Community Earth System Model- Community Atmosphere Model
CGIAR-CSI - Consortium for Spatial Information of the Consultative Group of International Agriculture Research
CLAY1 - Clay content of the first layer of soil
CMIP 3 - Coupled Model Intercomparison Project Phase 3 CMIP 5 - Coupled Model Intercomparison Project Phase 5 CMORPH - Climate Prediction Center Morphing Technique
CN - Curve Number
CNES - Centre national d'études spatiales – the French space agency CNRM-CM5 - Centre National de Recherches Meteorologiques- Coupled
Global Climate Model, version 5 CRU-TS - Climatic Research Unit- Time series CSIRO-Mk3-
6-0
- Commonwealth Scientific and Industrial Research Organization- Mark Climate Model, version 3.6 CSIRO-Mk3.0 - Commonwealth Scientific and Industrial Research
Organization- Mark Climate Model, version 3.0. DEMs - Digital Elevation Models
DEWPT - Average daily few point temperature per month of the year in degree celcius
DID - Department Irrigation And Drainage EC-EARTH - European Centre Earth System Model EGM96 - Earth Gravitational Model 1996
EM - East Malaysia
EM-DAT - International Emergency Disasters Database
ENO - Environment and Organism
ET - Evapotranspiration
ETM+ - Enhanced Thematic Mapper Plus FELDA - Federal Land Development Authority
FGOALS-g2 - Flexible Global Ocean-Atmosphere-Land System model, Grid-point version 2
FRIM - Forest Research Institute Malaysia GCMs - General Circulation Models GCPs - Ground control points
xxix GDEM - Global Digital Elevation Model
GFDL-CM3 - Geophysical Fluid Dynamics Laboratory Coupled Model, version 3
GFDL-ESM 2M - Geophysical Fluid Dynamics Laboratory- Earth System Model, version 2
GHCN2 - modified version of Global Historical Climatology Network
GHG - Greenhouse Gas
GLSDEM - Global Land Survey Digital Elevation Model
GOES - Geostationary Operational Environmental Satellite system GPCC - Global Precipitation Climatology Center
GPCP - Global Precipitation Climatology Project GPCP-1DD - GPCP – one degree daily
GRA - Geographical Ratio Analysis
HadCM3 - Hadley Centre Coupled Model, version 3
HadGEM1 - Hadley Centre Global Environment Model, version 1 HadGEM2-ES - Hadley Centre Global Environment Model version 2 Earth
System
HBV - Hydrological Simulation Model
HeC-HMS - Hydrologic Engineering Center-Hydrologic Modeling System HESS - Hydrology and Earth System Sciences
HRUs - Hydrologic Response Units
HSPF - Hydrologic Simulation Package-Fortran HYDGRP - Soil hydrologic group
IDW - inverse distance weighting
INM-CM4 - Institute for Numerical Mathematics Climate Model, version 4
IPCC - Intergovernmental on Climate Change
IPSL-CM4 - Institut Pierre Simon Laplace- Climate Model, version 4. IPSL-CM5A-
MR
- Institut Pierre Simon Laplace- Coupled Model 5A- Medium Resolution.
IR - Thermal infrared
JAS - July, August and September JFM - January, February and March JPEG - Joint Photographic Experts Group
JRB - Johor River Basin
JUPEM - Jabatan Ukur dan Pemetaan Malaysia KEJORA - South East Johore Development Authority KINEROS - Kinematic Runoff and Erosion
KRB - Kelantan River Basin
LAI - Leaf Area Index
LAMs - Limited Area Models
LH-OAT - Latin hypercube sampling by one at a time design LULC - Land use land cover
MAE - Mean absolute error
MARDI - Malaysian Agriculture Research and Development Institute
ME - Mean error
METI - Ministry of Economy, Trade, and Industry of Japan MIKE-SHE - Mike- Système Hydrologique Européen
MIROC5 - Model for Interdisciplinary Research on Climate, version 5 MIROC-ESM - Model for Interdisciplinary Research on Climate- Earth
System Models
MMD - Malaysia Meteorological Department
MOA - Ministry of Agriculture and Agro-based Industry Malaysia MODIS - Moderate Resolution Imaging Spectroradiometer
MPI - Max Planck Institute for Meteorology
MRI-CGCM3 - Meteorological Research Institute- Coupled General Circulation Model, version 3
MSL - Mean sea level
MW - Microwave
NAHRIM - National Hydraulic Research Institute Malaysia NASA - National Aeronautics and Space Administration NCAR - National Center for Atmospheric Research
xxxi NCEP/NCAR - National Centers for Environment Prediction/National Center
for Atmospheric Research
NDVI - Normalized Difference Vegetation Index
NEM - Northeast monsoon
NIMA - National Imagery and Mapping Agency NLAYERS - Number of layers in the soil
NorESM1-M - Norwegian Climate Center’s Earth System Model OND - October, November and December
PCMDI - Program for Climate Model Diagnosis and Intercomparison PCPD - Average numbers of days of precipitation for each month PCPMM - Average total of monthly precipitation in millimeters PCPSKW - Skew coefficient for daily precipitation for each month PCPSTD - Standard deviation for daily precipitation in each month,
expressed as in mm of water per day PDF - Probability distribution function
PERSIANN - Precipitation Estimation from Remotely Sensed Information Using Artificial Neural Network
PERSIANN-CDR - Precipitation Estimation from Remotely Sensed Information Using Artificial Neural Network – Climate Data Record
PM - Peninsular Malaysia
PMW - Passive microwave
PR - Precipitation radar
PR_W1 - Probability of a wet day following a dry day for each month PR_W2 - Probability of a wet day following a wet day for each month PRMS - Precipitation Runoff Modelling System
PUB - Public Utility Board
QUEST-GSI - Quantifying and Understanding the Earth System – Global Scale Impacts
RAIN_YRS - Number of years of maximum monthly half hour rainfall data used to define values for averages per month of the year. RAINHHMX - Most extreme half-hour precipitation for each month
RB - Relative bias
RCP - Representative Concentration Pathway
RegHCM-PM - Regional Hydroclimate Model of Peninsular Malaysia RegHCM-SS - Regional Hydroclimate Model of Sabah and Sarawak ROCK1 - Rock fragment content of the first layer of soil
SAJ - Johor Water Company
SAND1 - Sand content of the first layer of soil SCS - Soil Conservation Services
SDSM - Statistical Downscaling Model SILT1 - Silt content of the first layer of soil
SLURP - Semi-distributed Land Use-based Runoff Processes SNSB - Swedish Natioanal Space Board
SOL_ALB1 - Moist soil albedo of the first layer of soil
SOL_AWC1 - Available water capacity of the first layer of soil SOL_BD1 - Moist bulk density of the first layer of soil
SOL_CAL1 - Calcium carbonate content of the first layer of soil SOL_CBN1 - Organic carbon content of the first layer of soil SOL_CRK - Crack volume potential of soil
SOL_EC1 - Soil electrical conductivity of the first layer of soil SOL_K1 - Saturated hydraulic conductivity of the first layer of soil SOL_PH1 - Soil PH of the first layer of soil
SOL_Z1 - Depth from soil surface to bottom of the first layer of soil SOL_ZMX - Maximum rooting depth of soil profile
SOLARAV - Average daily solar radiation for each month SPOT - Satellite Pour l'Observation de la Terre SPPs - Satellite Precipitation Products
SRES - Special Report on Emissions Scenarios
SRTM - National Aeronautics And Space Administration Shuttle Radar Topography Mission
SSTC - Technical and cultural services SUFI-2 - Sequential Uncertainty Fitting SWAT - Soil and Water Assessment Tool
SWAT-CUP - SWAT Calibration And Uncertainty Procedures
xxxiii
TCI - TRMM Combined Instrument
TEXTURE - Texture of soil layer
TMI - TRMM Microwave Imager
TMPA - TRMM Multi-satellite Precipitation Analysis TMPI - Threshold-matched precipitation index
TMPMN - Average daily maximum air temperature for each month in degrees celsius
TMPMX - Average daily maximum air temperature for each month in degrees celsius
TMPSTDMN - Standard deviation for daily minimum air temperature for each month in degrees celcius
TMPSTDMX - Standard deviation for daily maximum air temperature for each month in degrees Celsius
TOPMODEL - Topography Based Hydrological Model TRMM - Tropical Rainfall Measuring Mission UBC - University Of British Columbia Model UKMO - United Kingdom Meteorological Office UNEP - United Nations Environment Program
UNISDR - United Nations International Strategy for Disaster Reduction USA - Unite States of America
USD - United States Dollar
USDA - United States Department of Agriculture USGS - United States Geological Survey
USLE_K1 - USLE equation soil erodibility (K) factor of the first layer of soil
VIC - Variable Infiltration Capacity
VIS - Visible
WCRP - World Climate Research Programme
WELEV - Elevation of the weather station in meters above mean sea level
WGN - Weather generator
xxxv
LIST OF APPENDICES
APPENDIX TITLE PAGE
A Monthly SWAT-simulated streamflow (m3s-1) at various sub-basins in Johor River Basin under RCP
2.6 scenario from 2015 to 2034 238
B Monthly SWAT-simulated streamflow (m3s-1) at various sub-basins in Johor River Basin under RCP
2.6 scenario from 2045 to 2064 242
C Monthly SWAT-simulated streamflow (m3s-1) at various sub-basins in Johor River Basin under RCP
2.6 scenario from 2075 to 2094 246
D Monthly SWAT-simulated streamflow (m3s-1) at various sub-basins in Johor River Basin under RCP
4.5 scenario from 2015 to 2034 250
E Monthly SWAT-simulated streamflow (m3s-1) at various sub-basins in Johor River Basin under RCP
4.5 scenario from 2045 to 2064 254
F Monthly SWAT-simulated streamflow (m3s-1) at various sub-basins in Johor River Basin under RCP
4.5 scenario from 2075 to 2094 258
G Monthly SWAT-simulated streamflow (m3s-1) at various sub-basins in Johor River Basin under RCP
8.5 scenario from 2015 to 2034 262
H Monthly SWAT-simulated streamflow (m3s-1) at various sub-basins in Johor River Basin under RCP
I Monthly SWAT-simulated streamflow (m3s-1) at various sub-basins in Johor River Basin under RCP
8.5 scenario from 2075 to 2094 270
J Monthly SWAT-simulated streamflow (m3s-1) at various sub-basins in Kelantan River Basin under
RCP 2.6 scenario from 2015 to 2034 274
K Monthly SWAT-simulated streamflow (m3s-1) at various sub-basins in Kelantan River Basin under
RCP 2.6 scenario from 2045 to 2064 278
L Monthly SWAT-simulated streamflow (m3s-1) at various sub-basins in Kelantan River Basin under
RCP 2.6 scenario from 2075 to 2094 282
M Monthly SWAT-simulated streamflow (m3s-1) at various sub-basins in Kelantan River Basin under
RCP 4.5 scenario from 2015 to 2034 286
N Monthly SWAT-simulated streamflow (m3s-1) at various sub-basins in Kelantan River Basin under
RCP 4.5 scenario from 2045 to 2064 290
O Monthly SWAT-simulated streamflow (m3s-1) at various sub-basins in Kelantan River Basin under
RCP 4.5 scenario from 2075 to 2094 294
P Monthly SWAT-simulated streamflow (m3s-1) at various sub-basins in Johor River Basin under RCP
8.5 scenario from 2015 to 2034 298
Q Monthly SWAT-simulated streamflow (m3s-1) at various sub-basins in Kelantan River Basin under
RCP 8.5 scenario from 2045 to 2064 302
R Monthly SWAT-simulated streamflow (m3s-1) at various sub-basins in Kelantan River Basin under
RCP 8.5 scenario from 2075 to 2094 306
CHAPTER 1
INTRODUCTION
1.1 Background of Study
Water is crucial for human survival. The distribution of fresh water in our planet is about 2.5% of the total amount of water, of this 68.6% is deposited in glaciers and ice caps, 30.1% in ground water and only 1.3% is found in surface water bodies such as swamps, rivers and lakes (Gleick, 1993). Surface water exists in very small amounts and is exposed to many threats caused by human activities including deforestation, pollution and climate change (e.g. Tu et al., 2015; Wang et al., 2015). Water resources are affected by global change, for example water demand increases due to population growth and water availability imbalance owing to climate and land use changes.
type (Kirkby et al., 2002; Price, 2011). Streamflow serves an important role in drinking water, hydropower, transportation, agriculture and the industrial sector.
Nevertheless, streamflow also brings some negative implications for society and environment such as flood and drought events (Hannaford, 2015). Based on the EM-DAT International Disaster Database, flood events from 1900 to 2014 have caused about 7 million deaths, with 3.6 billion people affected and 670 billion USD damage (http://www.emdat.be/database, accessed on 17 December 2014). Most of the severe cases occurred in tropical developing countries (UNISDR, 2011). During the December 2014 to January 2015, the monsoon flood in Malaysia affected more than 230,000 people, caused 23 deaths and cost 560 million USD damage.
Streamflow information is necessary for most of the water resources management projects (Seyam and Othman, 2015). Time series of streamflow record is crucial for flood forecasting, climate change assessment, water quality evaluation and aquatic habitat simulation (Smith and Pavelsky, 2008; Bourdin et al., 2012; Ravazzani et al., 2015). Better streamflow prediction and forecasting gives multiple benefits such as better water use management through anticipation of river inflow, improved capability in flood forecasting and monitoring as well as a better understanding of river water dynamics for hydropower planning (Barrett et al., 2008). However, the availability and scarcity of in-situ streamflow measurements remain a critical issue in many developing countries. In many river basins, lack of data often hampers the judicious management of water resources (Hirpa et al., 2013).
3
imagery to provide land use information for hydrological modelling (Rango, 1994; Pietroniro and Leconte, 2005).
Generally, the application of remote sensing in hydrology can be divided into three main classes including: (1) the delineation of known water features such as lakes and rivers; (2) estimating information like geological features or land use through classification and interpretation of satellite imagery; (3) the retrieval of hydrological parameters such as precipitation, evaporation, soil moisture and a digital elevation model directly from satellite imagery (Pietroniro and Leconte, 2000; Pietroniro and Prowse, 2002). Compared to the in-situ measurements by point-based gauge stations, the benefits of remote sensing to hydrology include the provision of spatial data of the area of interest, long term and global information for remote or inaccessible areas (Engman, 1996; Ritchie and Rango, 1996; Silvestro et al., 2015). However, the uncertainties of satellite data in hydrological modelling and calibration of a hydrological model using satellite data are challenging topics, which are main focuses of this study.
Digital Elevation Models (DEMs) are one of the most important spatial input datasets in hydrological modelling (Wu et al., 2008; Bourdin et al., 2012). DEMs constitute a key spatial layer for estimating a watershed’s channel networks, slope gradients, flow direction and accumulations, and several other controls of the water movements in landscapes (Moore et al., 1991; Wechsler, 2007). While the lack of DEM availability was an important issue a decade ago, this problem has largely been solved due to the widespread availability of global remotely sensed DEM products (Lin et al., 2013) such as from the Advanced Space-borne Thermal Emission and Reflection Radiometer (ASTER) and the Shuttle Radar Topography Mission (SRTM). However, the selection of appropriate products for hydrological applications remains an important issue.
Land use change is likely to impact the water resources availability and hydrological cycle by modification in infiltration rate, interception and evapotranspiration (Chawla and Mujumdar, 2015). A multitude of natural factors such as seasonal variations in land cover characteristics and natural maturation of forest can lead to changes in land use (Öztürk et al., 2013). Besides that, anthropogenic factors include deforestation, urbanization, agriculture activities, and forest management practices would also change the land use pattern. Recently, many researchers have evaluated the relationship between hydrological cycle components and land use changes (Li et al., 2015; Mateus et al., 2015; Nazir et al., 2015; Soulis et al., 2015).
5
The Fifth Assessment Report of the Intergovernmental Panel on Climate Change (IPCC-AR5) chapter three - the most up-to-date scientific assessment of past, present and potential future climate on freshwater resources - reported that water-related hazards such as river floods and droughts are expected to increase significantly with increasing precipitation and temperature (Jiménez Cisneros et al., 2014). Hence, the potential of land use and climate change impacts on the hydrological cycle have received attention from numerous researchers in different regions of the world (Maurer et al., 2009; Tsai and Huang, 2011; Wang et al., 2012; Dessu and Melesse, 2013; Ficklin et al., 2013a; Khoi and Suetsugi, 2014a; Gao et al., 2015).
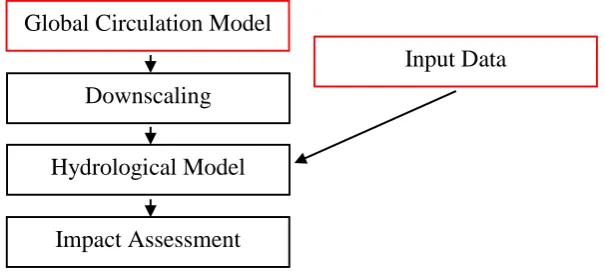
Generally, most of the hydro-climatic impact assessment studies adopt a “top down” framework by applying downscaled projected climate data of General Circulation Models (GCMs) into a calibrated hydrological model (Maurer et al., 2009; Taye et al., 2011) (Figure 1.1). Each component of the “top down” framework (Figure 1.1) contains a degree of uncertainty which leads to changes in the measured impact response (Wilby et al., 2009). Hence, each component’s uncertainties need to be quantified in order to provide robust impact information (Wilby et al., 2008).
Figure 1.1 “Top down” framework for climate change impact on hydrological cycle studies (red colour boxes are components that are addressed in this study)
Global Circulation Model
Downscaling Hydrological Model
Impact Assessment
The selected hydrological model, the Soil and Water Assessment Tool (SWAT) is one of the most popular models. It was developed by the United States Department of Agriculture (USDA) to evaluate the impact of agriculture management on water at a basin scale (Arnold et al., 1998). SWAT has proved to be a reliable tool for studying climate change impact on streamflow around the world (Zeng et al., 2012; Kankam-Yeboah et al., 2013; Le et al., 2015; Mehdi et al., 2015; Serpa et al., 2015; Uniyal et al., 2015). There are relatively few studies which have applied SWAT to simulate streamflow in Malaysia.
1.2 Statement of the Problem
With the development of remote sensing and computer systems, the traditional basin delineation approaches are now rapidly being replaced by automatic approaches. For example, DEM-based basin delineation gives advantages such as cost saving, efficient and faster processing. However, such an approach might lead to sub-basins and river networks mismatch issues, especially in a plain polder area (Luo et al., 2011). Therefore, an improved DEM-based basin delineation and river network correction approach is required to impove modelling of streamflow with the realistic hydrological process.
7
Studies about the evaluation of SPPs in Malaysia appear to be limited. Varikoden et al. (2010) evaluated the daily precipitation from TRMM 3B42V6 data in Peninsular Malaysia, which covers only about 40% of the total area of Malaysia, using for validation only four precipitation gauges. Semire et al. (2012) validated the TRMM Microwave Imager (TMI) 2A12, 3B42V6, 3B43V6, and Global Precipitation Climatology Center (GPCC) with the monthly precipitation data collected over 10 years (2001–2010) from 22 precipitation gauges distributed over Malaysia. Both studies showed that 3B43V6 performs well over Malaysia, with a ±15% error bias at monthly scale. However, these studies have compared only one or two SPPs, thus limiting their conclusions. There are several other available SPPs that need to be tested such as the Global Precipitation Climatology Project (GPCP), Precipitation Estimation from Remotely Sensed Information Using Artificial Neural Network (PERSIANN), and Climate Prediction Center Morphing Technique (CMORPH). Moreover, the accuracy assessment of these products is also required at daily time steps.
The climate projection uncertainty assessment is a quantification of the feasible threshold of future hydro-climatic conditions (Dessu and Melesse, 2013). The Quantifying and Understanding the Earth System – Global Scale Impacts (QUEST-GSI) methodology developed by Todd et al. (2011) is an advanced method involving the unification of climate impacts and uncertainties scenarios for better comparison between different study areas and applying prescribed warming scenarios to advice mitigation policy. However, the QUEST-GSI methodology applied previous GCMs from the phase 3 Couples Model Intercomparison Project (CMIP3) and emission scenarios from the Special Report on Emission Scenarios (SRES). Hence, modification of the QUEST-GSI methodology is essential to fit with the latest climate research development.
awareness. Shaaban et al. (2012) have evaluated impacts of climate change on several major basins of Peninsular Malaysia for the 2025 to 2034 and 2041 to 2050 periods by using the Canadian Centre for Climate Modelling and Analysis (CCCma) under the IS92a emission scenario. However, the application of the latest emission scenarios (Moss et al., 2010) and multiple GCMs assessment (Palmer et al., 2008) is very important to reflect more robust impact analysis. In this study, the latest CMIP5 GCMs and emission scenarios released by the IPCC in 2014 were used, and the missing “end of the century” assessment was included.
Most of the studies were concerned with the changes of a single factor, i.e. either climate changes (Shaaban et al. 2011) or land-use changes (Amini et al. 2011). Adnan and Atkinson (2011) considered both impacts of land-use and climate changes in Malaysia by using a statistical analysis approach. The study was conducted in northeast Peninsular Malaysia and they found an increasing trend of streamflow and precipitation during the wet season. However, no hydrological modelling impact studies that consider both factors (land-use and climate) have been performed in other part of Peninsular Malaysia. This study aims to fill this research gap.
9
1.3 Research Questions
1. Which digital elevation model is suitable for SWAT modelling?
2. Which satellite precipitation product is suitable for providing rainfall information for hydro-climatic assessment?
3. What is the performance of the SWAT model in Malaysia?
4. To what extent were land use and climate changes influencing the streamflow? 5. How much change will there be in future streamflow under climate change
impacts?
1.4 Objectives of the Study
The aim of this study is to explore and quantify the variability of climate change on streamflow variability. The specific objectives are outlined as follows:
1. To quantify the uncertainties of digital elevation models.
2. To evaluate and reduce the uncertainties of satellite precipitation products. 3. To modify the Soil and Water Assessment Tool (SWAT) for streamflow
simulation in Malaysia.
4. To investigate the impacts of historical land-use and climate change on streamflow.
1.5 Scope of the Study
The scope of this study can be divided into two parts. The first part involves the development of a SWAT model for the JRB. The input data sets are DEM, SPP, observed climate data (1985 to 2012), observed streamflow data (1985 to 2012), land use map and soil map. The SPP, land use map and DEM were generated from satellite data, while the observed climate, streamflow and soil map were collected from the relevant government agencies. The Latin hypercube sampling by one at a time design (LH-OAT) developed by Van Griensven et al. (2006) was used to perform sensitivity analysis and calibration procedure. It is an automatic sensitivity analysis embedded in the SWAT-CUP tool.
The second part was focused on the climate projection uncertainty analysis by using the modified QUEST-GSI methodology. The methodology was modified by incorporating the latest GCMs from the Phase 5 Coupled Model Intercomparison Project (CMIP5) and the Representative Concentration Pathways (RCPs) 2.6, 4.5 and 8.5 which represent low, medium and high emission scenarios, respectively.
11
1.6 Significance of the Study
In hydrology, the DEM plays a vital role in providing the basin’s topography information including channel network, slope and flow direction. Due to rigorous spatial data policies in most countries, many researchers prefer to choose public domain DEM products. Nowadays, there are many satellite sensors capable of producing DEMs and this will lead to difficulties for hydrologists to choose an appropriate DEM for their work. This study can be used by hydrologists to choose the best DEM for their study prior to the development of the hydrological modelling. Besides that, an improved DEM-based basin delineation and river network correction approach was introduced to correct the river network formation in SWAT model.
Precipitation is an important input of water in the hydrological cycle; hence, accurate and reliable precipitation information is therefore necessary to ensure better water resources management and decision-making. SPPs are widely accepted as an alternative source to overcome the limitation of ground techniques. This study presents a more comprehensive evaluation across Malaysia than was previously available in term of the number of gauge stations, evaluated satellite products, and the evaluated aspects (rainfall intensity analysis and flood event assessment). Moreover, this study presents the first attempt to evaluate the uncertainty and rain-detection ability of each of the SPPs over Malaysia. This study can be a guide on the selection of better precipitation products and bias correction of the selected product over Malaysia for hydrological modelling.
Application of the SWAT model in hydrological cycle simulation is still limited in Malaysia. This study presents the first attempt to evaluate the applicability of SWAT in the Johor River Basin (JRB) and Kelantan River Basin (KRB). The modified SWAT model can reasonably represent better streamflow simulation of the studied basins in Malaysia. Besides that, the SWAT’s calibrated parameters of both basins can act as a reference for researchers or water resources managers to calibrate the SWAT model in tropical regions.
Building on current scientific knowledge, this study investigates the potential of climate changes on streamflow characteristics, and the associated uncertainties in the climate projection. The modified QUEST-GSI methodology is the most comprehensive and up-to-date climate scenario that is designed particularly for the quantification of climate projection uncertainty on streamflow simulation. This methodology has contributed to new theoretical and knowledge on how to better quantify the future climate projection uncertainties. This methodology is not only applicable for the evaluation on hydrological modelling, but also other applications such as environmental and ecological modelling.
13
1.7 Structure of Thesis
This thesis consists of six chapters. The first chapter presents the background of the study, statement of the problem, study objectives, scope of the study and the structure of thesis. Chaper two presents a review of the hydrological cycle, hydrological modelling, remote sensing in hydrological modelling, DEM uncertainty assessment, satellite precipitation uncertainty assessment, land-use change and hydrological modelling, climate change and hydrological modelling, GCMs, downscaling of GCMs, uncertainties of climate change, studies of climate change impacts on streamflow in Asia and Malaysia.
Chapter three presents the research methodology for this study, the selected study area, essential data sets, satellite data processing and validation, SWAT model modification and set up, historical land-use and climate change analaysis, modification of the QUEST-GSI methodology and application of the modified QUEST-GSI methodology in the calibrated SWAT.
to simulate more the tropical hydrological cycle reliably, in order to gain better simulation results.
(d) More climate scenarios should be established to understand better the range of climate impacts on streamflow. In addition, the modified QUEST-GSI methodology should be applied to other regions to check its capability.
REFERENCES
Abbaspour, K. C. (2012). SWAT-CUP 2012: SWAT Calibration and Uncertainty Programs - A User Manual. Switzerland: Swiss Federal Institute Aquatic Science and Technology.
Abbaspour, K. C., Van Genuchten, M. T., Schulin, R., and Schlappi, E. (1997). A Sequential Uncertainty Domain Inverse Procedure for Estimating Subsurface Flow and Transport Parameters. Water Resour. Res. 33(8), 1879-1892.
Abbaspour, K. C., Yang, J., Maximov, I., Siber, R., Bogner, K., Mieleitner, J., Zobrist, J., and Srinivasan, R. (2007). Modelling Hydrology and Water Quality in the Pre-Alpine/Alpine Thur Watershed using SWAT. J. Hydrol. 333(2-4), 413-430. Acker, J. G., and Leptoukh, G. (2007). Online Analysis Enhances Use of NASA Earth
Science Data. EOS, Trans. Am. Geophys. Union. 88(2), 14-17.
Adnan, N. A., and Atkinson, P. M. (2011). Exploring the Impact of Climate and Land Use Changes on Streamflow Trends in a Monsoon Catchment. Int. J. Climat. 31(6), 815-831.
Aich, V., Liersch, S., Vetter, T., Huang, S., Tecklenburg, J., Hoffmann, P., Koch, H., Fournet, S., Krysanova, V., M Ller, E. N., and Hattermann, F. F. (2014). Comparing Impacts of Climate Change on Streamflow in Four Large African River Basins. Hydrol. Earth Syst. Sci. 18(4), 1305-1321
Alansi, A. W., Amin, M. S. M., Halim, G. A., Shafri, H. Z. M., Thamer, A. M., Waleed, A. R. M., Aimrun, W., and Ezrin, M. H. (2009). The Effect of Development and Land Use Change on Rainfall-Runoff and Runoff-Sediment Relationships Under Humid Tropical Condition: Case Study of Bernam Watershed Malaysia. Eur. J. of Sci. Res. 31(1), 88-105.
Malaysia, Based on Dynamically-Downscaled GCM Projections Using a Regional Hydroclimate Model. J. Hydrol. Eng. DOI: 10.1061/(ASCE)HE.1943-5584.0001242.
Amini, A., Ali, T. M., Ghazali, A. H. B., Aziz, A. A. and Akib, S. M. (2011). Impacts of Land-Use Change on Streamflows in the Damansara Watershed, Malaysia. Arab. J. Sci. Eng. 36(5), 713-720.
Anderson, J. R., Hardy, E. E., Roach, J. T., and Re, W. (1976). A Land Use and Land Cover Classification System for Use with Remote Sensor Data. United States Geological Survey, Washingston, United States.
Apip, Takara, K., Yamashiki, Y., Sassa, K., Ibrahim, A. B., and Fukuoka, H. (2010). A Distributed Hydrological-Geotechnical Model using Satellite-Derived Rainfall Estimates for Shallow Landslide Prediction System at A Catchment Scale. Landslides. 7(3), 237-258.
Apsite, E., Bakute, A., Elferts, D., Kurpniece, L., and Pallo, I. (2011). Climate Change Impacts on River Runoff in Latvia. Clim. Res. 48(1), 57-71.
Arnell, N. W. (2011). Uncertainty in the Relationship between Climate Forcing and Hydrological Response in UK Catchments. Hydrol. Earth Syst. Sci. 15(5), 897-912.
Arnold, J. G., Moriasi, D. N., Gassman, P. W., Abbaspour, K. C., White, M. J., Srinivasan, R., Santhi, C., Harmel, R. D., Van Griensven, A., Van Liew, M. W., Kannan, N., and Jha, M. K. (2012). SWAT: Model Use, Calibration, and Validation. Trans. ASABE. 55(4), 1491-1508.
Arnold, J. G., Srinivasan, R., Muttiah, R. S., and Williams, J. R. (1998). Large Area Hydrologic Modeling and Assessment - Part 1: Model Development. J. Am. Water Resour. As. 34(1), 73-89.
Asadullah, A. M., Butts, M., Glennie, P., Lindgaard-J Rgens, P., Madsen, H., and Riegels, N. (2012). Water Resources Climate Change: Guidelines. Denmark: DHI Water and Environment.
213
Athmania, D., and Achour, H. (2014). External Validation of the ASTER GDEM2, GMTED2010 and CGIAR-CSI-SRTM v4.1 Free Access Digital Elevation Models (DEMs) in Tunisia and Algeria. Remote Sens. 6(5), 4600-4620. Awadalla, S., and Noor, I. M. (1991). Induced Climate Change on Surface Runoff in
Kelantan Malaysia: A Preliminary Assessment. Int. J. Water Resour. D. 7(1), 53-59.
Babar, S., and Ramesh, H. (2015). Streamflow Response to Land Use-Land Cover Change over the Nethravathi River Basin, India. J. Hydrol. Eng. 20(10), 05015002.
Bajracharya, S. R., Palash, W., Shrestha, M. S., Khadgi, V. R., Duo, C., Das, P. J., and Dorji, C. (2015). Systematic Evaluation of Satellite-Based Rainfall Products over the Brahmaputra Basin for Hydrological Applications. Adv. Meteorol. 2015, 398587.
Barnett, T., Malone, R., Pennell, W., Stammer, D., Semtner, B., and Washington, W. (2004). The Effects of Climate Change on Water Resources in the West: Introduction and Overview. Climatic Change. 62(1-3), 1-11.
Barrett, D. J., Kuzmin, V. A., Walker, J. P., McVicar, T. R., and Draper, C. (2008). Improving Stream Flow Forecasting by Integrating Satellite Observations, In
Situ Data and Catchment Models using Model-Data Assimilation Methods. eWater Cooperative Research Centre, Australia.
Barrett, E. C. (1993). Precipitation Measurement by Satellites: Towards Community Algorithms. Adv. Space Res. 13(5), 119-136.
Bates, B. C., Kundzewicz, Z. W., Wu, S., and Palutikof, J. P. (2008). Climate Change and Water. Technical Paper of the Intergovernmental Panel on Climate
Change. Geneva: IPCC Secretariat.
Becker, A., Schneider, U., Meyer-Christoffer, A., Ziese, M., Finger, P., Stender, P., Heller, A., and Breidenbach, J. N. (2011). GPCC Report for Years 2009 and 2010. Global Precipitation Climatology Centre, Deutscher Wetterdienst, Offenbach, Germany.
Beighley, R. E., Ray, R. L., He, Y., Lee, H., Schaller, L., Andreadis, K. M., Durand, M., Alsdorf, D. E., and Shum, C. K. (2011). Comparing Satellite Derived Precipitation Datasets using the Hillslope River Routing (HRR) Model in the Congo River Basin. Hydrol. Process. 25(20), 3216-3229.
Berezowski, T., Chormański, J., Batelaan, O., Canters, F., and Van de Voorde, T. (2012). Impact of Remotely Sensed Land-Cover Proportions on Urban Runoff Prediction. Int. J. of Appl. Earth Obs. and Geoinf. 16, 54-65.
Bieger, K., Hormann, G., and Fohrer, N. (2015). The Impact of Land Use Change in The Xiangxi Catchment (China) on Water Balance and Sediment Transport. Reg. Environ. Change. 15(3), 485-498.
Bjerklie, D. M., Lawrence Dingman, S., Vorosmarty, C. J., Bolster, C. H., and Congalton, R. G. (2003) Evaluating the Potential for Measuring River Discharge from Space. J. Hydrol. 278(1–4), 17-38.
Bonan, G. (1997). Effects of Land Use on the Climate of the United States. Climatic Change. 37(3), 449-486.
Bourdin, D. R., Fleming, S. W., and Stull, R. B. (2012). Streamflow Modelling: A Primer on Applications, Approaches and Challenges. Atmos. Ocean. 50(4), 507-536.
Brakenridge, G. R., Nghiem, S. V., Anderson, E., and Chien, S. (2005). Space-Based Measurement of River Runoff. EOS, Trans. Am. Geophys. Union. 86(19), 185-188.
Brown, A. E., Western, A. W., Mcmahon, T. A., and Zhang, L. (2013). Impact of Forest Cover Changes on Annual Streamflow and Flow Duration Curves. J. Hydrol. 483(0), 39-50.
Casse, C., Gosset, M., Peugeot, C., Pedinotti, V., Boone, A., Tanimoun, B. A., and Decharme, B. (2015). Potential of Satellite Rainfall Products to Predict Niger River Flood Eventsi Niamey. Atmos. Res. 163, 162-176.
Chang, C., Wang, Z., Macbride, J., and Liu, C.H. (2005). Annual Cycle of Southeast Asia Maritime Continent Rainfall and the Asymmetric Monsoon Transition. J. Climate. 18(2), 287-301.
215
Derivation of Digital Elevation Models in Relation To Landform Types and Data Density. Geomorphology. 77(1–2), 126-141.
Chawla, I., and Mujumdar, P. P. (2015). Isolating the Impacts of Land Use and Climate Change on Streamflow. Hydrol. Earth Syst. Sci. Discuss. 12(2), 2201-2242. Cheema, M. J. M. and Bastiaanssen, W. G. M. (2012) Local Calibration of Remotely
Sensed Rainfall from the TRMM Satellite for Different Periods and Spatial Scales in the Indus Basin. Int. J. Remote Sens. 33(8), 2603-2627.
Chen, J. X., Xia, J., Zhao, C. S., Zhang, S. F., Fu, G. B., and Ning, L. K. (2014). The Mechanism and Scenarios of How Mean Annual Runoff Varies with Climate Change In Asian Monsoon Areas. J. Hydrol. 517, 595-606.
Chien, H., Yeh, P. J. F., and Knouft, J. H. (2013). Modeling the Potential Impacts of Climate Change on Streamflow in Agricultural Watersheds of the Midwestern United States. J. Hydrol. 491, 73-88.
Chiu, L. S., Liu, Z., Vongsaard, J., Morain, S., Budge, A., Neville, P., and Bales, C. (2006). Comparison of TRMM and Water District Rain Rates over New Mexico. Adv. Atmos. Sci. 23(1), 1-13.
Chow V.T. Open Channel Hydraulics, New York: Mcgraw-Hill. 1959.
Congalton, R. G. (2010) Remote Sensing: An Overview. Gisci. Remote Sens. 47(4), 443-459.
Department of Statistics, Malaysia. (2010). Population Distribution and Basic Demographic Characteristics 2010. Malaysia: Department of Statistics Malaysia
Derin, Y., and Yilmaz, K. K. (2014). Evaluation of Multiple Satellite-Based Precipitation Products over Complex Topography. J. Hydrometeorol. 15(4), 1498-1516.
Dinku, T., Chidzambwa, S., Ceccato, P., Connor, S. J., and Ropelewski, C. F. (2008). Validation of High‐Resolution Satellite Rainfall Products over Complex Terrain. Int. Remote Sens. 29(14), 4097-4110.
Duan, Z., and Bastiaanssen, W. G. M. (2013). First Results from Version 7 TRMM 3B43 Precipitation Product in Combination with a New Downscaling– Calibration Procedure. Remote Sens. Environ. 131(0), 1-13.
Fan, J., Tian, F., Yang, Y. H., Han, S. M., and Qiu, G. Y. (2010). Quantifying the Magnitude of the Impact of Climate Change and Human Activity on Runoff Decline in Mian River Basin, China. Water Sci. Technol. 62(4), 783-791. Feidas, H. (2010). Validation of Satellite Rainfall Products Over Greece. Theor. Appl.
Climatol. 99(1-2), 193-216.
Ficklin, D. L., Stewart, I. T., and Maurer, E. P. (2013a). Climate Change Impacts On Streamflow And Subbasin-Scale Hydrology In The Upper Colorado River Basin. Plos One, 8(8), e71297.
Ficklin, D. L., Stewart, I. T., and Maurer, E. P. (2013b). Effects of Projected Climate Change on the Hydrology in the Mono Lake Basin, California. Climatic Change, 116(1), 111-131.
Ficklin, D. L., Luo, Y. Z., and Zhang, M. H. (2013c). Climate Change Sensitivity Assessment of Streamflow and Agricultural Pollutant Transport in California's Central Valley using Latin Hypercube Sampling. Hydrol. Process. 27(18), 2666-2675.
Fowler, H. J., Blenkinsop, S., and Tebaldi, C. (2007). Linking Climate Change Modelling to Impacts Studies: Recent Advances in Downscaling Techniques for Hydrological Modelling. Int. J. Climatol. 27(12), 1547-1578.
Fuchs, T., Schneider, U., Meyer-Christoffer, A., Finger, P., Breidenbach, J. N., Heller, A., Stender, P., and Rudolf, B. (2009). GPCC Annual Report for Year 2008. Global Precipitation Climatology Centre, Deutscher Wetterdienst, Offenbach, Germany.
Gain, A. K., Immerzeel, W. W., Weiland, F. C. S., and Bierkens, M. F. P. (2011). Impact of Climate Change on the Stream Flow of the Lower Brahmaputra: Trends in High and Low Flows Based on Discharge-Weighted Ensemble Modelling. Hydrol. Earth Syst. Sci. 15(5), 1537-1545.