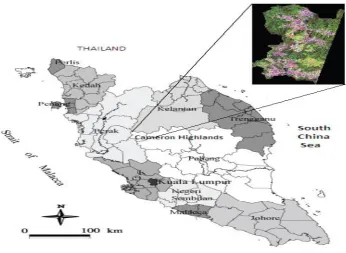
Comparative model for classification of forest degradation
Full text
Figure


Related documents
This study investigated the effects of an interactive multimedia learning explanation on nursing students' cognitive retention of mathematical structures and medication
Agroecosystems in North Carolina are typically characterized by a rich diversity of potential host plants (both cultivated and non-cultivated), and these hosts may
Calculated economic values for 1,3-D included average increase in lint yield, cost per kilogram of incremental lint yield, net return per kilogram increase in lint yield, and
Nothing prevents your security team from using the same cloud APIs and management tools as administrators and developers.. Configured and used properly, they provide security
The real growth rates fall into two distinct groups: the NAR, the FHA, the Census constant quality, the residential investment deflator, and the Freddie Mac series grow
The Highmark Foundation Advancing Excellence in School Nursing Awards applauds those devoted school nurses who exhibit leadership and passion and work tirelessly to keep our
With a . percent rate of increase in water usage and a mean annual precipitation of cm, what would be the maximum population growth rate Tucson could support (with CAP water)
The contract price includes the cost of work (the “Cost”) plus a Contractor’s fee of up to 8% of Cost for general and administrative expenses and up to 7% of Cost for