18th International Conference on Structural Mechanics in Reactor Technology (SMiRT 18) Beijing, China, August 7-12, 2005 SMiRT18- S07-4
ASSESSMENT OF THE LOADS ON A SOLID CENTRE REFLECTOR
OF A PEBBLE BED REACTOR USING DEM TECHNIQUES
Mark N. Mitchell
Pebble Bed Modular Reactor (Pty) ltd;
P.O.Box 9396
Centurion
0046
Republic of South Africa
Phone: +27 12 677 9400, Fax: +27 12
663 3053
E-mail:
[email protected]
Alexander G. Polson
Pebble Bed Modular Reactor (Pty) ltd;
P.O.Box 9396
Centurion
0046
Republic of South Africa
Phone: +27 12 677 9400, Fax: +27 12
663 3053
E-mail:
[email protected]
ABSTRACT
Distinct Element Method (DEM) techniques are commonly used in the simulation of geotechnical problems. These techniques simulate a system of particles by explicitly modelling the particles and the interaction between these particles.
A new application of these techniques is the simulation of the motion of fuel elements and the interaction of the fuel elements and the reflector structures in a Pebble Bed Reactor (PBR).
The Pebble Bed Modular Reactor (PBMR) is a High Temperature Gas Cooled Reactor that is being designed and constructed in South Africa. This reactor makes use of a solid Centre Reflector. It is important to illustrate the effect of the pebble bed on the loading of this reflector to show that the reflector will be able to perform its required functions with sufficient reliability.
This paper concerns the application of a DEM technique to the assessment of the loads that are experienced by the centre reflector of the 400 MW (thermal) PBMR core as well as the assessment of the reliability of the Centre Reflector when subject to this loading.
Keywords: Graphite, PBMR, Probabilistic analysis, Life assessment, HTGR, DEM, PFC.
1. INTRODUCTION
The 400 MW (thermal) pebble bed reactor design includes a solid centre reflector. This reflector is embedded in the pebble bed and thus interacts with the bed. The bed is a large random packing of spheres. There are local changes in porosity in this pebble bed, as well as local changes in load and other phenomena that are to be expected from a granular material.
Distinct Element Method (DEM) techniques are commonly used in the simulation of geotechnical problems. These techniques simulate a discontinuous continuum with a system of discrete particles by explicitly modelling the particles and the interaction between these particles.
A new application of these techniques is the simulation of the motion of fuel elements and the interaction of the fuel elements and the reflector structures in a pebble bed reactor (PBR).
The Pebble Bed Modular Reactor (PBMR), a High Temperature Gas Cooled Reactor makes use of spherical fuel elements that are randomly arranged within a cavity defined by the graphite reflector structures. The determination of the movement of the spheres in the reactor as well as the interaction between the pebble bed and the reflector structures was historically determined by experiment, but is now completed by means of DEM simulation.
The PBMR 400MWth design makes use of a solid Centre Reflector that stands inside the pebble bed. This reflector is constructed from interlocking graphite blocks. It is important to determine the loading of this reflector, as a result of the pebble bed, to prove that the reflector will be able to perform its required functions with sufficient reliability.
This paper concerns the application of the DEM techniques to the assessment of the loads that are experienced by the centre reflector of the 400MWth PBMR core as well as the assessment of the reliability of the Centre reflector when subject to this loading. The methodology applied and the results of the assessment are presented.
2. DESCRIPTION OF THE PROBLEM
The 400MWth core design for the PBMR has a solid centre reflector. This reflector and the side reflectors define the annular volume that is occupied by the pebble bed. The PBMR makes use of a multi-pass online refuelling scheme. This implies that spheres pass through the core on average six times during their life. These spheres are introduced through fuelling point in the top reflector and extracted through the defuelling chutes at the bottom of the reactor.
The pebble bed exhibits the features (such as self support through friction, local variations in porosity and local bridging) typical of a particulate material. The effect of these phenomena on the loading of the Centre Reflector must be determined as inputs for the design.
3. THE PEBBLE BED DESIGN
The design of the PBMR Core Structures is described briefly here as background information. Further information on the integrated PBMR plant design may be found in Koster et al. (2003) and on the design of the Core Structures in Mitchell’s (2004) presentation to the International Graphite Specialists Meeting.
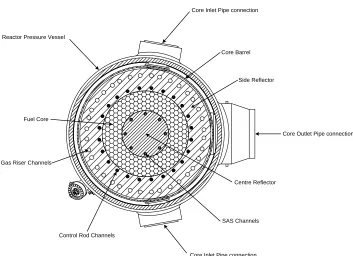
The PBMR Core Structures consists of the Core Barrel Assembly (CBA) and the Core Structures Ceramics (CSC). The main components of the Core Structures are shown in Figure 1 and Figure 2.
The CBA is a welded construction comprising three major components. These major components are the Core Barrel Support Structure (CBSS), the Core Barrel Sides and the Core Barrel Top Plate. The CBA is manufactured form 300 series austenitic stainless steel. The CBA provides for separation of the gases flowing within the core from the RPV and supports the CSC during normal operation and upset conditions.
Four major components comprise the CSC: The Bottom Reflector (BR), Side Reflector (SR), Top Reflector (TR), and the Centre Reflector (CR). The CSC is manufactured from individual graphite blocks. These blocks are arranged and interconnected so that they perform the required functions. The general arrangement and design principles that form the basis for the design of the CSC are based on the German designs for the THTR and later reactors.
These reflectors shape and support the pebble bed. Sphere inlets, the geometry of the top surface of the bottom reflector, and the provision of three defuel chutes permit the circulation of fuel through the core.
Mechanical loads are borne by the CSC and transmitted to the CBA, which in turn transmits the loading to the RPV. These mechanical loads are a result of: dead weight, lateral loading due to the pebble bed, seismic loading, and the differential pressures established in the core.
The Bottom, Side and Top Reflectors fulfil the requirement for neutron reflection while protecting the metallic components from exposure to high neutron fluence levels. In addition, the primary coolant flow is
channelled within the CSC. This protects the metallic components of the CBA and RPV from extreme temperatures. This coolant flow is introduced into the Bottom Reflector of the CSC. From there it is channelled to the top of the pebble bed in the Gas Riser Channels that are located in the Side Reflector. The gas then flows through the pebble bed from top to bottom, being heated in the process. At the bottom of the pebble bed, the gas is collected into the outlet plenum through flow slots between the blocks. The flow is then channelled from the outlet plenum into the outlet duct and out of the reactor.
The CSC provides the access channels for the Reactivity Control System (RCS) and Reserve Shutdown System (RSS) within the Side and Centre Reflector respectively.
Fuel Core
Control Rod Fuel Line
Side Reflector Centre Reflector Top Reflector
Bottom Reflector
SAS Extraction Point
SAS Channel
Figure 1: Vertical cross section schematic of the PBMR Reactor unit.
Fuel Core Reactor Pressure Vessel
Gas Riser Channels
Control Rod Channels
SAS Channels Core Barrel
Side Reflector
Centre Reflector Core Inlet Pipe connection
Core Outlet Pipe connection
Core Inlet Pipe connection
Figure 2: Horizontal cross section schematic of the PBMR Reactor unit.
4. DESCRIPTION OF DEM TECHNIQUES
The loading of the centre reflector was completed by utilising the 3-dimensional Distinct Element Modelling (DEM) PFC3D. Analysis has been completed for the nominal case where the sphere flow behaviour is regular and no disturbances are modelled.
The analysis documented forms the first part of a scoping analysis. These preliminary results have been produced to facilitate the completion of the preliminary centre reflector design.
4.1 Method and Code Used
As summarised by Polson (2004)
The DEM was introduced by Cundall (1971) for the analysis of rock-mechanics problems. As a simulation tool DEM has seen increasing use in several engineering and scientific fields during the past few years, both because of its unique modelling capabilities and the availability of the necessary computational power. A thorough description of the general Distinct Element Method can be found in the two-part paper of Cundall (1988) and Hart et al. (1988). The DEM may also be referred to as a Discontinuum Method, since its elements represent material regions in the modelling space that over time may move into and out of contact with each other. This would pose problems to “Continuum Methods” such as the Finite Element Method.
The PFC3D software used here is a simplified implementation of the DEM because of its restriction to rigid spherical particles, whereas the general implementation can handle deformable polygonal-shaped particles. Instead of following a continuum approach, the physics driving the movement of particles is simulated directly, subject to the following assumptions (Itasca Consulting Group, Inc, 2003):
• The particles are treated as rigid spherical bodies,
• The contacts occur over a vanishing small area, i.e., at a point,
• Behaviour at the contacts uses a soft-contact approach wherein the rigid particles are allowed to overlap one another at contact points,
• The magnitude of the overlap is related to the contact force via the force-displacement law. All overlaps are small in relation to particle sizes,
• Bonds can exist at contacts between particles, and
• All particles are spherical; however the implemented clump logic supports the creation of super-particles of arbitrary shape
The last two assumptions are very useful for simulations that involve crack initiation and growth, but were not used for the completion of the analysis described in this paper.
The calculation cycle in PFC3D is a time stepping algorithm that requires the repeated application of the law of motion to each particle, a force-displacement law to each contact, and a constant updating of wall positions. Contacts, which may exist between two balls or between a ball and a wall, are formed and broken automatically during the course of a simulation.
In the PFC3D code, the DEM is implemented explicitly, as opposed to implicitly, with the consequence that the non-linear interaction of a large number of particles can be simulated without excessive memory requirements or the need for an iterative procedure. The contact detection scheme used in PFC3D ensures that solution times increase linearly with the number of particles, rather than quadratically.
4.2 Common Applications
Common applications for DEM codes such as PFC vary from the direct simulation of particle flow inside mass transfer systems to the micromechanical modelling of granular materials. A good overview of recent work in the field can be found in the Proceedings of the 1st international PFC symposium (2002), and in the Proceedings of the 2nd International PFC Symposium (2002).
5. APPLICATION OF DEM IN THE PBMR
Owing to the nature of the PBMR, specifically the use of discrete spherical fuel elements, the DEM is used in several applications to provide inputs for further structural, neutronic and thermo-hydraulic analyses. A few of the issues addressed in DEM simulations for the PBMR are described below:
5.1 Sphere Flow Simulation
Simulations aimed at determining the behaviour of spheres as they are circulated through the core as well as determining the general state of the pebble bed are performed, including:
• The flow of spheres through the core, aimed at computing the distribution of residence time for fuel elements being circulated through the core (Niessen, H. F and Mitchell, M. N., 2003), and
• The packing efficiency of the fuel spheres in the core, in terms of the overall (bulk) packing ratio and local porosity distribution.
5.2 Reflector Loading
The loading on the reflectors due to the pebble bed is calculated and evaluated, specifically:
• The vertical distribution of the normal and shear pressures on the reflectors caused by the large number of fuel spheres pressing against them.
5.3 Pebble Bed Mechanics
The mechanical characterisation of the pebble bed in terms of various parameters that are required for the completion of the mechanical assessment of the behaviour of the core, is determined. The following are examples of specific parameters determined:
• The structural stiffness of the pebble bed, and
• The stress relieving effects of circulating fuel spheres in the core.
6. SIMULATION DESCRIPTION
The PFC model and the sphere circulation scheme employed are described.
The annulus geometry used for the modelling is as shown in the following figure. The datum plane for the x-coordinate is selected as the start of the 1.85m radius section. The drawing shows this as position 0.0.
Figure 3: Cross section of annulus showing dimensions.
The walls were modelled as cylindrical or conical sections using the PFC3D general wall. The following properties were selected for the walls:
Table 1: Wall properties for PFC model
Property Value [unit]
Wall friction coefficient 0.2
Wall normal stiffness 1.0E+6 [N/m]
Wall shear stiffness 1.0E+6 [N/m]
The centre axis of the core is the x-axis of the PFC3D model. This is selected as such to allow the problem to be run in parallel mode on multiple processors.
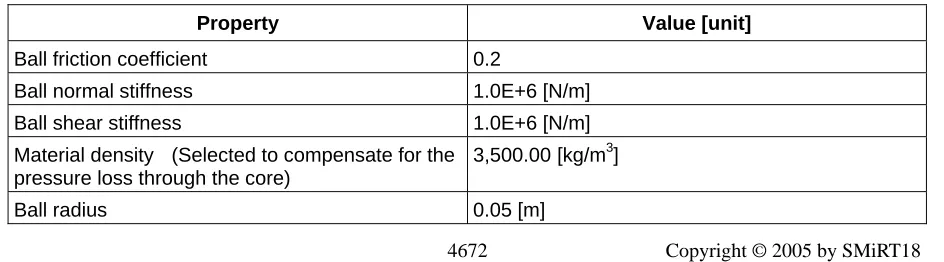
The linear contact model was selected for the solution of this problem. The ball properties for this contact model are shown in the table below.
Table 2: Ball properties for PFC model
Property Value [unit]
Ball friction coefficient 0.2
Ball normal stiffness 1.0E+6 [N/m]
Ball shear stiffness 1.0E+6 [N/m]
Material density (Selected to compensate for the pressure loss through the core)
3,500.00 [kg/m3]
Ball radius 0.05 [m]
The following comments are pertinent to the material property selections:
• The friction coefficient selected is applicable to the high temperature cases. From the 302MWth core design it was observed that the side reflector loads are the highest for this case.
• The ball stiffness values are not physically accurate. These stiffness values will not influence the silo loads determined by the code. The stiffness values do influence the time that the simulations will run for as the critical time step is determined by these values in conjunction with the sphere density.
• The material density is scaled to account for the additional load introduced by the gas flowing through the pebble bed. This value is based on the 302MWth core and is not valid for the 400MWth core. The effect of this error can be compensated for by means of a scaling of the results for the 400MWth core when the exact core pressure drop values are known.
• Large radius spheres are used for this simulation. This is done to accelerate the simulation process. The effects of this simplification are discussed in the conclusion.
The DEM problem that has been simulated is highly non-linear. This implies that the exact solution to the problem will be highly path dependant. An overview of the procedure used to complete the simulation is given in this section. This is to provide insight into the approach used to model the physical system. The simulation process is as follows:
1. The walls of the model are generated. These walls are generated from the preliminary information shown in the CAD model.
2. A loosely packed group (or cloud) of 15,000 spheres is generated in the annulus. These spheres are allowed to settle into the defuelling chute and conical section of the core. These spheres fill the core to approximately 1.2 m above the datum plane.
3. The assembly of spheres is cycled until equilibrium is reached. (The PFC3D convergence parameter used is either the average unbalanced force to average contact force ratio < 1.0E-2 or the average unbalanced force to average contact force ratio < 1.0E-2)
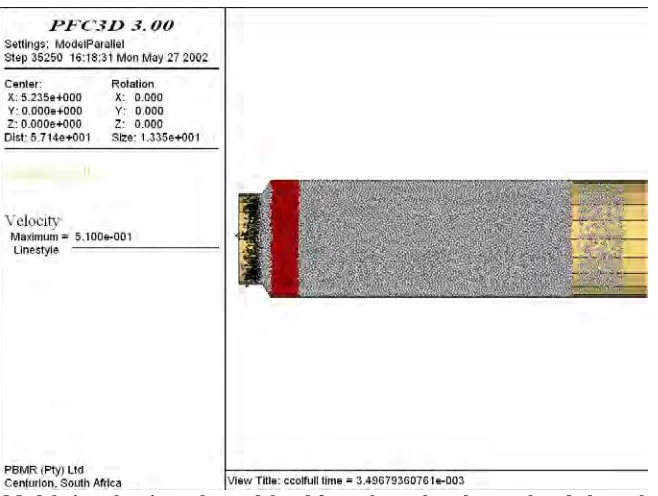
4. A block of spheres is selected and copied up so that the top level of the pebble bed is at the height of approximately 10.5 m. This is done to speed up the process of filling the core, as the densely packed assembly that is copied up is much closer to equilibrium. The resultant packing of the spheres in the model is shown in Figure 4 below.
5. The sphere circulation process is started. At this stage, the core is packed with the required number of spheres. The method by which the spheres have been inserted into the core is not physical. The core must be circulated before the results can be used for silo load evaluation.
Figure 4: Model view showing spheres used to seed the region (coloured red)
6. The spheres are circulated. This is done as follows:
a. A group of n spheres is removed from the bottom of the discharge tube. (As shown in Figure 5 below.)
b. A cloud of n spheres is generated above the top of the core. These spheres are given a velocity initial condition equivalent to the brake exit velocity of the FHSS. This is not correct for the proposed centre column layout but is done to accelerate the simulation.
c. The system is allowed to reach static equilibrium. (The convergence parameter used is either the average unbalanced force to average contact force ratio < 1.0E-4 or the average unbalanced force to average contact force ratio < 1.0E-4)
d. The forces on the walls are written to disk.
Figure 5 : Model view showing spheres removed from the bottom of the model.
Figure 6: Model view showing spheres deleted from the outlet when replaced above the pebble bed.
The cycling process is repeated as required.
7. SIMULATION RESULTS
7.1 Outputs From The PFC Simulation
The data files (written during step 6d) are post processed using the MATLAB scripts. The results for the analysis are output per cycle. These data are as follows:
• The unbalanced force and moment magnitude, as shown in Figure 7. This plot shows the magnitude of the resultant force and moment caused by the sphere loading on the centre reflector.
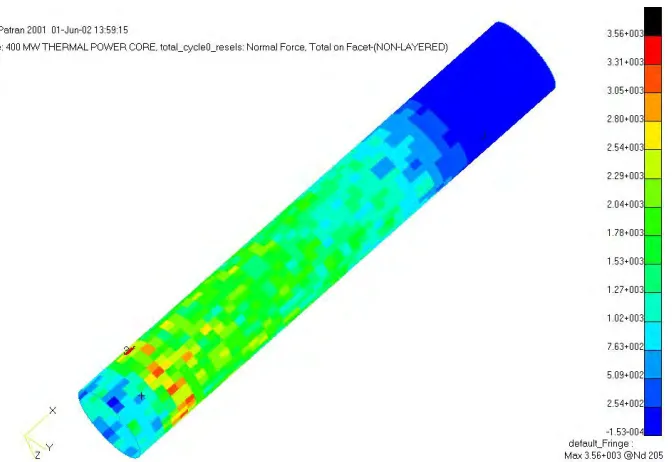
• The force distribution on the surfaces of the Centre Reflector, both the normal and shear forces are computed. The normal forces are shown in Figure 8.
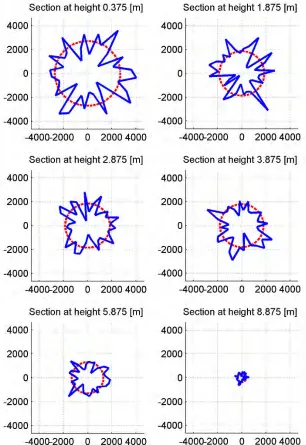
• The force wheel plots at various levels on the Centre Reflector, as shown in Figure 9. This is a polar plot of the force on the facets of the Centre Reflector at various heights. This plot gives a good impression of the evenness of the forces on the Centre Reflector. The mean normal force on the Centre Reflector is shown as well.
• Estimates of other pertinent characteristics such as the silo load.
Figure 7: Unbalanced force and Moment magnitude for cycle 0
Figure 8: Isometric view of the centre column model showing normal forces on the facets.
Figure 9: Force wheel plots for the Centre Reflector
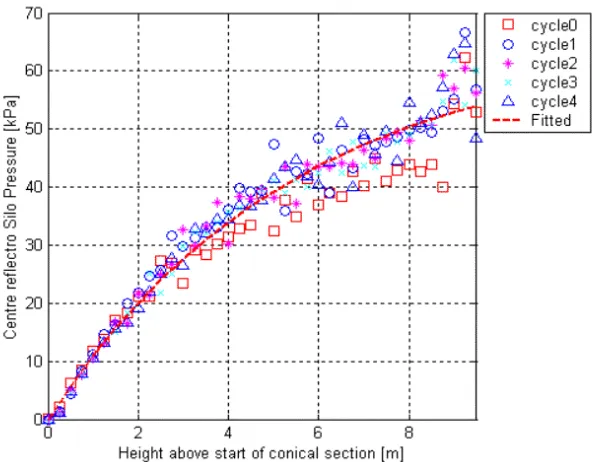
The silo load on the centre reflector is shown in Figure 10. When the silo load (for the annular core) as determined by these simulations was compared to the silo load for the cylindrical core, it was found that the magnitude of the silo load had decreased significantly. This decrease, of about 25%, is due to the lower total mass of the pebble bed and the reduced horizontal distance over which the bed supports itself by friction to the side walls.
Figure 10: Silo load curve from the simulation.
Figure 11: The shear force and bending moment diagrams about the Y and Z axes of the Centre Reflector.
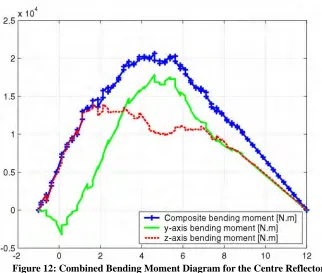
Figure 12: Combined Bending Moment Diagram for the Centre Reflector
7.2 Simplified Analysis Of The Centre Reflector For Deflection Under The Imposed Loads.
A basic analysis of the Centre Reflector was completed. This analysis was completed by means of a beam model and is described in the following sections.
The effects of the pebble bed limiting this deformation are neglected. It is assumed that if the loads are sustained over a long period of time, the centre column will migrate within the pebble bed and the displacements calculated during the structural analysis will be valid. The actual transient behaviour must be investigated.
7.2.1.1 Beam Model
The centre column was modelled as an equivalent beam. This beam was selected with the following properties:
Table 3: Equivalent beam properties assumed for the centre column.
Property Value [unit]
Beam section Hollow cylindrical tube
Beam Inner diameter 0.4 [m]
Beam Outer diameter 0.6 [m]
Beam Material Graphite
Youngs Modulus 10.5 [GPa]
Poisson ratio 0.2 [.]
The properties selected are not based on the actual centre column in any way. The values were merely selected to give some basis for the comparison of the results of the PFC analysis.
7.2.1.2 Load And Constraint Inputs
The MATLAB post-processing scripts produced the load inputs.
The beam model was constrained as follows:
• The lower end of the beam mode was fixed in translation in the X,Y and Z directions as well as rotation about the X axis,
• The Upper end of the model was fixed is Y and Z translation.
7.2.1.3 Analysis Results
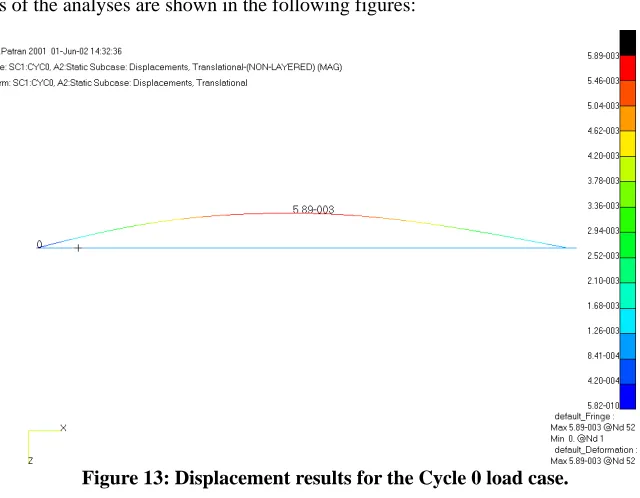
Sample results of the analyses are shown in the following figures:
Figure 13: Displacement results for the Cycle 0 load case.
The results for all the load cases are shown in the following table:
Table 4: Stress and displacement results for the beam analyses.
Maximum combined stress
Minimum combined stress
Load case Maximum
Displacement [10-3 m] MAX MIN MIN
Cycle 0 5.89 4.41E+05 -2.44E+06 -2.68E-06
Cycle 1 8.64 1.43E+06 -2.43E+06 -3.37E+06
Cycle 2 7.42 7.88E+05 -2.52E+06 -3.19E-06
Cycle 3 1.57 2.08E+05 -2.47E+06 -2.64E+06
Cycle 4 7.12 6.74E+05 -2.47E+06 -3.31E+06
The stress results provided are based on the loading induced by the pebble bed. The effects of dead weight or other primary loadings are not accounted for.
Copyright © 2005 by SMiRT18
8. CONCLUSIONS AND RECOMMENDATIONS
The following conclusions can be drawn from the results of this simulation:
• The Centre Reflector will experience unbalanced loading under normal operation conditions.
• This unbalanced loading will imply that the centre column structure supporting the centre reflector must have sufficient bending stiffness and strength to resist deformation due to this load.
The effects of the pebble bed limiting this deformation are neglected. It is assumed that if the loads are sustained over a long period of time, the centre column will migrate within the pebble bed and the displacements calculated during the structural analysis will be valid. The actual transient behaviour must be investigated.
REFERENCES
Konietzky, H., (2002), "Numerical Modelling in Micromechanics via Particle Methods", 1, A.A. Balkema, Lisse
Cundall, P. A, (1988), Int.J.Rock Mech., Min.Sci.& Geomech.Abstr., 25, 107-116
Cundall, P. A., (1971), Proceedings of the Symposium of the International Society of Rock Mechanics (Nancy, France, 1971), Vol. 1, Paper No. II-8.
Hart, R, Cundall, P. A, and Lemos, J., (1988), Int.J.Rock Mech., Min.Sci.& Geomech.Abstr., 25, 117-125
Itasca Consulting Group, Inc, (2003), "PFC3D (Particle Flow Code in 3D) Theory and Background Manual", Version 3.0, ICG, Minneapolis
Koster, A., Matzner, D., and Nicholls, D. N., (2003), Nuclear Engineering and Design, 2800, 1-15
Mitchell, M. N., ( 2004), Presentation to Fifth International Nuclear Graphite Specialists Meeting, Plas Tan-Y-Bwlch, Maentwrog, Gwynedd, United Kingdom
Niessen, H. F and Mitchell, M. N., (2003), Numerical Modelling in Micromechanics via Particle Methods, 45
Polson, A. G., (2004), Proceedings of ICAPP '04, Paper 4163