71:4 (2014) 93–107| www.jurnalteknologi.utm.my | eISSN 2180–3722 |
Full paper
Jurnal
Teknologi
New D16 Algorithm for Surface Water Flow Direction
Wan Muhd Hairi bin Wan Ab Karim, Mohamad Ghazali Hashim*
Dept. of Geoinformation, Faculty of Geoinformation and Real Estate, Universiti Teknologi Malaysia (UTM) Johor Bahru, Johor.
*
Corresponding author: [email protected]
Article history
Received :6 February 2014 Received in revised form : 24 July 2014
Accepted :9 October 2014
Graphical abstract
Abstract
D8 algorithm is a widely used on raster-based dataset to illustrate the correlation and relationship of any particular pixel with its neighbouring pixels in water flow direction model. Unfortunately, several limitations of D8 algorithm are detected: flow divergence in ridge area cannot be modelled, not suitable for sub-catchment identification and others. While, there is a high demands to provide accurate flow direction information is encouraged by the several applications on drainage network planning, agricultural sector and some related construction planning. Thus, the aim of the study is to develop a new algorithm that will improve the efficiency, accuracy, and reliability of current D8 algorithm on surface Single Flow Direction (SFD) modelling. D16 algorithm is not only introduced by adding eight new additional flow direction options, but also provide some additional rules and equations to overcome the weaknesses of D8. This study involved the process of deriving D16 model, logical structures and constructing the best equations into a small executable program. Lastly, the comparison results between D8 and D16 algorithm on local topographic map, Shuttle Radar Topography Mission (SRTM),Advanced Spaceborne Thermal Emission and Reflection Radiometer (ASTER) and Light Detection and Ranging (LiDAR) data is discussed in details to evaluate the accuracy of D16 algorithm.
Keywords: Raster dataset; Water Flow Direction; Single Flow Direction Model; D8 Algorithm; New D16 Algorithm
Abstrak
Algoritma D8 telah digunakan secara meluas pada data raster bagi menggambarkan perkaitan dan hubungan antara sesebuah tempat (pixel) dengan tempat yang berjiranan dengannya dalam model arah laluan air. Malangnya, beberapa kelemahan dalam algoritma D8 telah dikenalpasti seperti tidak berupaya untuk menghasilkan model y tepat di kawasa, bercerun, tidak sesuai bagi mengesan anak kawasan tadahan air dan sebagainya. Sebaliknya, permintaan bagi penghasilan maklumat laluan air adalah tinggi yang didalangi oleh aplikasi-aplikasi penting seperti perancangan strategik saliran air, sector pertanian, dan beberapa sector pembinaan. Oleh itu, kajian ini dikelola dengan bermatlamatkan penghasilan satu algoritma baru yang berupaya meningkatkan kecekapan, kejituan dan kebolehpercayaan terhadap maklumat arah laluan air berbanding hasil yang diberikan oleh algoritma D8. Algoritma yang dimaksudkan (D16) bukan hanya menambah lapan arah laluan air yang baru, tetapi juga turut memperkenalkan beberapa syarat dan persamaan baru bagi mengatasi kelemahan-kelemahan algoritma D8. Perbincangan kertas ini merangkumi proses mereka model D16, struktur dan mengenalan bagi persamaan-persamaan yang diperkenalkan. Pada pengakhiranya, hasil keluaran D8 dan D16 akan dibandingkan dengan menggunakan data peta topo, SRTM, ASTER dan LiDAR.
Kata kunci: Data Raster; Arah Laluan Air; Model Laluan Searah; Algoritma D8, Algoritma Baru D16
© 2014 Penerbit UTM Press. All rights reserved.
1.0 INTRODUCTION
Many applications involve crucial planning decisions that are closely related and needed a very high accuracy on water flow direction such as drainage network planning, flood prediction,
monitoring and precaution, dam planning and construction, water catchment and others.
DEM is a preferred medium because it consists of an efficient, readily available and completely matrix data structure (Miller, 2010; Moore et al., 1991). There are various methods or algorithms available today; which defined the processes of water flow in different approaches in order to fit their targeted applications scope. In brief, flow direction algorithms are divided into two main groups; Single Flow Direction (SFD) and Multiple Flow Direction (MFD). The famous SFD is the simplest D8 algorithm while D-infinity (D∞) represents the most popular algorithm in MFD.
1.1 Statement of Problem
Water flow direction is a basic technique in watershed analysis either in Geographic Information System (GIS) and other professional fields related to surface water flow direction modelling. In order to provide the most accurate information on water flow direction and watershed model, many new data acquisition techniques had been introduced and the older systems had evolved dramatically (new hardware, software and procedures) to increase the efficiency and accuracy of the output result. For example, Airborne Light Detection and Ranging (LiDAR) is used as a new data acquisition technique (compared to traditional surveying and mapping methods) especially in GIS and other construction fields for a large area within a short period and provide a very good accuracy that exceed up to sub-meter. Currently, there are more than 200 LiDAR systems available all over the world and can achieve up to 250,000 pulses per second and with different type of sensors that fit variety of purposes (Schuckman and Renslow, 2009). While, in term of accuracy, LiDAR system such as aero-space service are able to reach up to 15 cm RMSE ground surface (Hodgson and Bresnahan, 2004).
Although a very high accuracy of data such as LiDAR and high resolution remote sensing satellite imagery is used, the information on surface water flow directions are still in the same
range of accuracy. It is the nature of hardware development must coincide with software, while the data development (accuracy of new data acquiring methods) with the processing algorithm development. We cannot leave one behind especially when providing information (GIS) to suggest the best decision making output which involves the loss of money, properties and lives such as in flash flood event.
Currently, the overall SFD model could not be provided at the best level of accuracy to the specific application due to the unenhanced old algorithms. Thus, there is a need to upgrade and improve the widely used SFD algorithms such as D8 to simultaneously catch up for the development of data acquisition techniques in order to provide the most accurate information related to the surface water flow direction.
The focus of this study only concerned on the SFD category discussed in details especially for D8 algorithm. This paper basically try to seek the weaknesses of D8 algorithm, how a new D16 algorithm can be design to overcome those limitations of D8 and the comparison results from various methods that finally will prove this new D16 algorithm is better than D8 algorithm. In short, this study is mainly conducted to develop and test a new designed algorithm for surface water flow direction called “D16 Water Flow Direction” to increase the efficiency, accuracy and reliability of current D8 algorithm, used in many GIS and hydrology software which are related to SFD.
There are some motivations for developing this new SFD algorithm other than the demand of several applications for a high accuracy output. They are:
1. Some weaknesses of D8 algorithms addressed by several researchers.
2. To increase the dispersion options of SFD according to a valid theory.
3. The need to implement other state of water other such as stagnant and sink state.
4. The reliability of the current D8 algorithm in term of accuracy (Figure 1)
Apart from limitations of SFD or D8 algorithm, there is another main factor of deriving the new SFD algorithm. According to the 1st Law of Geography, "Everything is related to everything else, but near things are more related than distant things" (Tobler, 1970). The eight neighbour pixels used in this neighbourhood analysis is definitely true and agree by this law, but we cannot ignore the other parameter of this law on the distant thing.
Thus, the main difference highlighted between eight directions of existing SFD with this new SFD algorithm is by adding eight additional directions for D8 algorithm that fully obey the first law of geography as the name given “D16” algorithm. Besides that, it is also include some other rules and equations in order to enhance the weaknesses of D8 algorithm that is discussed later.
1.2 Water Flow Direction Concept
At any point (X, Y, Z) in all spatial referenced system, a certain volume or drop of water (example from the rain) will have from 0⁰ to 360⁰ of horizontal direction to flow from one point to other point/place which is lower than the current surface elevation. That is the nature of the world phenomenon upon real water flow concept. Apart from that, even if there is stagnant water on the earth surface, it will attempt to flow to the lower places due to the earth gravitational force except surrounded by the higher solid object or material such as in Figure 2. For instance, the water in upstream river will flow naturally toward the downstream river and then go to the sea as it final destination. Flow direction is based on the elevation difference and gravitational pull unless there is a dam constructed in between the flow.
Figure 2 General concept of flow direction
On the other hand, GIS and other related professions mostly agree that the best method to describe water flow direction concept is represented eight directions such as D8, Rho8, FD8, and FRho8 algorithms in SFD model. The main reason for accepting only eight directions (45⁰ each neighbour directions) as the maximum flow direction options is because the implementation of these algorithms are in raster-based which
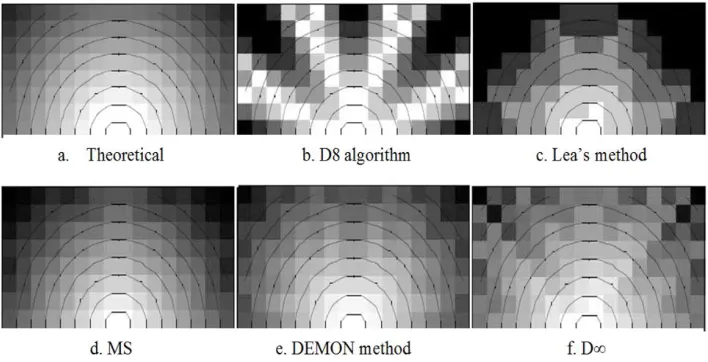
only has eight nearest neighbours for an interested pixel. Eight directions are the result of the only eight surrounded pixel that directly touch the pixel except the outer pixel (row and column) of any input raster dataset. The concepts of flow direction and model, examples of expected output results from several algorithms in SFD and MFD are shown in the Figure 3.
Water level
Figure 3 Comparison of each flow direction concepts (Tarboton, 1997). The black pixels show the potential flow direction at a particular point. A) Theoretical flow direction. B) and C); Example of SFD results. D) Theory of MFD. E) and F); Example of MFD results.
2.0 CURRENT SFD AND MFD ALGORTIHM
2.1 Single Flow Direction (SFD)
SFD is the simplest and very essential model to describe the flow direction either in GIS field of others based on height difference such as in Figure 4. D8 is a well-known algorithm proposed by (O’Callaghan and Mark, 1984) and now is widely used in SFD model in various open source and commercial software. The aim of this D8 algorithm is to approximate the flow directions on a topographic surface, the process of tracking "flow" from each pixel to one of its eight neighbour pixels
(Rivix, 2008). D8 algorithm uses eight nearest neighbours of a particular pixel to determine in which direction the water will flow from its current location or pixel to its neighbour pixel until it will reach to the destination such as river or pond. While, Rho8 algorithm was introduced by (Fairfield and Leymarie, 1991) that work only with DEM surface model (Lindsay, 2012). The concept is quite similar with D8 algorithm, but it will correct the removed pixel caused by all flat areas and spurious depressions (Lindsay, 2012). While, the grid cells that have no lower neighbours are assigned a flow direction of zero.
Figure 4 Concept of SFD (Boonklong et al., 2007). Values indicate the elevation of the pixel.
2.2 Multiple Flow Direction (MFD)
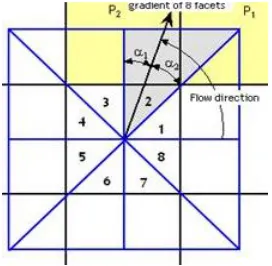
One of the famous algorithms of MFD is D-infinity (D∞) that is widely used in advance water flow analysis with slope element as the main factor of study or working field. D∞ uses a range of 45⁰ from each neighbour’s pixel origin to the next direction using 4x4 pixel window as illustrated in Figure 5. D-Infinity
algorithm is also capable to handle all of the ambiguous situations that can occur in real topography (sometimes resorting to the D8 method) while many other MFD methods cannot provide this solution. Examples of application are the landslide accident and other slope applications and models.
Figure 5 D∞ water flow direction (Smith et al., 2009)
2.3 SFD: D8 Algorithm
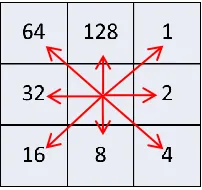
The concept of D8 algorithm used the 3x3 pixel windows such illustrated in Figure 6. The angle of each direction to the next direction is 45 degree (45⁰). Thus, this will make the option of the water to flow is limited to only eight directions. But in
theory, water can flow in 360⁰, which is in all direction as far as it is from high to the lower part of the surface pulled by the gravitational force. This D8 algorithm was accepted because of the limitation in raster based which only have eight contacted-neighbour pixels.
Figure 6 D8 water flow direction (Michael John De Smith, 2009)
2.3.1 D8 Algorithm: Limitations
D8 algorithm is very important at the valley, produce many parallel flow lines and yet solved many problems in the catchment boundary (Wilson, 2002). But, some questions have arisen on the accuracy of this only eight direction options in SFD, especially the widely used D8 algorithm. There are many limitations of D8 algorithm identified by some researchers:
Wilson, 2002 – “D8 cannot be used to model the water flow direction divergence in ridge area”.
Miller, 2010 – D8 is not a suitable method for sub-catchment identification.
Tarboton, 1997:
- Less options available with a huge separated range angle (Discretization of D8 flow into only one of eight possible directions, separated by 45°).
- D8 introduces no dispersion, but at the expense of grid bias.
Besides that, D8 algorithm also was not able to detect other state of water which is with no direction at all (swamp or stagnant areas). D8 will give the wrong flow direction which is trapped toward the other neighbouring flow arrows.
3.0 DEVELOPMENT OF NEW D16 ALGORITHM
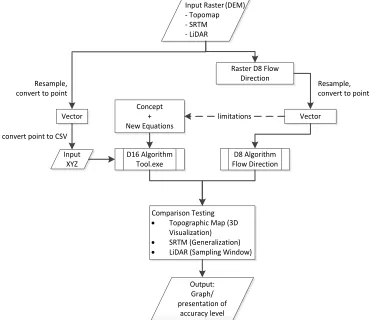
The basic fundamental structure of new D16 algorithm is the phase of designing a conceptual model and introduction of new equations in which derived purposely to overcome the limitations of the current SFD or D8 algorithm. Figure 7 shows the overall framework on how the new D16 is being tested with D8 algorithm from three sources of raster data up to the output phase of accuracy level.
For both algorithms, the raster data are converted to vector data in form of point feature. They will undergo the process of resampling pixel and convert to point from raster using ArcGIS software. Vector based representation is used in this study because people can easily visualize and detect the flow direction movement as represented by the arrow, but not in raster based because its environment uses the pixel value in different tone of colour. The point layer of D8 result is represented as arrow symbol with different angles based on the D8 concept illustrated as in Figure 6.
Comparison Testing
· Topographic Map (3D Visualization)
· SRTM (Generalization)
· LiDAR (Sampling Window) D16 Algorithm
Tool.exe
D8 Algorithm Flow Direction Raster D8 Flow
Direction Concept + New Equations Vector limitations Resample, convert to point Input Raster - Topomap - SRTM - LiDAR Vector Input XYZ Resample, convert to point
convert point to CSV
(DEM)
Output: Graph/ presentation of
accuracy level
Figure 7 A framework for developing and comparing D16 algorithm with D8.
3.1 D16 Algorithm: Concept
D16 algorithm will use almost 5x5 pixel neighbour resolutions that will give 22.5⁰ (the angle for each neighbour directions) as in Figure 8(a), which is half of the angle range for D8 method. Thus, basically it will produce fifty per cent (50%) increment in the available flow direction options compared to the D8 method. But due to the restriction introduced, it might be less than forty per cent chances on flow direction to select these eight additional directions. Some additional rules and equations are
introduced to enhance the existing D8 algorithm. The new features or sub-algorithms embedded in D16 are:
i. Additional of eight new directions option from D8 algorithm.
ii. Introduction of Intermediate Factor (IF) to restrict and filter the flow direction to the eight new added directions, illustrated in Figure 8(b).
iii. Using D8 method for the first 3x3 pixel resolution for second outer pixel
iv. Implementation of Sink and Stagnant formula.
Figure 8 D16 Algorithm concept (left) and intermediate factor (left, blue outline circle)
3.1.1 D16 Algorithm: Formulae
Since it is in raster based, the array format in programing is the most suitable method to illustrate the derived formulae. The main formulae involved in the computation are Distance Weighted formula, Height Difference formula, Intermediate Factor formula, Sink and Stagnant formula that are:
i. Distance : √[(X1-X2) 2
+ (Y1-Y2) 2
]
:derived from Distance Weighted, w(d) = 1/dp (NCGIA, 1988-2013)
ii. Height difference, Zα = Zn – ZD16
Legend;
iii. Intermediate Factor :
Height intermediate, ZIF = (Za + Zb)/2
: if ZIF < Zn, test is pass.
iv. Stagnant: Zα(max1) > -0.001 and Zα(max2) < 0.001 and
Zα(max3) > 0.0001 and Zα < 0.3
v. Sink: Zα = nil or Zα > Stagnant (0.3)
The values in stagnant formula is not fixed numbers, it is varies according to the application requirements and needs.
3.2 D16 Algorithm: Approaches in Result Comparison
There are many methods and approaches used to compare the result between D16 algorithm and the existing D8 algorithm. They are small resample size pixels, three different in topological samples area, SRTM data for large scale area and modelling technique (3D view) for illustrating the concept and accuracy using visual interpretation.
The concept of small resample size is a necessary method to make a comparison because it is more accurate where the data is stored for each smaller pixel size in details as in a large scale map. As compared a bigger resample pixel size, the information or data had been generalized and the output information is less accurate which contains fewer details as stored in large small scale map. For example, using ASTER or SRTM 30 meter resolution is more accurate compared to SRTM 120 meter resolution in water flow direction input data.
A smaller pixel resolution is used and acted as a schema to a bigger pixel resolution in comparing the accuracy of the final result for both algorithms. In order to produce more accurate and reliable result, this comparison approach also introduced three different pixel resolutions of LiDAR data which will cover 60 sampling windows (20 for hilly site, 20 for developed area and 20 for riverbank) for each pixel resolutions. The pixel resolutions involved are 10 m, 15 m, and 20 m resolutions.
Some researchers on terrain analysis for water resources application presented by Wilson agreed that D8 algorithm is good at valley area but cannot model the flow divergence at ridge areas. Thus, this testing method will be conducted to inspect either D16 algorithm is able to produce better accuracy and reliable results compared to D8 algorithm in three stages of sloping circumstances which cover the hilly site, developed area and river bank area. LiDAR data with 20 sampling windows will be used for each sample area (hilly site, developed area and riverbank). Then, the flow direction in each sampling is counted
to determine which algorithms will produce more reliable and accurate result.
ArcScene module in ArcGIS software will be used to create a 3D model for visualization and interpretation for both results. This testing technique is organized to determine which algorithm can provide a better reliability result in the real modelling scheme according to the nature of water flow direction (able to flow freely in 360⁰ in the steepest slope). While, the data used in this testing method is the contour and river tributary data which had been digitized from topographic map. A Triangulated Irregular Network (TIN) will then be created from the contour data using ArcGIS software. The TIN surface model is the best raster surface to model the terrain slope and aspect of the study area that combined with the river tributary and to create a model the water flow direction. In general, these comparison methods can be classified based on the data type itself such:
- Topographic map : 3D Visualization
- SRTM : General Comparison using Visual Interpretation
o Divergence in ridge area
o Smooth water flow direction model
o Accuracy
o Generalization result (a resized SRTM 30 m and SRTM 120 m)
o Edge reliability
- ASTER : General Comparison using Visual Interpretation
- LiDAR : Sampling Windows
o 3 different topographic areas (hilly, developed and riverbank)
o 3 different pixel resolutions (10 m, 15 m, 20 m)
4.0 IMPLEMENTATION AND RESULT
Result of this comparison method can be categorized into three categories which are based on the implementation categorized by data source; SRTM, Topographic map and LiDAR.
4.1 Topographic Map Results (3D View)
Figure 9 3D View (TIN) generated from contour and river; a) D16 (above) and b) D8 (below)
4.2 SRTM Results (TIN Surface)
The comparison result are based on the description above (classification data, section 3.2). Figure 10 clearly shown that
D16 can produce higher divergence in hilly area (purple colour indicated eight additional flow direction options), produce a smooth motion model of water flow and provide more accurate compared D8 (sink and stagnant).
Figure 10 Different of divergence in hilly area for both D16 (left) and D8 (right)
D16 produce a better result of generalization process in dealing with bigger pixel size. There are two set of resolution used in this testing method, a 30 m resolution and 120 m resolution SRTM data samples to investigate which algorithm will produce
Table 1 Percentage of preserving details (Sink) in four time generalization in size
Algorithm Single/Clustered Number of
Resolution
30 m 120m Percentage preserve detail (Sink)
D16
D8
Sink Stagnant Sink Stagnant
38 110
60 -
54 10 4 -
168.5%
6.7%
Figure 11 Four times generalization ratio for D16 (above) and D8 (below) results; before (left), after (right) generalization
In term of edge reliability aspect, D16 had shown a better result than D8 because it used D8 algorithm to calculate the edge flow direction for 3 x 3 pixel resolutions on outer pixels as shown in
Figure 12(a). Figure 12(b) represents the edge result produced by D8 algorithm where it is clearly shows that some of them pointer blindly toward no data provided by raster or pixel.
.
Figure 12 Edge reliability; a) D16 (left) and b) D8 (right)
4.3 LiDAR Data (Sampling Window)
Through this testing method, a statistical sample is used to organized the counted data which can be used as the solid evident or prove that D16 algorithm is able to provide more accurate result compare to D8 algorithm. There are three main
purposes of this sampling testing method for LiDAR data (high accuracy data). They are:
Illustrate the comparison result in three different kind of slope level.
Find the relationship between the result produced by D8 algorithm and D16 algorithm with the pixel size resolution (generalization).
To carry out the objectives of this testing method sixty sampling windows are used in this study which covers twenty window samplings for each hillsite area, developed area, and riverbank respectively. Figure 13 shows one of LiDAR data out of three study area in Klang Valley.
Figure 13 Example of sampling windows and the three types of sampling criterions
4.3.1 Example of LiDAR Sampling
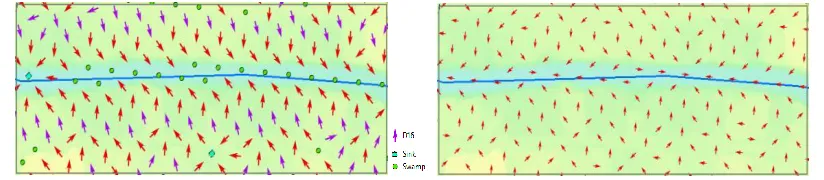
The sampling methods involved three different of places or slope rates which are riverbank, developed area and hilly site. Examples of sampling result are shown in Figures 14 to 16 which only cover 10 m and 15 m pixel resolutions.
1. Riverbank: D8 algorithm in Figure 14 (right) cannot produce stagnant/sink at the river body and the flow direction sometime gets opposite the actual flow of the river. Unlike D8, D16 in Figure 14 (left) is able produce a better reliability result and the sink and stagnant (swamp) will give the alignment and shape of the river.
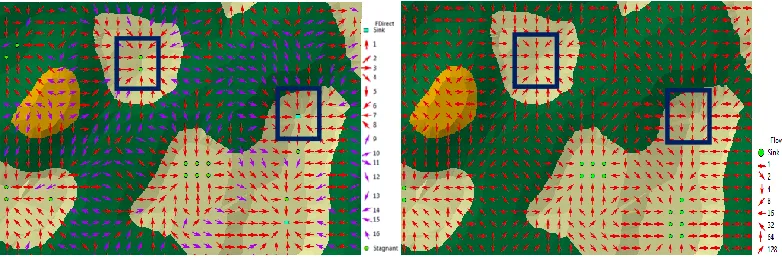
2. Developed Area: There are many false or wrong flow
directions of D8 10 m resolution in Figure 15 (left) which will affect the accuracy level in water flow direction model. While, 10 m resolution of D16 result seems to provide a good flow divergence in developed area, able to detect sink and swamp area, reduce most of the conflict flow direction (opposite to each other) as shown in Figure 15 (right). The same result is produced in higher resolution; 15 m and 20 m. 3. Hilly site: Based on the Figures, D16 algorithm is able to
produce more flow divergence and detection of sink or swamp area in the hilly site compared to D8 for 10 m resolutions. Thus, D16 algorithm is capable to produce more precise information in hilly area compared D8 algorithm.
Figure 15 Developed area comparison of 10 m resolution results; a) D16 (left), b) D8 (right)
Figure 16 Riverbank comparison of 10 m resolution results; a) D16 (left), b) D8 (right)
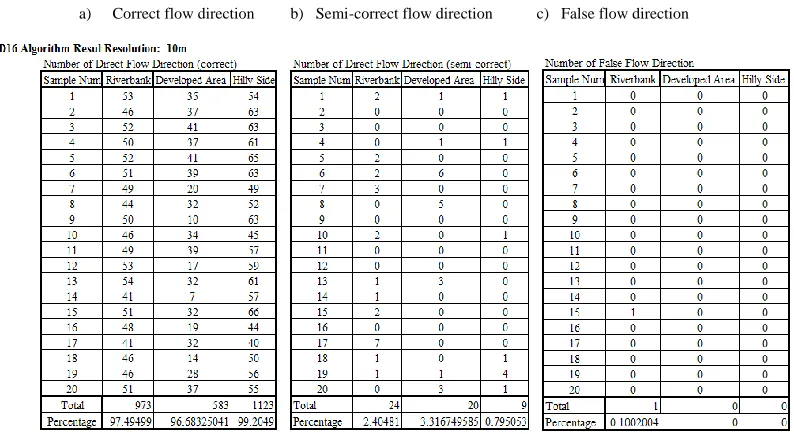
To achieve the second sampling objective, the results of flow direction are counted for each sampling windows, grouped into three categories which are reliable flow, semi-reliable flow and not reliable flow (false-flow). Then, it is recorded into the tables
which will be used as the statistical evident to compare and produce percentage difference. Table 2 show the example of sampling result for 10 m resolution while Table 3 show D16 and D8 reliability percentage at three different sloping situations.
Table 2a Result of 10 m pixel sampling windows for D16 algorithm
a) Correct flow direction b) Semi-correct flow direction c) False flow direction
Table 2b Result of 10 m pixel sampling windows for D8
a) Correct flow direction b) Semi-correct flow direction c) False flow direction
Table 3 Overall percentage of reliability based on window samplings results
As the window sampling result from LiDAR data, three reliability graphs are produced based on the sampling tables in which categorized accordingly by three sampling groups. The reliability graph combined the pixel resolution factor with the two algorithms that are being verified. Figure 17, 18 and 19 show the reliability graph for riverbank, developed area, and ridge area respectively.
a)
.
b)
10 m 15 m 20 m 10 m 15 m 20 m
D16
%
D8
D8 Algorithm D16 Algorithm
10 m 15 m 20 m 10 m 15 m 20 m
D16
D8
D8 Algorithm D16 Algorithm
Figure 17 Riverbank reliability graph
Figure 18 Developed area reliability graph
Figure 19 Ridge area reliability graph
For the hilly site aspect, the reliability and consistency of D8 is quite impressive compared to riverbank and developed area. But, the percentages of reliable results are still lower than D16 result based on sampling Table 3 and Figure 19. The main different of D16 compare D8 is that, the flow divergence
options had increase fifty per cent because of additional eight direction such as proven by SRTM data sampling in Figure 10 (left). Although the reliability and consistency aspects for hilly site of D8 is good enough, D16 is still able to increase this D8’s
10 m 15 m 20 m 10 m 15 m 20 m
D8
D16
%
D8 Algorithm D16 Algorithm
reliability with a slightly increment in percentage values and can provide zero false flow direction.
5.0 CONCLUDING REMARKS
Based on various testing and comparison techniques used, D16 algorithm had shown a positive enhancement in accuracy, reliability and consistency of the flow direction results
compared to D8 algorithm. The problem related to flow divergence in a ridge area also being enhanced by D16 by providing a double options from D8 algorithm. Various testing methods discussed had proven that D16 algorithm is able to produce better accuracy, edge reliability, better result of generalization and produce water stagnant state compared to D8. The overall accuracy increments (percentages) that D16 algorithm able to produce compared to the accuracy of D8 algorithm are shown in Table 4 and represented in Figure 20.
Table 4 Overall percentage difference (accuracy increment) from D8
Resolution
Riverbank
LOCATION
Developed area Hilly site
10 m 15 m 20 m
13.78 10.83 5.05
12.96 9.13 19.52
4.99 4.01 4.18
Figure 20 Percentages of accuracy increment of D16 compare to D8 algorithm
The construction of D16 seems a bit complicated with many new equations introduced compared to D8 algorithm. By introducing another state of water movement such as stagnant and sink, a new application can easily be created through D16 algorithm in which D8 never can produce. It is the automatic detection of stagnant or swamp area that was highly needed for large scale agriculture activity such as Sime Darby Plantation and other estate plantation companies for their water supplement
management and other application. An automatic detection of swamp area, stream alignment and width in a large area such as the plantation estates can be easily done without being on field collection such as using GPS as presented in yellow polygon of Figure 21 compared to D8 result in Figure 22.
0 2 4 6 8 10 12 14 16 18 20
Riverbank Developed Area Hilly Area
D16: Accuracy Increment Compared D8
10m resolution
15m resolution
20m resolution
Figure 21 D16 result for swamp area and stream network detection application
Figure 22 D8 result stream network detection
As a nutshell, all the testing methods used in this study had shown positive indicators that D16 algorithm capable to provide better accuracy, reliability and consistency upon surface water flow direction model compared to D8 algorithm. Thus, hopefully this algorithm will be enhanced by other researchers and widely used in modelling the surface water flow applications in the future.
References
[1] Boonklong, O., Jaroensutasinee, M. and Jaroensutasinee, K. 2007. Computation of D8 Flow Line at Ron Phibun Area, Nakhon Si Thammarat, Thailand. World Academy of Science, Engineering and Technology 33( 2007).
[2] Fairfield, J. and Leymarie, P. 1991. Drainage networks from grid digital elevation models. Water Resources Research. 27(5). [3] Hodgson, M.E. and Bresnahan, P. 2004. Accuracy of Airborne
Lidar-Derived Elevation: Empirical Assessment and Error Budget.
[4] Lindsay, J. 2012. Rho8 flow pointer (direction). Whitebox Geospatial Analysis Tools. University of Guelph.
[5] Michael John De Smith, M.F.G., Paul A. Longley. 2009. Geospatial Analysis - A Comprehensive Guide to Principles, Techniques and Software Tools. Matador. 2009 : 560.
[6] Miller, B. 2010. Comparison of Surface Hydrologic Algorithms in GIS. Michigan State University.
[7] Moore, I.D., Grayson, R.B. and Ladson, A.R. 1991. Digital Terrain Modeling: A Review of Hydrological. Geomorphological and Biological Applications. Hydrological Process. 5(1991) : 3– 30.
[8] NCGIA. 1988-2013. Interpolation: Inverse Distance Weighting.
The Regents of the University of California. National Center for Geographic Information and Analysis.
[9] O’Callaghan, J.F. and Mark, D.M. 1984. The Extraction of Drainage Networks From Digital Elevation Data. Computer Vision, Graphics and Image Processing. 28: 328–344. [10] Rivix. 2008. D8 and D-Infinity Algorithms. LLC. (1998-2008). [11] Schuckman, K. and Renslow, M. 2009. Lidar Technology and
Applications. The Pennsylvania State University.
[12] Smith, M.J.D., Goodchild, M.F. and Longley, P.A. 2009. Geospatial Analysis - A Comprehensive Guide to Principles, Techniques and Software Tools. Matador. 2009 : 560.
[13] Tarboton, D.G. 1997. A New Method for the Determination ff Flow Directions and Upslope Areas in Grid Digital Elevation
Models. Water Resources Research American Geophysical Union. 33(2): 309–319.
[14] Tobler, W.R. 1970. A computer movie simulating urban growth in the Detroit region. Economic Geography. 46(2): 234–240. [15] Wikipedia. 2010. Ruby. Ruby (programming language).