Full paper
Jurnal
Teknologi
Variations of Sea Level and Tidal Behaviour during El Nino/La Nina: An
Example of Malaysian Coastline
Mohd Hilmi Abdullah, Mohd Razali Mahmud, Nor Ainah Amat
Faculty of Geoinformation and Real Estate, Universiti Teknologi Malaysia, 81310 UTM Johor Bahru, Johor, Malaysia
*Corresponding author: [email protected]
Article history
Received :6 February 2014 Received in revised form : 21 December 2014 Accepted :26 February 2015
Graphical abstract
Abstract
The El Nino/La Nina Southern Oscillation (ENSO) phenomenon indirectly provides dramatic changes to tidal that can cause floods, drought and affect various marine activities. Tidal observation data plays important role in determining the characteristic or behaviour of tide along the coastal area especially during sudden climate change such as the phenomenon of El Nino/La Nina, the Northeast Monsoon, Northwest Monsoon and Tsunami. It is important to study the occurrence of the ENSO event and it characteristic so that it can be used for prediction and monitoring the land and water ecosystem. This research is to identify the variations of sea level and tidal behaviour in Malaysian coastline during El Nino/La Nina. The tidal observation data, meteorology data (temperature and mean sea level pressure), and Southern Oscillation Index (SOI) calculation are used to look on the changes of the tidal variation during the ENSO phenomenon. The results of this research will specially benefit in the determination of tidal level in Malaysia and to the professionals who have responsibilities in policy making, agriculture, environmental planning, economics and marine engineering.
Keywords: Meteorology; El Nino/La Nina southern oscillation; climate change; sea level; tides
Abstrak
Fenomena El Nino/La Nina Ayunan Selatan (ENSO) secara tidak langsung memberikan perubahan dramatik terhadap pasang surut yang boleh menyebabkan banjir, kemarau dan menjejaskan pelbagai aktiviti marin. Data cerapan pasang surut memainkan peranan penting dalam menentukan ciri-ciri atau tingkah laku pasang surut di sepanjang kawasan pantai terutamanya semasa perubahan iklim secara mendadak seperti fenomena El Nino / La Nina, Monsun Timur Laut, Monsun Barat Laut dan Tsunami. Adalah penting untuk mengkaji berlakunya peristiwa ENSO dan karakteristik supaya ia boleh digunakan untuk ramalan dan pemantauan ekosistem darat dan air. Kajian ini adalah untuk mengenal pasti variasi paras air laut dan tingkah laku pasang surut di pantai Malaysia semasa El Nino / La Nina. Data cerapan air pasang surut, data kaji cuaca (suhu dan purata tekanan paras air laut), dan pengiraan Indeks Ayunan Selatan (SOI) digunakan untuk melihat kepada perubahan variasi pasang surut semasa fenomena ENSO. Hasil kajian ini akan memberi manfaat khususnya terhadap penentuan aras pasang surut di Malaysia dan untuk para profesional yang mempunyai tanggungjawab dalam membuat polisi, pertanian, perancangan alam sekitar, ekonomi dan kejuruteraan marin.
Kata kunci: Meteorologi; El Nino/La Nina ayunan selatan; perubahan iklim; aras laut; pasang surut
© 2015 Penerbit UTM Press. All rights reserved.
1.0 INTRODUCTION
The occurrence of El Nino/La Nina Southern Oscillation (ENSO) phenomenon has been correlated to the environmental time series such as temperature, atmospheric pressure, winds, and sea level. ENSO is the strongest climate variation on the short range climatic time scale ranging and it is characterised by an irregular inter-annual oscillation of tropical Pacific sea surface temperatures (SSTs) (Latif et al., 1998). The recent highest El Nino was recorded in 1997 and 1998, and followed by La Nina in 1999 and 2000 (Camerlengo, 1999). Several studies on ENSO phenomenon has discovered that the ENSO event is not only affect within the Tropical Pacific but it also effect several part of the world ocean (Horel
dramatic tidal changes that can cause floods and drought which affect various marine activities.
In the early of 1988, Barnett et al. (1988) had studied the changes in the tropical ocean-atmosphere system that give rise to El Nino events. The El Nino event has occurred in 1986-87 at lead times of 3 to 9 months. While Moron et al. (1998) had studied on the global Sea Surface Temperature (SST) to detect the ENSO phenomenon. As a result, they found the ENSO occurrences periods are about 2, 4, and 5 years during 1901-1994. As such, research into ENSO is most suitable for studying ocean and coastal areas (Chen and Genderen, 2008).
occurrence of El Nino and La Nina for the Eastern Pacific ocean. Furthermore, the SOI was also used in monitoring El Nino and La Nina activities by the values of SOI. Through the values of SOI, it can determine the peak and weak of El Nino and La Nina occurrence. The climate affect of ENSO has attracted the attention of Malaysian agencies (eg. Malaysian Meteorological Department, Royal Malaysian Navy, etc). These agencies are responsible to monitor the ENSO climate change. The Peninsular Malaysia, Sabah and Sarawak are surrounded by the South China Sea, Celebes Sea, the Straits of Malacca, the Straits of Johor and the Karimata Strait. Although the sea depth is shallow (located in the Sunda Shelf) compared to Pacific Ocean or Indian Ocean, the surface temperature changes of South China Sea is closely linked to ENSO (Klein et al, 1999). The surface temperature and pressure changes can lead to flood tides or drought. In case of flood tides, it can caused approximately 1200 km2 of Peninsular Malaysia submerged due to dam
failure function (MiNC, 2000). This will also cause the sea level change is higher/lower than normal condition. This occurrence may be due to the El Nino/La Nina phenomenon.
The effect of this phenomenon can also be studied and analyzed using the data of tidal fluctuations in sea level. Tides are the rise and fall of the sea surface caused by a combination of the earth gravitational forces from the moon, sun and earth rotation. In addition, the changes of atmosphere such as the changes of pressure, wind and temperature will affect tidal patterns and tidal activities. For instance, the wind circulation influences the occurrence of sea waves and sea current. The atmospheric pressure and rainfall also affect the fluctuations of the sea surface. The knowledge of meteorological parameters and oceanographic variables in Malaysian coastline are needed to understand the dynamic characteristics and high tides, especially during El Nino/La Nina and global warming.
The Malaysian agencies have established a network of tidal stations since 1983 covering Peninsular Malaysia, Sabah and Sarawak. The main objective of the establishment of tidal network in Malaysia is to observe tides continuously. At least 19 years observations are required to establish proper tidal datum to account all the astronomical and meteorological influences at each tidal station. These include the establishment of mean sea level (MSL) value for each station. In addition, these tidal observations are used for tidal analysis to determine tidal constituents and use for prediction. Besides, the tidal network plays important role in determining the characteristic or behaviour along the coastal area especially during sudden climate change such as the phenomenon of El Nino/La Nina, the Northeast Monsoon, Northwest Monsoon and Tsunami. El Nino/La Nina has significant impact and adverse effects on the ecology of the earth environment including tidal activities.
According to Crawford et al. (1999), the influence of trends and anomalies like El Nino affect the accuracy of tidal constituents. The highest influences that were recorded in long term tidal constituents component (Sa, Ssa, Mf, Mm) are due to the influence of El Nino, wind and
air pressure with high energy during the period. Therefore, this research was carried out in order to identify the effects of El Nino/La Nina on the tidal variation and the tidal prediction in Malaysian coastline. The recorded tidal observation data, meteorology data, tidal processing and analysis, and SOI calculation were used in this research.
2.0 RELATED WORK
Meteorological effects is also a factor affecting tides changes where it relates to weather influences such as atmospheric pressure and wind. The influence of meteorological is correlated with sea-level observation data through three components as specified by the International Oceanographic Commission (IOC) (1985). Three components are the mean sea level (Z0),
tidal components (T), meteorological component(S) and are linked by the following equation (1):-
X = Zo (t) + T(t) + S(t) (1)
The X in the equation refers to the observed sea level, and t refers to the time observation. Crawford (1982) has stated that the influence of meteorology on sea level changes is the response of the sea to the changes in air pressure. The sea level will be decreased when the air pressure increases. At the offshore continental shelf, the sea level is influenced by the wind. When the wind and air pressure are acting together, the increase in sea water will occur more than 1 cm.
The influence of meteorology should be emphasized especially in the determination of tidal datum and observations because the meteorological affects gives significant impact to the tidal changes. A study conducted by
accuracy of tidal constituents such as solar annual constituent (Sa), solar
semi-annual constituent (Ssa), Lunisolar fortnightly constituent (Mf), and
lunar monthly constituent (Mm). The results of constituent error for Sa, Ssa,
Mf, and Mm is high compared to other tidal constituents. Based on his
findings, Crawford (1982) found that effects of wind and high pressure influenced the tidal constituents. Besides, the errors of tidal constituents are also influenced by the occurrences of El Nino phenomenon.
The occurrence of El Nino is one of the meteorological influences of tidal changes in which this event is associated with the movement of the sea level, atmospheric pressure and wind. El Nino is a warm ocean current that replaces the cold ocean currents off the coast of Peru, South America. Impact of El Nino events are indirectly giving sudden tidal changes that can cause flooding, drought, and also endanger marine activities. Similarly, the impact of the La Nina, which gives the same effect as El Nino, but opposite to El Nino nature. Warming waters can contribute to sea level change. According to Muller et al. (2010), 60% of sea level change in the world is warming seawater, and 40% is glaciers.
El Nino is a warming phenomenon of sea water, but also produces extraordinary changes in sea level along the North and South America (Chelton and Davis, 1982). High sea level during El Nino events will give a bad impression. For example, a large wave resulting from the storm that hit the Pacific coast of California during the hours of incredible water level in 1982 and 1983 caused severe erosion in the coastal areas. Douglas (2001) also conducted study of correlation between the mean sea level and the SOI for the San Francisco area. The study has found that the correlation of sea level anomalies with SOI is significant, especially after 1935. While Komar (1998) also stated during El Nino events in 1982 to 1983 and 1997 to 1998, a difference of 0.46 m tidal different forecast. This situation will create high waves and cause coastal erosion and also cause damage and loss of property.
Anie (2010) has studied the impact of sea level during the El Nino and La Nina phenomenon in certain parts of Malaysian coastal areas. Air temperature and rainfall are accounted as meteorological data in order to see its impact to the sea level changes. As the result, the sea level decreased during El Nino at tidal stations in Johor, Penang and Tanjung Gelang. The tidal station in Kota Kinabalu shows that the sea levels are rising due to the influence of the southwest monsoon winds. The study also indicates that the mean sea level is correlated with meteorological parameters.
3.0 DATASET
Selection of observed tide data and meteorology data collection is neccessary and fundamental for this research. The data needed consist of two parts. The main data needed is the observed tidal data from 18 years data collection and they were used from the beginning until the final data processing. The range of selected tidal data starts from 1998 to 2008, in which it includes the year of El Nino and La Nina occurence in Pacific Oceans. The obtained data are in the form of raw digital data and it contains observation time and values of water level which were used for tidal processing and analysis to produce amplitude, phase, tidal constituents and tidal predictions.
Harmonic analysis is the common method used for tidal analysis and prediction. The basis of harmonic analysis for tidal analysis and predictions are based on the following Equation (2) (Schwartz, 2005):
h = H0 + ∑fH cos(at + (V0 t u) –κ) (2)
By using harmonic analysis, the prediction of tidal height (h) at a particular time are required for mean height of water level above the datum used for prediction (H0), mean amplitude of any constituents (H), speed of constituent (a), time (t) which reckoned from some initial epoch, the value of equilibrium arguement of constituents at zero time (V0 t u), and epoch (phase) for constituents (κ), while f in the equation referred to the node factor.
found that the relationship between MSL and SOI is changing in magnitude and range of time scales during an El Nino and La Nina. Further study of the relationship between MSL, SOI, and SST using long-term data acquisition for sea level and temperature needs to be carried out. Regarding the effect of meteorological factors, this study used meteorological data as secondary dataset to see its effect in tidal changes. The meteorological data used in this study is Mean Sea Level Pressure (MSLP) value and was obtained from Monthly Meteorological Observation Data published by Malaysian Meteorological Service.
4.0 METHODOLOGY
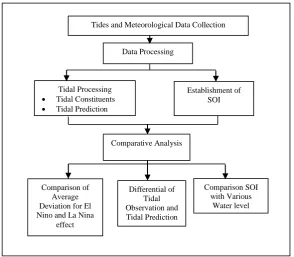
The main purpose of this study is to identify the effect of El Nino/La Nina on tidal variation and tidal prediction. Since this study is related to the tides and climate changes, the methodology and data sources are based on the tidal and meteorological data processing. The detailed methodology developed and used in this study is shown in the flowchart depicted in Figure 1.
As shown in Figure 1, the methodology used in this study consists of three main stages as listed below:
i. Tides and Meteorological Data Collection ii. Data Processing
iii. Comparative Analysis
4.1 Tides And Meteorological Data Collection
As stated in dataset section, tidal data and meteorological data was used in this study. All tide data is obtained from the Department of Survey and Mapping Malaysia (DSMM). Twelve (12) tidal stations are established by DSMM along Malaysian coastline intended to collect tidal data. This study has used tidal data from four (4) tidal stations and the selected tidal stations are shown in Table 1.
The second data used is meteorological data which is Mean Sea Level Pressure (MSLP) data from selected meteorology stations. The selected meteorology stations are close to the tidal stations. In this study, both data are used to examine the meteorological effects on the tidal changes. In addition, the meteorological data are used for the establishment of Southern Oscillation Index (SOI) to study the pattern and behaviour of El Nino and La Nina. The SOI has been widely used to measure the intensity of El Nino and La Nina. Kiladis and Loon (1988) have used SOI to measure the occurrence of El Nino and La Nina for sea area in Eastern Tropical Pacific.
Figure 1 Flow chart of the methodology
Table 1 List of tidal stations
No Station Latitude (N) Longitude (E)
1 Penang Yatch Club, George Town, Penang 5° 25’ N 100° 21’ E 2 Jeti Tanjung Beruas, Tanjung Keling, Melaka 2° 13’ N 102° 09’ E 3 Pelabuhan Kuantan, Tanjung Gelang, Pahang 3° 59’ N 103° 26’ E
4 Pelabuhan Bintulu, Sarawak 3° 16’ N 113° 04’ E
Tides and Meteorological Data Collection
Data Processing
Establishment of SOI
Comparative Analysis
Comparison of Average Deviation for El Nino and La Nina
effect
Differential of Tidal Observation and Tidal Prediction
Comparison SOI with Various
Water level Tidal Processing
Standard Deviation Tahiti = SQRT ∑ (Actual Tahiti SLP-MSLP Tahiti ) 2
Number of months (N)
(5)
4.2 Data Processing
The data processing stages involved tidal processing and establishment of SOI. Tidal processing used tidal data from selected station as stated in Table 1. Here, this data was used to process using tidal software to carry out tidal analysis and prediction. Tidal analysis was used to determine the water level or tidal pattern by producing amplitude and phase. Each of the amplitude and phase consist of tidal constituents where the constituents indicate the type of water level and tidal pattern. Besides, tidal constituents were used in processing to produce tidal prediction. The tidal software employed harmonic analysis method in analysis and tidal predictions. In order to see the effect of ENSO towards the tides, three stages of tidal processing are performed. The first stage involves the processing for normal condition, in which annual tidal data of each station were used to study the tides variation under normal condition. Normal condition means that tidal data are not affected by El Nino and La Nina phenomenon. Based on the provided tidal data, year 1994 is identified as a normal condition data. This is due to the tide height that is not changes significantly. To verify the tides during normal condition in 1994, a set of tidal data in year 1993 were used as sample data to produce tidal prediction for normal condition. The results of the prediction are evaluated by comparing it with the tidal observation results.
Processing of the tidal data during ENSO phenomenon is the second stage of tidal processing. Peak of El Nino and La Nina occurrence was in 1998 and 1999. Tidal data year 1997 and year 1998 were selected as sample data to see the effect of El Nino and La Nina to tides. The tidal prediction using tidal data year 1997 is sample data used to see the effect of El Nino to tide in year 1998. Meanwhile, tidal data year 1998 were used for La Nina occurrence. The results of tidal prediction were then used for comparison analysis between prediction and actual tidal data.
Afterwards, tidal processing is continues by using the three (3) months tidal data from the year of El Nino and La Nina occurrence. The year of El Nino and La Nina data are divided into three months tidal data as follows:
i. Three months tidal data from El Nino (April-June 1997, July-September 1997, October-December 1997, January-March 1998). ii. Three months tidal data from La Nina (April-June 1998,
July-September 1998, October-December 1998, January-March 1999).
Three months data was used for tidal processing in order to examined the effects of El Nino and La Nina on tides especially when the prediction compared to the actual tidal data. The details of El Nino and La Nina effects can be clearly seen from the difference value between three months data of prediction and actual tidal data.
The graph between tidal prediction and observation during normal condition, El Nino and La Nina phenomenon, and three months El Nino and La Nina phenomenon also plotted in order to see the different of the comparison in graphically. Moreover, the tidal patterns were clearly understood and analysed graphically. Through the graph, an analysis of tidal pattern during El Nino and La Nina are evaluated.
The second phase is the establishment of SOI in order to determine El Nino and La Nina occurrence. The establishment of SOI is performed by using Mean Sea Level Pressure and it was originally adapted based on the difference of monthly air pressure fluctuations between Darwin and Tahiti
(Walker and Bliss 1932; Barnston et al., 1997). The SOI is calculated using Equation (3).
SOI = (Standardized Tahiti – Standardized Darwin) Monthly Standard Deviation (MSD) (3)
The standardized Tahiti is calculated using Equation (4) :
Standardized Tahiti =
(Actual Tahiti SLP) - ( MSLP Tahiti) Standard Deviation Tahiti
(4)
The value of Sea Level Pressure (SLP) and Mean Sea Level Pressure (MSLP) is obtained from meteorological data. Meanwhile, standard deviation is calculated from Equation (5).
In this study, the standardized Darwin is replaced with Malaysia meteorology stations near to tide gauge stations. For instance, the standardized Darwin is replaced by standardized Penang. The occurrence of El Nino and La Nina based on SOI values can be determined from the SOI scale. Upon obtaining the SOI values, a graph was plotted to display the SOI values graphically. This index will then be used to relate the tidal pattern for all selected tidal stations.
4.3 Comparative Analysis
Comparative analysis is the last stage of this study. The comparative analysis included comparison of average deviation for El Nino and La Nina effect, differential of tidal observation and prediction, and comparison SOI with various water levels. The results of comparative analysis are discussed in the next section.
5.0 RESULTS AND DISCUSSION
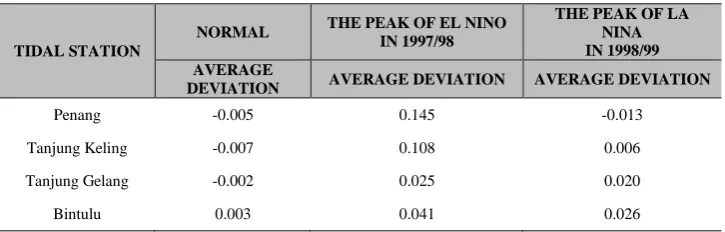
The peak for El Nino in 1997/1998 and the peak for La Nina in 1998/1999 are selected as sample periods for this research. Yearly and monthly analysis were carried out and analysed. This is to identify accurately the tidal constituents for different time periods. A comparative analysis was plotted for easy graphical representation. The result of the average deviation for El Nino effect in year 1997 to 1998 and La Nina effect in year 1998 to 1999 is shown in Table 2. Table 3 shows the result of the average deviation for El Nino Effect for every 3 months for year 1997 to 1998. Meanwhile, Table 4 shows the result of the average deviation for La Nina phenomena for every three (3) months for the years 1998 to 1999.
Table 2 Theaverage deviation for El Nino and La Nina effect
TIDAL STATION
NORMAL THE PEAK OF EL NINO IN 1997/98
THE PEAK OF LA NINA IN 1998/99 AVERAGE
DEVIATION AVERAGE DEVIATION AVERAGE DEVIATION
Penang -0.005 0.145 -0.013
Tanjung Keling -0.007 0.108 0.006
Tanjung Gelang -0.002 0.025 0.020
Table 3 The average deviation of Tidal Data for El Nino effect
Tidal Station April-June 1997
July-Sept 1997
Oct-Dec 1997
Jan-March 1998
Penang 0.114 0.151 0.169 0.162
Tanjung Keling 0.092 0.147 0.170 0.162
Tanjung Gelang 0.092 0.122 0.137 0.128
Bintulu 0.063 0.061 0.069 0.077
Table 4 The average deviation for La Nina effect
Tidal Station April-June 1998 July-Sept 1998
Oct-Dec 1998
Jan-March 1999
Penang -0.008 0.014 -0.017 -0.041
Tanjung Keling 0.003 0.022 0.003 -0.007
Tanjung Gelang 0.015 0.015 0.018 0.034
Bintulu 0.017 0.024 0.025 0.026
The value of the average deviation for each station was obtained from the difference of tidal observation and tidal prediction. Predictions on tidal data for selected tidal stations were made to find the average differences of effect on El Nino and La Nina phenomenon. The difference of tidal
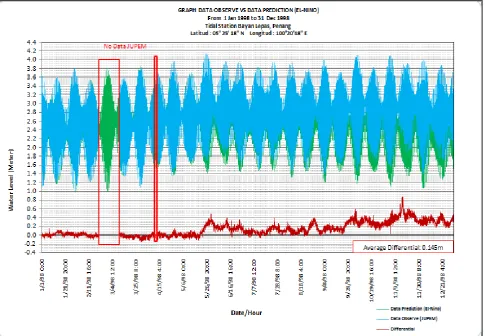
observation and tidal prediction during El Nino and La Nina phenomenon was plotted in the graph to display the tidal pattern during ENSO event. Figure 2 shows the graph difference of tidal observation and tidal prediction at Bayan Lepas, Penang, during El Nino Effect in 1998.
Based on Figure 2, the graph shows that the tidal pattern for tidal predictions is not the same as the actual data observed by JUPEM. The average difference of tidal prediction and data observation is 0.150 m. The graph for other stations such as Tanjung Keling, Tanjung Gelang, and Bintulu are also plotted to see the tidal pattern.
Figure 3 shows the differential graph for Tanjung Keling, Melaka. The average differential of tidal prediction and tidal observation at Tanjung Keling, Melaka (Figure 3) is 0.108 m. This means, the occurrence of El Nino in 1997 also affecting tidal prediction pattern where the results of tidal prediction is lower than the actual tidal observation.
Meanwhile, in Figure 4 shows the average differential of tidal prediction and tidal observation at Tanjung Gelang. At Tanjung Gelang, the tidal prediction is lower than tidal observation as 0.025 m. Compared to Tanjung Keling, affect of El Nino event to tides at this area is less than Tanjung Keling.
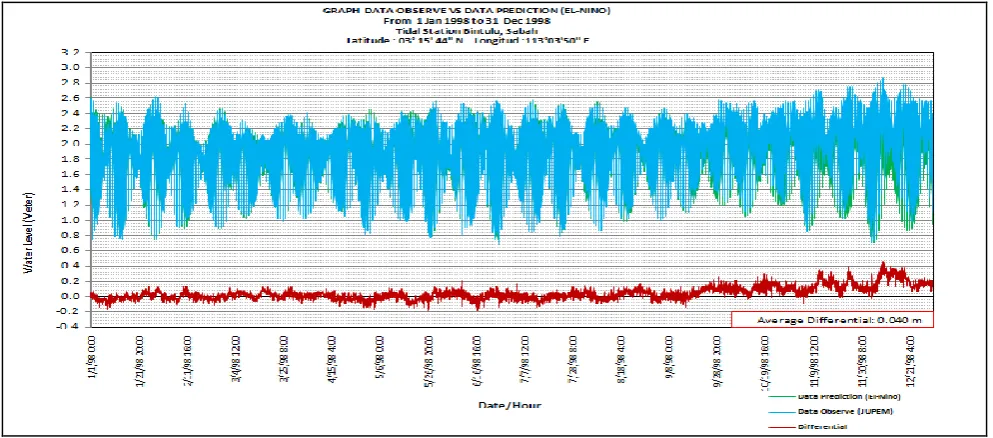
In Bintulu, the graph (Figure 5) shows the differential for Bintulu is 0.040 m. The differential derived from the result show that El- Nino event that occurred at Bintulu in 1997 was affecting tidal prediction in 1998.The same graph as plotted for El Nino phenomenon is also plotted for La Nina phenomenon.
The differential graph for station Bayan Lepas, Penang are plotted and shown in Figure 6. The graph (Figure 6) shows that the tidal pattern between tidal prediction and tidal observation is not consistent. The average differential for station Bayan Lepas, Penang is -0.013 m. This indicates that the existence of the La Nina event in 1998 resulted in significant changes in tidal prediction in 1999.
The differential graph for Tanjung Keling, Tanjung Gelang, and Bintulu is shown in Figure 7, Figure 8, and Figure 9. The graph for Tanjung Keling, Melaka (Figure 7) shows the average differential of tidal prediction and tidal observation is 0.006 m. The differential is less than 1 cm. Compared to Penang, the prediction for Melaka shows that the La Nina event does not give a significant impact to Tanjung Gelang. The differential of tidal prediction and tidal observation for Tanjung Gelang and Bintulu is not similar to the Tanjung Keling. Figure 8 shows the differential graph for Tanjung Gelang, Pahang. The average differential of tidal prediction and tidal observation for Tanjung Gelang is 0.020 m. This indicates that there is the occurrence of La Nina at Tanjung Gelang and the affect of La Nina to tides is not strong.
In Bintulu, the presence of La Nina also can be seen from the graph plotted in Figure 9. However, the affect of La Nina to tides is not strong and it shows the average differential is 0.026 m which is more than 1 cm.
Figure 3 Differential graph for tidal observation and tidal prediction at Tanjung Keling, Melaka during El Nino effect
Figure 5 Differential graph for tidal observation and tidal prediction at tidal station Bintulu, Sabah during El Nino effect
Figure 7 Differential graph for tidal station Tanjung Keling, Melaka during La Nina effect
Figure 9 Differential graph for tidal station Bintulu, Sabah during La Nina effect
.
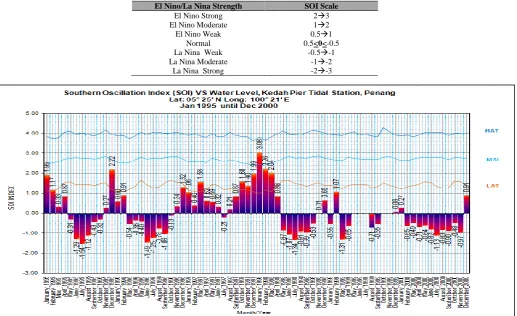
This study has also established the Southern Oscillation Index (SOI) to define the pattern and behaviour of El Nino and La Nina.The results of SOI are compared with various water levels such as Monthly Highest Water Level, Monthly Mean Sea Level Water Level, and Monthly Lowest Sea Level and plotted in a graph to show the pattern and behaviour of El Nino and La Nina.
Furthermore, the SOI is also used to define the strength of El Nino and La Nina occurrence. The positive (+ve) value of the SOI shows the El
Nino phase, while the negative (-ve) value shows the La Nina phase (Shabbar and Khandekar, 1996). Table 5 shows the scale of SOI to determine the strength of El Nino and La Nina which consist of strong, moderate, weak, and normal condition.
The graph of comparison between SOI and various water levels for station Penang is plotted and shown in Figure 10. The graph also includes the scale of SOI to show the strength of El Nino and La Nina phenomenon.
Table 5 The scale of SOI to determine the strength of El Nino and La Nina
El Nino/La Nina Strength SOI Scale
El Nino Strong 23
El Nino Moderate 12
El Nino Weak 0.51
Normal 0.5<0<-0.5
La Nina Weak -0.5-1
La Nina Moderate -1-2
Based on Figure 10, the graph shows that the El Nino phenomenon began in March 1997 with the index at level 1.58. This also indicates that the strength of El Nino was moderate and then became weak during April and May 1997. In June, July and August 1997, the index becomes normal with the index 0.32, -0.21 and 0.21. The El Nino started again in September 1997 but this time the El Nino started weak with the index 0.87 and became moderate in October until December 1997. Then the El Nino increased to the maximum in January 1998 with the index at 3.08 and on that time the El Nino was strong.
Until March 1998, the SOI graph shows the strong El Nino with index 2.04. The El Nino ended in April 1998 and the SOI graph shows that the El Nino index at 0.88. Afterwards, it was followed by the occurrence of La Nina in May 1998 with index -0.87. The moderate La Nina occurred during the following month (June 1998) at index -1.07 and the weak level occurred in August, September, and October 1998. The SOI graph was also plotted for the other stations such as Melaka, Tanjung Gelang (Pahang) and Bintulu (Sarawak). Figure 11 shows the SOI graph for Tanjung Keling, Melaka.
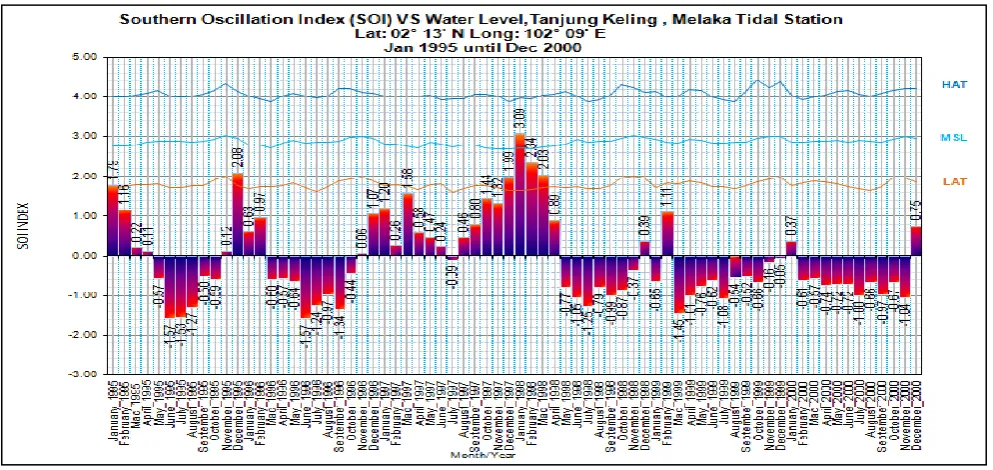
Figure 11 Comparison SOI index and various water level at Melaka Station
The graph in Figure 11 shows that El Nino phenomenon at the meteorological station of Melaka started in March 1997 with index of 1.58. The graph shows the strength of El Nino was weak in April 1998 with the index of 0.58. In April 1997, the index was 0.47 which shows the normal condition until May, June, July, and August 1997. Then, the El Nino event returned to a weak level in October 1997 at index 0.80 and increased to a maximum in January 1998 at index 3.09. The strong El Nino continuous in February 1998 and it ended in March 1998. After that, the El Nino returned to a weak level in April 1998 at index 0.89. Then, it was followed by the occurrence of La Nina at weak level during May 1998 at index -0.77. The La Nina became moderate in June with index -1.05 and returned to weak in August with index -0.79. The weak level of La Nina ended in October 1998 and back to normal condition in November 1998. In March 1999, the SOI graph shows the return of moderate La Nina and the index at -1.45 the La Nina ended in October 1999. Then, it continues in February 2000 and stopped in December 2000. Based on the SOI result, it can be seen that the La Nina occurrence in 1998 is the most significant changes compared to the La Nina in 1999 and 2000.
Figure 12 shows the SOI graph for the meteorological station at Kuantan. The graph (Figure 12) of the SOI shows that the El Nino phenomenon began in April 1997 with its index at 0.95 and El Nino became moderate in May to June 1997. The SOI increased in July 1997 with index of 2.86, but the level El Nino became strong. The following month (August 1997) also shows that the El Nino was at a strong level. In October 1997, the El Nino became weak and then was followed by the
Figure 12 Comparison SOI index and various water level at Kuantan Station
Figure 13 Comparison SOI index and various water level at Bintulu Station
6.0 CONCLUSION
El Nino and La Nina or known as the El Nino Southern Oscillation phenomenon contribute significantly to climate change and it can cause sea levels changes dramatically. This phenomenon occurs due to the changes in temperature and air pressure at the Pacific Ocean. El Nino is a warm phase which has high surface air pressure and hot waters at the El Nino areas while La Nina is the cold phase which is opposite phase of El Nino. The change in sea level is associated with tidal data which is used to determine the datum and water levels. In addition, the tides are used to make predictions on future water levels. If there are any changes to the sea level, there is also a change on tides. Tidal analysis usually used harmonic analysis in producing tidal prediction but the meteorological factors are not accounted in the analysis. As a consequence, the effects of El Nino and La Nina are negligible in the calculation of tidal predictions. This study has taken the initiative to investigate the effect of this phenomenon on tides and also to analyze the relationship between ENSO phenomenon and tidal predictions. The result of this study shows that the tidal data and meteorological data help to define the El Nino and La Nina
mean sea level values were higher than its yearly mean values during the occurrence of La Nina. The effect of ENSO also affects the accuracy of predictions in which the tidal prediction produced from observation data during an El Nino and at the time of La Nina. Based on these four stations, the predicted values show clear evidence of being influenced by El Nino or La Nina phenomena even though the data from these four stations showed some promising pattern where predicted values were overestimated during El Nino and underestimated during La Nina. Therefore, this matter should be monitored from time to time due to events like El Nino and La Nina that can lead to flooding or other natural disaster. Results and analysis of this study can serve as a reference for improving future research.
Acknowledgement
References
[1] Barlow, R., O’Brien, T. and Atkinson, P. 2002. Experience using a Dynamic Under Keel Clearance System at Port Taranaki, New Zealand. 3rd Congress of The International Harbour Masters’ Association. May 2002. Cape Town, South Africa.
[2] Barnett, T. P. Graham, N., Cane, M., Zebiak, S., Dolan, S., Legler, D. O'Brien, J. 1988. On the prediction of the EI Nino of 1986-1987.
Science. 241: 192–196.
[3] Barnston, A. C., Chelliah, M., and Goldenberg, S. B. 1997. Documentation of a Highly ENSO-Related SST Region in the Equatorial Pacific. Atmosphere-Ocean. 3(35): 367–383.
[4] Camerlengo, A. L., 1999. Sea Level Variations due to both El Niño and
La Niña and its Relation with Certain Meteorological Parameters in
Malaysia. Asia Pacific Journal on Environmental and Development.
6(2): 49–66.
[5] Crawford, W. R., Cherniawkey, J., Foreman, M. and Chandler, P. 1999.
El Nino Sea Level Signal along the West Coast of Canada. Scientific Report No. 10, North Pacific Marine Science Organization (PICES), Sidney, British Columbia, Canada.
[6] Horel, J. D. and Wallace, J. M. 1981. Planetary Scale Atmospheric Phenomena Associated with the Southern Oscillation. Weather Review.
109: 813–829.
[7] Kiladis, G. N., and Loon, H., 1988. The Southern Oscillation. Part VII:
Meteorological anomalies over the Indian and Pacific Sectors Associated with the Extremes of the Oscillation. Monthly Weather Review. 116: 120–136.
[8] Klein, S. A., Soden, B. J., Lau, N. C. 1999. Remote Sea Surface Temperature Variations during ENSO: Evidence for a Tropical Atmospheric Bridge. Journal of Climate. 12: 917–932.
[9] Latif, M., Anderson, D., Barnett, T., Cane, M., Kleeman, R., Leet-maa,
A., O’Brien, J., Rosati, A., and Schneider, E. 1998. A Review of the
Predictability and Prediction of ENSO. Journal of Geophysical
Research. 103: 14 375–14 393.
[10] Lau, N. C., and Nath M. J. 1996. The Role of the "Atmospheric Bridge" in Linking Tropical Pacific ENSO Events to Extra Tropical SST Anomalies. Journal of Climate. 9: 2036–2057.
[11] Malaysia Initial National Communication (MiNC), 2000. Report submitted to the United Nations Framework Convention on Climate Change.
[12] Moron, V., Vautard, R., Ghil, M. 1998. Trends, Interdecadal and Interannual Oscillations in Global Sea-Surface temperatures. Climate
Dynamic. 14: 545–569.
[13] Namias, J., and Cayan, D. R. 1984. El Nino: Implications for Forecasting. Oceanus. 27: 41–47.
[14] Redmond, K. T. and Koch, R. W, 1991. Surface Climate and Streamflow Variability in the Western United States and their Relationship to Large Scale Circulation Indices'. Water Resources. 27: 2381–2399.
[15] Ropelewski, C. F. and Halpert, M. S. 1996. Quantifying Southern Oscillation Precipitation Relationship. Journal of Climate. 9: 1043–1059. [16] Shabbar, A., and Khandekar, M. 1996. The impact of El Nino–Southern Oscillation on the Temperature Feld over Canada. Atmosphere–Ocean.
34(2): 401–416.
[17] Chen, S. P., and Genderen, J. 2008. Digital Earth in Support of Global Change Research. International Journal of Digital Earth. 1(1): 43–65. [18] Trenberth, K. E., 1997. The Definition of El Nino. Bulletin American
Meteorological Society. 78: 2771–2777.
[19] Walker, G. T., and Bliss, E. W. 1932. World Weather V. Memoirs of the
Royal Meteorological Society. 4: 53–84.