ABSTRACT
ECHEVERRIA, DARLENE VANESSA. Comparative Life Cycle Assessment of Peracetic Acid Production Pathways Bleaching in the Pulp and Paper Industry. (Under the direction of Dr. Yuan Yao and Dr. Richard Venditti).
The goal of this research is to assess the environmental impacts of Peracetic Acid (PAA) used as a bleaching agent for bleached kraft pulp production. Pulp bleaching is one of the largest sources of wastewater generation in the pulp and paper industry. PAA is a promising bleaching agent that can be used in the Total Chlorine Free (TCF) bleaching technology to eliminate AOX in effluents, to reduce water consumption and wastewater discharge. Although PAA is
considered as an environmentally friendly bleaching agent, few studies have quantified the overall environmental impacts of PAA production and its application as a bleaching agent in TCF compared to the traditional Elemental Chlorine Free (ECF) bleaching technology.
In this study, a comparative Life Cycle Assessment (LCA) of kraft pulp production was performed to compare the environmental impacts of pulp bleached by TCF using PAA and by ECF technology using ClO2. The environmental impacts of PAA produced from two different
pathways (i.e., acetic acid pathway and triacetin pathway) were assessed. Life Cycle Inventory (LCI) data was collected from lab experiments using PAA (achieving an average pulp ISO brightness of 84%), process simulation tools (e.g. WinGEMS, Aspen Plus) and LCI databases including Ecoinvent.
Comparative Life Cycle Assessment of Peracetic Acid Production Pathways Bleaching in the Pulp and Paper Industry
by
Darlene Vanessa Echeverria
A thesis submitted to the Graduate Faculty of North Carolina State University
in partial fulfillment of the requirements for the degree of
Master of Science
Forest Biomaterials
Raleigh, North Carolina 2018
APPROVED BY:
_______________________________ _______________________________ Yuan Yao Richard Venditti
Committee Chair Committee Chair
DEDICATION
I would like to dedicate this accomplishment to my family. My parents who have been the biggest support I could have ever asked for, to my brothers because even if we are in
different places I have them present in my heart. To my aunts, my musketeers who have always been there for me. To Sean for his support and help. Finally, my long life friends Daniela, Marivi, Eddy, Javier, Andrea, Mivi and Marielis, even if we are all apart we all know that some friendships last a lifetime.
BIOGRAPHY
Darlene was born in Honduras, she moved at an early age to Venezuela, country that she has chosen as her home. She received a B.S. in Chemical Engineering in 2014 from the
University of Los Andes in Merida, Venezuela.
During Darlene’s undergraduate thesis project in 2013, the positive reception received when her research article was accepted at the Mexican Association of Control and Automation (AMCA), directed her into pursuing academic research. An understanding of industrial processes was gained during her experience working for Empresas Polar C.A., the biggest brewery
company in Venezuela (2013 - 2014). Among other accomplishments, in 2012, Darlene was awarded a scholarship by the German Academic Exchange Service (DAAD), hosted by the Technical University of Berlin in Germany.
Some of Darlene’s non-academic interests have also served to fortify her skills and prepare her to meet professional goals. For many years, she was a member of a non-profit exchange organization called American Field Service (AFS, Intercultural Programs). She
participated in an exchange scholar program in Italy, where she learnt Italian. She studied French as an extra academic hobby during her undergrad achieving a B2 level (highest level). Moreover, interested in cultures and languages Darlene volunteered assisting foreign exchange students through one-to-one communication and organized trips and activities.
Currently, she is a graduate student research assistant in the Department of Forest Biomaterials at North Carolina State University in Raleigh, NC. Darlene has been conducting a Life Cycle Assessment (LCA) to evaluate the environmental impacts of pulp and paper
ACKNOWLEDGEMENTS
I would like to thank Eastman Chemical Company for supporting this research work that has opened a door of opportunities for me, especially to the Eastman team Barclay, Kevin and Ned, for following my research progress during all this year and a half.
I would not be more fortunate to have Dr. Yao, Dr. Venditti and Dr. Jameel as my advisors during this research project. Dr. Yao for allowing me the opportunity to join her research team and being her first student. It has been a great learning curve. Dr. Venditti for believing in me, I will be deeply grateful with you for this opportunity. Dr. Jameel who has taught me a lot about the pulp and paper industry, I consider him a very knowledgeable person and someone I can count on to ask for advice.
I want to give a special thanks to Neethi Rajagopalan, who has taught about LCA during my first months in the program, and for continuing to help me from the other side of the ocean. To Tiago De Assis for teaching me all I know about WinGEMS, for his patience and guidance. To Linda McMurray for training and teaching me how to perform the bleaching experiments, such a great person to work with and to mike for helping with the bleaching cylinders when I needed to.
Finally, it is not easy to move to a new place and to find such an awesome group of people; I would like to thanks my future colleagues and friends from the Department of Forest Biomaterials: Marielis Zambrano, Carolina Londono, Camilla Abbati, Preeti Tyagi, Shelly Johnson, Juliana Jardim, Kai Lan, Mochen Liao, Sachin Agate, Maria Alejandra Herrera and Franklin Zambrano. Lastly, I would like to thanks the Department of Forest Materials
TABLE OF CONTENTS
List of Tables……….……….………....vi
List of Figures……….…..……….vii
1 Introduction ……… ...1
2 LITERATURE REVIEW………. ...5
2.1 Pulp and paper industry ...5
2.2 Kraft pulping process ...5
2.2.1 Wood yard operations ...6
2.2.2 Pulping process ...6
2.2.3 Bleaching ...7
2.2.3.1 Bleaching technologies ...10
2.2.4 Chemical Recovery Plant ...11
2.2.5 Powerhouse Plant ...12
2.3 Life Cycle Assessment Framework ...12
2.3.1 Goal and scope ...13
2.3.2 Life Cycle Inventory Analysis (LCI) ...14
2.3.3 Life Cycle Impact Assessment (LCIA)...14
2.3.3.1 Impact categories ...15
2.3.4 Interpretation ...16
2.3.5 LCA tools, software and database requirements ...17
2.4 LCA studies for the pulp and paper industry ...17
3 LCA OF PERACETIC ACID………….. ...23
3.2 Goal and Scope ...24
3.3 Functional Unit ...25
3.4 System Boundaries ...25
3.5 Life Cycle Inventory (LCI) ...25
3.5.1 Feedstock used in the production of PAA ...26
3.5.2 Production of PAA ...28
3.5.2.1 Production of PAA from acetic acid pathway (ePAA) ...28
3.5.2.2 Production of PAA from triacetin pathway (tPAA). ...30
3.6 LCIA for the production of PAA ...32
3.7 Conclusions ...35
4 BLEACHING EXPERIMENTS………… ...37
4.1 Introduction ...37
4.2 Experimental Procedure ...38
4.2.1 Materials ...39
4.2.2 Bleaching Technologies ...40
4.2.2.1 TCF Bleaching ...40
4.2.2.2 ECF bleaching ...41
4.3 Results ...42
4.4 Conclusions ...48
5 LCA OF BLEACHED KRAFT PULP PRODUCTION ...49
5.1 Introduction ...49
5.2 Goal and Scope ...50
5.4 System boundary ...51
5.5 Life Cycle Inventory Analysis ...55
5.6 LCIA for bleached kraft pulp production ...57
5.7 Conclusions ...65
6 CONCLUSIONS………...67
7 REFERENCES………. ...70
APPENDICES……… ...79
Appendix A ...80
Appendix B ...81
Appendix C ...85
Scenario TCF using tPAA (100% triacetin in excess) ...86
Scenario TCF using tPAA (50% triacetin in excess) ...91
Scenario TCF using ePAA ...96
Scenario ECF using ClO2 ...102
LIST OF TABLES
Table 1. Commercially important bleaching chemicals 3,24 ...9
Table 2. Bleaching sequences using PAA in TCF technology ...11
Table 3. Summary of the Environmental impact categories following WBCSD. 17 ...15
Table 4. LCA studies for pulp and paper products ...21
Table 5. LCA studies for pulp and paper products ...22
Table 6. Inputs and outputs for the production of 1 ton of triacetin ...28
Table 7. Three scenarios of PAA production.6 ...29
Table 8. LCI Inputs and outputs for ePAA production, conversion of 70% HP to PAA. ...30
Table 9. Scenarios for the production of tPAA from triacetin pathways ...31
Table 10. LCI of scenario 1 for tPAA production, 97% conversion HP to PAA. ...31
Table 11. LCIA results for PAA production from ePAA (case 2) and tPAA scenarios ...32
Table 12. Hotspot analysis for the production of tPAA (50% triacetin in excess) (%) ...33
Table 13. Hotspot analysis for the production of ePAA (molar ratio AA to HP 2:1) (%) ...33
Table 14. Hotspot analysis for the production of tPAA (100% triacetin in excess) (%) ...34
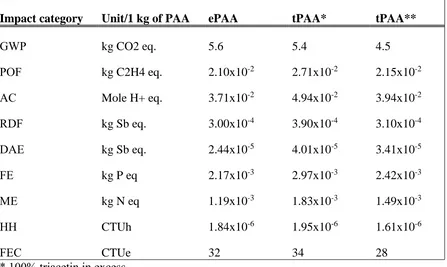
Table 15. LCIA results for PAA production from ePAA and tPAA (using glycerin from soybean as raw material for triacetin production) ...35
Table 16. Operating conditions for TCF bleaching sequence ...41
Table 17. Operating conditions for ECF bleaching sequence ...42
Table 18. Inputs for the production of one ADmt of bleached pulp ...56
Table 19. Outputs for the production of one ADmt of bleached pulp ...57
triacetin excess) (%) ...63
Table 22. Hotspots analysis one ADmt of bleached pulp, ECF (ClO2) (%) ...64
Table 23. Hotspots analysis 1ADmt of bleached pulp. Using TCF ePAA (%) ...64
Table 24. Hotspots analysis 1ADmt of bleached pulp. TCF, tPAA 100% triacetin in excess (%) ...65
Table 25. Scenario TCF using tPAA (100% triacetin in excess) Part I ...86
Table 26. Scenario TCF using tPAA (100% triacetin in excess) Part II ...87
Table 27. Scenario TCF using tPAA (100% triacetin in excess) Part III ...88
Table 28. Scenario TCF using tPAA (100% triacetin in excess) Part IV ...89
Table 29. Scenario TCF using tPAA (100% triacetin in excess) Part V ...90
Table 30. Scenario TCF using tPAA (50% triacetin in excess) Part I ...91
Table 31. Scenario TCF using tPAA (50% triacetin in excess) Part II...92
Table 32. Scenario TCF using tPAA (50% triacetin in excess) Part III ...93
Table 33. Scenario TCF using tPAA (50% triacetin in excess) Part IV ...94
Table 34. Scenario TCF using tPAA (50% triacetin in excess) Part V ...95
Table 35. Scenario TCF using ePAA Part I ...97
Table 36. Scenario TCF using ePAA Part II...98
Table 37. Scenario TCF using ePAA Part III ...99
Table 38. Scenario TCF using ePAA Part IV ...100
Table 39. Scenario TCF using ePAA Part V ...101
Table 40. Scenario ECF using ClO2 Part I ...102
Table 41. Scenario ECF using ClO2 Part II ...103
Table 43. Scenario ECF using ClO2 Part IV ...105
Table 44. Scenario ECF using ClO2 Part V ...106
Table 45. LCIA results per one ADmt of bleached pulp, bio-based triacetin in
LIST OF FIGURES
Figure 1. Water use by process area in an integrated kraft bleached paper mill.28 ...10
Figure 2. Life Cycle Assessment Framework 32 ...13
Figure 3. Cradle-to-gate LCA system boundary for the production of peracetic acid ...25
Figure 4. Triacetin production flow diagram ...27
Figure 5. Bleaching experiments test ...39
Figure 6. ColorTouch X, ISO Color Spectrophotometry. 60 ...40
Figure 7. Experimental bleaching procedure using ePAA and tPAA ...42
Figure 8. Hand sheets from bleaching sequence using ePAA and tPAA ...43
Figure 9. Handsheets from ECF bleaching sequence ...44
Figure 10. ISO Brightness for bleaching stages prior to PAA application ...45
Figure 11. ISO Brightness average trials for bleaching stages with ePAA and P (H2O2) ...46
Figure 12. Bleaching stages with tPAA and H2O2 ...47
Figure 13. Brightness for ECF bleaching versus ClO2 chemical charge. ...48
Figure 14. LCA System boundaries for the production of bleached pulp ...52
Figure 15. Contribution analysis for TCF using tPAA 50% triacetin in excess ...60
Figure 16. Contribution analysis. ECF using ClO2 ...61
Figure 17. Contribution analysis for TCF (ePAA) ...61
Figure 18. Contribution analysis for TCF tPAA 100% triacetin in excess. ...62
Figure 19. Kraft Pulping Process Simulated in WinGEMS...81
Figure 20. TCF bleaching plant diagram from WinGEMS simulations using ePAA. ...82
Figure 21. TCF bleaching diagram from WinGEMS simulations using tPAA. ...83
CHAPTER I
1 Introduction
In recent decades, consumers and government regulators have pushed producers in all fields towards more sustainable environmentally friendly products and production methods. The Pulp and paper industry as one of the most important industries in the world has been following this trend to find more environmental approaches to reduce waste and emissions. Moreover, the manufacturing of pulp and paper products requires large amounts of industrial water
consumption, which generates significant quantities of discharges to air and rivers. For example, freshwater consumption in pulp and paper mills range from 9 to 90 m3/ton of pulp (average ~30
m3/ton) and 1.5-65 m3/ton of paper (average ~10 m3/ton).1 A typical 1000 tons/day mill will consequently consume around 40,000 m3/day. As bleaching process is one of the largest
contributors to mills’ water consumption and wastewater discharge, intensive efforts have been made by the industry and academia in the past decades to improve the bleaching processes. Two main bleaching technologies dominate pulp and paper production. As of 2012, 93% of the worldwide chemical pulp was produced with Elemental Chlorine-Free (ECF) bleaching process,2 which utilizes chlorine dioxide as its main bleaching agent, while about 5% was produced with Total Chlorine-Free (TCF)2. The bleaching chemicals used in TCF are oxygen, ozone, hydrogen peroxide and Peracetic Acid (PAA).3
different industrial methods, such as equilibrium solutions, distilled PAA, oxidation of acetaldehyde and a new chemistry mixture with an acetyl donor that will be explained in this study. Traditionally, PAA is in an equilibrium solution with AA, HP and water in the presence of a catalyst to accelerate the reaction, usually sulfuric acid (SA).6 The PAA equilibrium solution
can be further distilled to produce a PAA solution in water (dPAA) with grades in a range of 25 to 40% weight. 5,6 The oxidation of acetaldehyde was described by Williamson back in the 50s7.
A new technology developed in recent years involves the use of triacetin -an acetyl donor-, which is a non-reversible reaction with HP in the presence of an alkaline solution used to accelerate the reaction; the final product is a peracid solution prepared at the point of use. 8
The uses of PAA are very broad; they include many industrial applications such as textile bleaching, delignification of fibers, institutional laundries, pulp delignification, and as a
bleaching agent. Previous studies indicated that compared to other agents, PAA does not produce
toxic by-products while still having a high selectivity in removing lignin, and brightens pulp to industry requirements.9–11 Previous Life Cycle Assessment (LCA) studies of pulp and paper
products have not reported using peracetic acid as part of their bleaching sequences, despite the fact that many experimental studies 9,12–15 have quantified using PAA as a bleaching agent as
mentioned previously. Furthermore, few of previous studies have evaluated the environmental
impacts of PAA produced from different pathways.
In this study, two LCAs are developed to address the knowledge gaps that have not been provided by previous studies. First, a cradle-to-gate LCA is developed to compare the
TCF bleaching technology for bleached kraft pulp production. Thus, a second cradle-to-gate LCA is developed to assess the environmental impacts of pulp production bleached by TCF, and compared to a traditional ECF bleaching process. Experimental work is conducted at a lab-scale to test the performance of PAA (ePAA and tPAA) as a bleaching agent in achieving industrial brightness requirements similar to ClO2 the traditional bleaching agent. In order to make a fair
comparison, an ISO brightness of 84% is the target for both bleaching systems. The lab-scale experiments can provide the chemical charges required as inputs in the simulation of the mill plant model. The simulation model is developed in WinGEMS,16 a software designed for the
pulp and paper industry, and used to collect the mass and energy balance for the Life Cycle Inventory (LCI).
In the Life Cycle Impact Assessment (LCIA), characterization methods are chosen for this study based on the World Business Council for Sustainable Development (WSBCD) for the chemical sector.17 The nine impact categories are: global warming, photochemical ozone
formation, air acidification, resource depletion - fossil fuel, depletion of abiotic - elements, freshwater eutrophication, marine eutrophication, human health and freshwater ecotoxicity. In addition, hotspot analysis is performed to identify the key life cycle stages contributing the results of the environmental impacts for the PAA production, and the uses of PAA as a bleaching agent in the bleached kraft pulp production. This is the first LCA that evaluates the
environmental impacts of PAA production from two pathways and the uses of PAA as bleaching agent in a TCF technology for the pulp and paper industry.
partnership among PAA producers and the pulp and paper industry for decision-making and process optimization. The information in this study is structured in the following order; Chapter II presents an introduction of the unit operations in the pulp and paper industry, specifically the kraft pulping process, the LCA framework and the LCA studies of pulp and paper products. Chapter III shows the LCI data is collected to perform the LCA for PAA production from the acetic acid pathway and triacetin pathway. In Chapter IV, experimental bleaching of pulp trials are conducted for ePAA and tPAA, and compared to traditional bleaching with ClO2. Chapter V
presents the LCA of bleached kraft pulp production using PAA as a bleaching agent in a TCF bleaching technology, compared to a traditional ECF process. Finally in Chapter VI the overall conclusions and suggestions for future work are presented.
CHAPTER II
2 LITERATURE REVIEW
2.1 Pulp and paper industry
The global pulp and paper industry reached a new high production of 406.5 million tons of paper and paperboard in 2015.18 Pulp mills produce pulp from wood and other materials such as recycled paper. Paper mills and paperboard mills manufacture paper and paperboard
respectively from wood and other fiber pulp. About 70-80% of U.S. virgin pulp is produced using the Kraft pulping process. 19 The large-scale production of pulp and paper products generates a significant amount of wastes and emissions, and is one of the most environmentally regulated sectors in the U.S. Error! Reference source not found. presents a kraft pulping process diagram with the main areas from a paper mill located in Venezuela.
2.2 Kraft pulping process
In 1879, Dahl, a German chemist, used sodium sulfate as a makeup chemical for soda pulping to regenerate sodium hydroxide (NaOH), instead of sodium sulfide (Na2S). It
unexpectedly gave a faster delignification and a stronger pulp, since shorter times are used allowing less carbohydrate degradation. This led to the kraft process, which is now a dominant process. Kraft pulping is a full chemical pulping method using sodium hydroxide and sodium sulfide at pH above 12, at 160-180 C, corresponding to about 800kPa (120psi) steam pressure, for 0.5-3 hours to dissolve much of the lignin of wood fibers. It is useful for any wood species, gives high strength pulp, is tolerant to bark and has an energy and chemical recovery cycle. 19
The kraft pulping process has some disadvantages compared to other pulping processes (i.e., sulfite pulps) such as low yields due to carbohydrate losses and, emissions that are
include wood species and chip geometry, ratio of effective alkali to wood weight, concentration of effective alkali and liquor, sulfidity and H-factor (function of cooking time and temperature). The main areas in the kraft pulping process can be divided into five: the wood yard operations, the pulping preparation, pulp bleaching in the bleach plant, recovery of chemicals, and the powerhouse.
2.2.1 Wood yard operations
The main objective of wood yards operations is to receive the logs, wood residues, and chips, to debark logs, to chip logs and residues and to store bark and chips for further processing. The raw materials are collected by truck or rail and store in stacks and piles to ensure continuous production. The logs are carefully stored to avoid mass losses. Debarking is very important prior to pulping because a high bark content of the chips can lead to undesirable performance such as more consumption of bleaching chemicals, yield reduction, lower brightness and possible bad pulp properties. Moreover, another important step is chipping and screening, since wood chips for chemical pulp must have a reasonably uniform size. The chip length determines the cooking time and absorption of chemicals considerably. On the other hand, chips must be adapted to the fiber length of different species in order to achieve good final product properties. Finally, the chips size will be a compromise of mechanical fiber damage during the cutting process and liquor impregnation thus it should be as low as possible 20.
2.2.2 Pulping process
virgin fiber material. 21 The main chemicals used are caustic sodium hydroxide (NaOH) and sodium sulfide (Na2S), mixture known as white liquor. The white liquor preparation includes the
conversion of sodium carbonate in the smelt to sodium hydroxide in a recausticizing plant. The operating conditions are at pH above 12, a temperature range of 140-170 oC, and residence time
of 3-4 hours. Pulping can be done within a batch digester or in a continuous digester. 20,22,23 In the batch cooking process, the whole amount of chemicals is charged with the white liquor at the beginning of the cook. Certain amounts of black liquor are introduced together with the white liquor to increase the dry solids contents in the spent liquor prior to evaporation. Yield is very important as the wood cost dominates the total production cost of kraft pulp. The pulp yield increases by 0.14% per increase of one kappa number for softwoods in the kappa range of 30 to 90 and 0.16% for hardwoods in the kappa number range of 10 to 90. 20
2.2.3 Bleaching
Bleaching is a chemical process applied to cellulosic materials, for which the main
Moreover, bleaching is carried out in a bleach plant in several stages usually four to five primarily for delignification and extraction of dissolved matter. Each stage consists of three steps; (1) constant mixing of the bleaching chemicals added on the pulp, (2) reaction of chemicals and pulp in a retention tower at a certain temperature and residence time, and (3) a washing step to remove dissolved impurities, helping to improve the bleaching efficiency of the following stages. The advantage of multi-stages in bleaching is that, the first part is in charge of removing the residual lignin called delignification. The last stages in the sequence are in charge of giving brightness to the pulp, where the chromophores in the pulp are eliminated to achieve a high brightness level. 21,22,24
In addition, bleaching chemicals are applied to pulp in different chemical charges and stage combinations depending on their function and final ISO brightness requirements. The most important bleaching chemicals, stage abbreviation for the type of bleaching agent applied and the operating conditions are shown in
Table 1.
Table 1. Commercially important bleaching chemicals 3,24
Name Stage Function Operating condition
Chlorine dioxide D Oxidize, decolorize and solubilize lignin
pH ~ 3 at 60 oC
Oxygen O Oxidize and solubilize
lignin
90 oC to 100 oC
Hydrogen peroxide P Oxidize and decolorize lignin
pH>10 to 11 at 60 oC to 90 oC
Ozone Z Oxidize, decolorize and
solubilize lignin
pH 2 to pH 3 at
Sodium hydroxide E Alkaline extraction pH>10 to 11 at 60 oC to 90 oC Chelants: EDTA or
DTPA
Q Remove metal ions pH 5 to pH 10 at 60 oC to 90 oC
Peracetic acid PAA Oxidize lignin, activation of following P stage
pH ~ 5 - 6 at 50 oC to 90oC
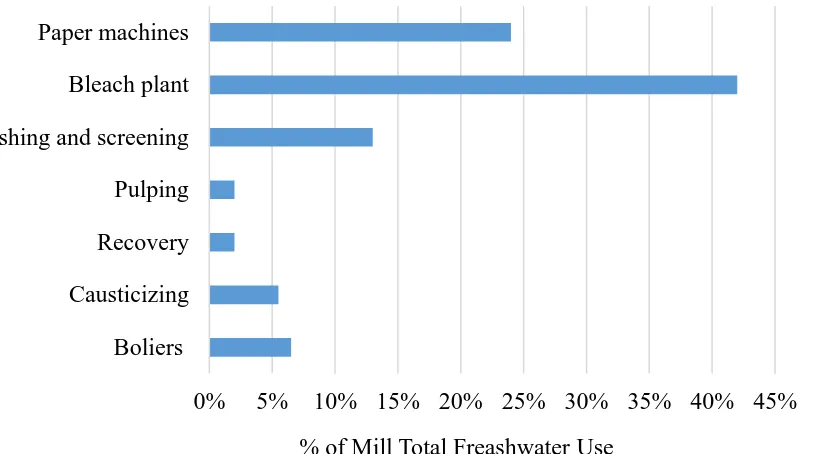
Figure 1. Water use by process area in an integrated kraft bleached paper mill.28
2.2.3.1 Bleaching technologies
There are two main bleaching technologies in use: (1) Elemental Chlorine Free (ECF) when no molecular or gaseous chlorine is used for bleaching, and (2) Total Chlorine Free (TCF). According to a published estimate in 2012, ECF methods accounted for 93% of the world’s bleached chemical pulp production, while TCF process account only about 5%. 2 Mills that utilize ECF bleaching technology use chlorine dioxide as the main bleaching agent, in some cases ozone, alkali for extraction of the dissolved lignin, and hydrogen peroxide and oxygen for reinforcement stages. TCF bleaching technology uses oxygen, ozone or peracetic acid and, in addition hydrogen peroxide and alkali for lignin extraction. 27 FisherSolve presents in their
database two industrial bleaching sequences using a peracid solution for TCF technology as shown in Table 2. The sequences are commercially in use in three sites in Sweden, processing different types of biomass using kraft or sulfite chemical pulping processes.
0% 5% 10% 15% 20% 25% 30% 35% 40% 45%
Boliers Causticizing
Recovery Pulping Washing and screening Bleach plant Paper machines
Table 2. Bleaching sequences using PAA in TCF technology
Site Country Pulp Class Pulp Type Fiber Type Bleaching Sequence
(1) Sweden Chemical Kraft Hardwood/
Softwood O2-O2-Q-Op-PAA/Q-PO (2) Sweden Chemical Sulfite Softwood O2-Q-PAA-P
(3) Sweden Chemical Kraft Softwood O2-O2-Q-Op-PAA/Q-PO
To meet rigorous wastewater standards, a few mills in North America and Europe have modified their bleach plant to TCF. The elimination of chlorine free bleaching chemicals has led to the development of a number of sequences using oxygen, ozone, peroxide and other
treatments including the use of enzymes, chelants and peracids. 29
2.2.4 Chemical Recovery Plant
The black liquor that is generated in the kraft pulping process and the effluents from the oxygen delignification stage go to the evaporation plant at a concentration of 10 to 18 wt% inorganic chemicals, and the rest is dissolved wood substance. During evaporation, the liquor is concentrated to 60 to 80 wt.% dry solids. The lower limit for combustibility is 58 wt.%;
converted to sodium hydroxide with solid calcium oxide from the limekiln. The produced solid calcium is burnt in the limekiln furnace.
2.2.5 Powerhouse Plant
In this part of the mill plant, steam is produced and supplied to the required areas. Kraft mills use energy in different forms; heat in the form of steam, chemical as biomass or fossil fuel, and electrical, which could be self-generated or purchased. Most kraft mills have power boilers, among them a hog fuel boiler using debarked wood and waste, a recovery boiler where the black liquor with about 65 to 75% solids content is burnt and a furnace that uses fossil fuel. The steam generated from the boilers power a turbine and generates electricity to the mill; in addition, any surplus of electricity is sold to the grid. 30
2.3 Life Cycle Assessment Framework
LCA is defined in the ISO 14040 as the following:”LCA studies the environmental aspects and potential impacts throughput a product’s life (i.e. cradle-to-grave) from raw materials acquisition through production, use and disposal. The general categories of environmental impacts needing consideration include resource use, human health, and ecological aspects.”31 The international standards ISO 14040 series contains the methods for
LCA studies; the most updated version is the standard ISO 14044 2006 32. The main purpose of
the standard is to identify opportunities to improve the environmental performance of products at different stages of their life cycle, informing decision-makers in the industry, government or non-government organizations, the selection of relevant indicators of environmental
performance, including measurement techniques.32
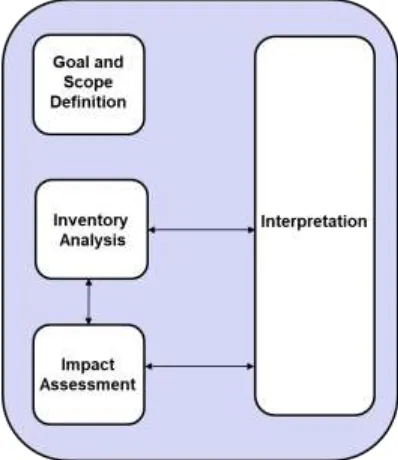
the four main phases in a Life Cycle Assessment study, which are goal and scope, life cycle inventory, impact assessment and interpretation.32
Figure 2. Life Cycle Assessment Framework 32
2.3.1 Goal and scope
A functional unit must be defined for each LCA study in order to have a baseline for comparison. In the case of LCA for the PAA production, the functional unit was defined as one kg of active PAA. The functional unit chosen in the second LCA study was defined as one air dry metric ton of bleached kraft pulp.
Regarding the scope of this study, the LCA was defined as cradle-to-gate for both LCAs studies. In the case of LCA of PAA production, the system boundaries include the raw materials acquisition and transportation to the production site. On the other hand, for the production of bleached kraft pulp, the system boundaries include the raw material acquisition (e.g. biomass, chemicals and fuels), transportation and pulp production. The main stages in the pulp production are the wood yard operations, the pulping process, the bleaching plant, chemical recovery and the powerhouse as explained in the previous section.
2.3.2 Life Cycle Inventory Analysis (LCI)
The life cycle inventory analysis is the second phase of LCA, in this phase the inputs and outputs data of the system in study are collected in order to achieve the goals proposed.32 In the
LCA for PAA production, data was collected from the literature, 6,34 and simulated in Aspen plus to determine the mass and energy balance for each production pathway. In the case of LCA for bleached kraft pulp, the kraft pulping process was simulated in WinGEMS (tool designed for the pulp and paper industry). The inputs of the life cycle stages are the raw materials acquisition (chemicals, biomass, fuels), the outputs include bleached pulp (product), electricity surplus, and emissions to air, water and waste.
2.3.3 Life Cycle Impact Assessment (LCIA)
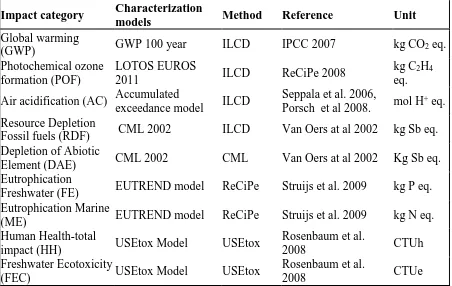
specific impact categories. The categories chosen for the LCAs, follow the standards from the WBCSD17, which provides guidance for choosing the LCIA methods for each impact category (i.e. ILCD, ReCiPe, CML, and USEtox). The report summarizes the characterization models and impact indicators assigned to each impact category as shown Table 3.17
Table 3. Summary of the Environmental impact categories following WBCSD. 17
Impact category Characterization
models Method Reference Unit
Global warming
(GWP) GWP 100 year ILCD IPCC 2007 kg CO2 eq.
Photochemical ozone formation (POF)
LOTOS EUROS
2011 ILCD ReCiPe 2008
kg C2H4
eq. Air acidification (AC) Accumulated
exceedance model ILCD
Seppala et al. 2006,
Porsch et al 2008. mol H
+ eq.
Resource Depletion
Fossil fuels (RDF) CML 2002 ILCD Van Oers at al 2002 kg Sb eq. Depletion of Abiotic
Element (DAE) CML 2002 CML Van Oers at al 2002 Kg Sb eq. Eutrophication
Freshwater (FE) EUTREND model ReCiPe Struijs et al. 2009 kg P eq. Eutrophication Marine
(ME) EUTREND model ReCiPe Struijs et al. 2009 kg N eq.
Human Health-total
impact (HH) USEtox Model USEtox
Rosenbaum et al.
2008 CTUh
Freshwater Ecotoxicity
(FEC) USEtox Model USEtox
Rosenbaum et al.
2008 CTUe
2.3.3.1 Impact categories
a) Global warming: refer to the greenhouse gases that contribute to climate change, the characterization factors used are provided as part of the Intergovernmental Panel on
Climate Change (IPCC) reports. GWP addresses the effect of increasing temperature in the lower atmosphere.35
are nitrogen oxides (NOx,) and volatile organic compounds (VOCs). The photochemical
ozone formation is expressed using the reference unit, kg ethene (C2H4) equivalent. 35
a) Air acidification: acidification is known as acid rain, it is caused by releases of protons on the earth surface or aquatic ecosystems.35
b) Resource depletion fossil fuels: refers to the depletion of energetic resources such as coal, crude oil and natural gas.36
c) Abiotic depletion: refers to the exhaustion of nonrenewable resources.36
d) Eutrophication: is an impact on ecosystems from substances containing nitrogen or phosphorous that can affect air, water and soil. Emission such as nitrogen oxides from combustion processes are the main contributors to air, nitrogen in the aquatic environment originated from the use of fertilizers in agriculture contaminate water, and emissions such as phosphorous penetrating the earth from agricultural sources affect soils.37
e) Human health: in this category particulate matter is tracked given the fact that this small particles in the air are able to cause huge damage in human health including major issues related to respiratory diseases.38
f) Freshwater ecotoxicity: measures emissions from substances such as heavy metals that can cause an impact of the ecosystem.
2.3.4 Interpretation
This final phase summarizes the results from the LCI and LCIA, it discusses and provides conclusions, recommendations and decision-making in accordance with the goal and scope defined for each LCA in study. The LCIA results are usually normalized to visualize differences between processes. Normalization is commonly used in the ISO 14044 standards to see
approach is to highlight impact indicators without any weighting values; this interpretation indirectly suggests an equal weighting value for all impact categories. With normalization, a variety of perspectives on which an environmental subject is more critical can be presented to the audience and, is an method to narrow the indicators considered for further analysis, without suggesting that others are less important.
2.3.5 LCA tools, software and database requirements
a) The mass and energy balance for PAA production are simulated in AspenONE. AspenONE was developed by AspenTech, which is the world’s leading supplier of asset optimization software solutions.
b) Ecoinvent39 is well used in the field of LCA. The main advantage of using this database is that it contains most processes involved in the production of most chemicals used in this study.
c) WinGEMS16 is the pulp and paper industry’s processes leader simulation tool. It is a specific software developed in the 1970s at the University of Idaho. WinGEMS contains unit
processes specifically used to perform optimization and mill process simulations. d) The simulation tool used for modeling and comparison of the LCA in this study is
OpenLCA.40 OpenLCA is an open source software for LCA and Sustainability Assessment. It was developed by GreenDelta in 2006 and it is available on their website with no license costs41.
2.4 LCA studies for the pulp and paper industry
Companies and research institutes have developed LCA studies for pulp and paper
toxicity levels found in water effluents when elemental chlorine was used prior to the
development of ECF and TCF bleaching technologies. Currently, two bleaching technologies ECF and TCF are widely used by the pulp and paper industry; however, few studies have quantified the environmental impacts of a TCF bleaching technology from an LCA perspective.
Ryynänen et al. (1996) performed an environmental life cycle assessment for bleached pulp production from two types of Australian eucalyptus woods comparing ECF versus TCF bleaching technologies. They found that the main differences are caused by the different pulp yields obtained from two types of wood sources, mature and plantation wood. Using mature wood required more wood and to some extent more fossil fuel; however, this pathway produced more power available for external use. The consumption of fossil fuel is mainly for
transportation and wood harvesting in their study. Regarding the emissions to air, water and solids, the pulp production causes more emissions compared to the wood harvesting and
transport processes. The most critical environmental categories were the use of resources (water), non-renewable energy and carbon dioxide emissions to air. In addition, their results show that sulfur and nitrogen are the major contributors to acidification. Overall, this study did not find significant differences between using ECF and TCF bleaching technologies. 42
production. In the natural gas scenario, all energy requirements are satisfied by electricity and steam generation on-site, with surplus electricity produced exported to the national Portuguese grid. They concluded that the eucalyptus pulp production is the largest consumer of energy throughout the paper life cycle; however, the air emissions are not the major drivers to the environmental impacts given that 95% comes from renewable sources (e.g. debarked trees and the black liquor combustion). Finally, they reported that using natural gas in the eucalyptus pulp and paper production process is an environmentally friendly alternative compared to heavy fuel oil because it reduces the resource depletion fossil fuels category by 45%.
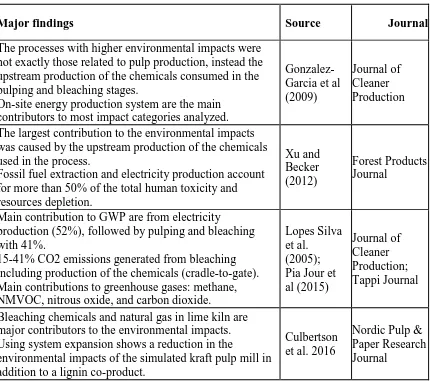
Gonzalez et al (2009) is an LCA study found in the literature that evaluates a TCF bleaching technology for eucalyptus bleached pulp production. This study is performed for mills in Spain using a cradle-to-gate approach. This study does not account for biogenic carbon, and only includes the emissions from fossil fuels. The TCF bleaching sequence uses two stages of pre-delignification with oxygen, hydrogen peroxide as the main bleaching agent, and sodium hydroxide for extraction and chelating agents for the removal of metals.
compared to a traditional ECF technology,44 this research shows that the introduction of enzymes into ECF bleaching improves the performance in most impacts evaluated for this study;
nonetheless the enzymes should be manufactured on site to decrease GWP.
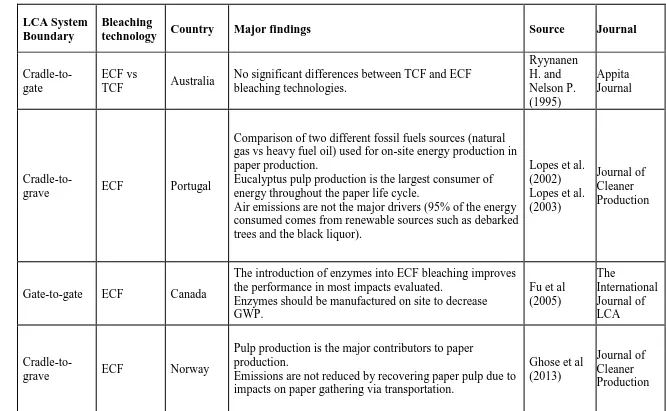
Table 4. LCA studies for pulp and paper products
LCA System Boundary
Bleaching
technology Country Major findings Source Journal
Cradle-to-gate
ECF vs
TCF Australia
No significant differences between TCF and ECF bleaching technologies. Ryynanen H. and Nelson P. (1995) Appita Journal
Cradle-to-grave ECF Portugal
Comparison of two different fossil fuels sources (natural gas vs heavy fuel oil) used for on-site energy production in paper production.
Eucalyptus pulp production is the largest consumer of energy throughout the paper life cycle.
Air emissions are not the major drivers (95% of the energy consumed comes from renewable sources such as debarked trees and the black liquor).
Lopes et al. (2002) Lopes et al. (2003)
Journal of Cleaner Production
Gate-to-gate ECF Canada
The introduction of enzymes into ECF bleaching improves the performance in most impacts evaluated.
Enzymes should be manufactured on site to decrease GWP.
Fu et al (2005) The International Journal of LCA
Cradle-to-grave ECF Norway
Pulp production is the major contributors to paper production.
Emissions are not reduced by recovering paper pulp due to impacts on paper gathering via transportation.
Ghose et al (2013)
Table 5. LCA studies for pulp and paper products
LCA System Boundary
Bleaching
technology Country Major findings Source Journal
Cradle-to-gate TCF Spain
The processes with higher environmental impacts were not exactly those related to pulp production, instead the upstream production of the chemicals consumed in the pulping and bleaching stages.
On-site energy production system are the main contributors to most impact categories analyzed.
Gonzalez-Garcia et al (2009)
Journal of Cleaner Production
Cradle-to-gate ECF China
The largest contribution to the environmental impacts was caused by the upstream production of the chemicals used in the process.
Fossil fuel extraction and electricity production account for more than 50% of the total human toxicity and resources depletion. Xu and Becker (2012) Forest Products Journal
Cradle-to-gate ECF Brazil
Main contribution to GWP are from electricity
production (52%), followed by pulping and bleaching with 41%.
15-41% CO2 emissions generated from bleaching including production of the chemicals (cradle-to-gate). Main contributions to greenhouse gases: methane, NMVOC, nitrous oxide, and carbon dioxide.
Lopes Silva et al.
(2005); Pia Jour et al (2015) Journal of Cleaner Production; Tappi Journal
Cradle-to-gate ECF USA
Bleaching chemicals and natural gas in lime kiln are major contributors to the environmental impacts. Using system expansion shows a reduction in the
environmental impacts of the simulated kraft pulp mill in addition to a lignin co-product.
Culbertson et al. 2016
CHAPTER III
3 LCA OF PERACETIC ACID
3.1 Introduction
The uses of PAA include many industrial applications such as textile bleaching,
delignification of fibers, institutional laundries, pulp delignification and bleaching. Regarding the preparation and production of peracetic acid (PAA) Hickman (2002) documented its general properties, composition of commercial solutions, stabilities and analysis. The review, describes most articles found in the literature during the past decades to create the foundations of peracetic acid and its use in fibers bleaching. The preparation and production of PAA was first isolated and characterized by D’Ans and Frey. Equilibrium PAA solutions as high as 15 wt.% can be safely produced when mixing together hydrogen peroxide and acetic acid.9
Sweden was the first country to use peracetic acid as part of a TCF bleaching process in a pulp and paper mill. Additionally the delignifying effects of peracids have been studied by Poppius-Levlin et al. (1999). Other factors, such as pulp properties have shown that PAA
charges as high as 5% on pulp can achieve a delignification degree of 55% with little damage on fibers. Furthermore, Poppius-Levlin et al., have reported that variables affecting the process of delignification can be optimized by changing temperature or PAA charge on pulp. They also have suggested an optimal pH range from acidic to neutral. In addition, for successful PAA delignification, the removal of transition metals was recommended either through acid washing or by chelation. 10
When contrasting the main remarks of Hickman’s article, similarities about the
Hickman’s review has suggested that PAA shows bleaching and delignifying properties useful from an environmental point of view to replace chlorine-based components frequently used in pulp production.
One of the motivations for the use of PAA as a bleaching agent in a TCF bleaching sequence is the fact that effluents from the bleach plant may be recycled back to brownstock washers and then to evaporators rather than released to aquatic ecosystems. This practice can result in decreasing or eliminating amounts of adsorbable halogens compounds (AOX) in effluents that could have been generated through traditional bleaching sequences with the use of chlorinated compounds as described by Liebergott, N. (1996).45
So far, the findings from the literature have been related to the performance of PAA as a bleaching agent; however, there is no information that assesses the footprints of producing PAA. Therefore, the objective of this chapter is to perform, a cradle-to-gate Life Cycle Assessment (LCA) of PAA production from two different pathways, evaluating nine impact categories to understand the differences driven by raw materials types, concentrations and conversion ratios.
3.2 Goal and Scope
3.3 Functional Unit
The LCA functional unit defined for this study is one kg of active peracetic acid, which allows to make a fair comparison regarding how PAA is produced, and to carefully compare as explained before different pathways’ contributions to the environmental impacts.
3.4 System Boundaries
The system boundary of this study is cradle-to-gate, which means that the upstream manufacture of the raw materials is included in the model for the production of 1 kg of active PAA. Figure 3 shows the main raw materials used for PAA production. The raw materials are transported a distance of 100 km to the manufacturing facility in this LCA study. PAA is produced on-site in a mill facility; the further use of a bleaching agent in a TCF technology.
Figure 3. Cradle-to-gate LCA system boundary for the production of peracetic acid
3.5 Life Cycle Inventory (LCI)
The data collection is the most important part of an LCA study. Each raw material included in Figure 3 are based on the goal and boundaries of the study (cradle-to-gate), data are collected and simulated in Aspen plus.
ePAA
tPAA
Acetic acid
Triacetin
Transport
Raw materials
acquisition
Hydrogen
peroxide
Hydrogen
peroxide
(1)
(2)
PAA production
3.5.1 Feedstock used in the production of PAA
a) Hydrogen Peroxide (HP): the manufacture of HP in the U.S, Western Europe, and Japan is most commonly done through anthraquinone autoxidation, which, involves the catalytic reduction (hydrogenation) of alkylanthraquinones to anthraquinone and oxidation of this product to yield HP. HP is concentrated and it commercially available in grades ranging 30-70% by weight (wt) 46,47.
b) Acetic Acid (AA): the most important pathway for producing acetic acid are methanol carbonylation and liquid-phase oxidation of butane, naphtha or acetaldehyde, being methanol carbonylation the main method used for the past 35 years. Acetic acid can be found in dilute solutions in several plants and even animals. The most common solution known is vinegar which contains around 4 to 12 wt% acetic acid 48.
c) Sulfuric Acid (SA): it is produced from sulfur dioxide. The main raw material intermediate is elemental sulfur. It has a wide range of uses, the most important consumer is the fertilizer industry.49
d) Triacetin: also known as glycerin triacetate is a viscous and odorless liquid. The raw materials for manufacturing triacetin are glycerin, acetic acid, and acetic anhydride. Some aplications are as a plasticizer and solvent, food additive as humectant, plasticizer and flavour carrier applied to the cigarette filter, flavor and essence fixative and lubricate in cosmetics, fuel additive to improve cold flow and viscosity properties of biodiesel. 50
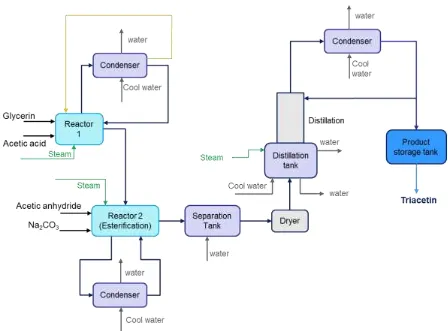
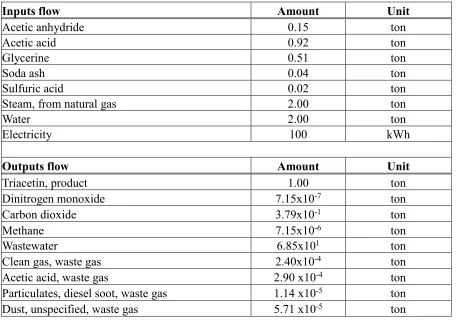
production of 1 ton of triacetin, and it was built and included in the Ecoinvent database as shown in Table 6.
Table 6 Inputs and outputs for the production of 1 ton of triacetin
Inputs flow Amount Unit
Acetic anhydride 0.15 ton
Acetic acid 0.92 ton
Glycerine 0.51 ton
Soda ash 0.04 ton
Sulfuric acid 0.02 ton
Steam, from natural gas 2.00 ton
Water 2.00 ton
Electricity 100 kWh
Outputs flow Amount Unit
Triacetin, product 1.00 ton
Dinitrogen monoxide 7.15x10⁻⁷ ton
Carbon dioxide 3.79x10⁻¹ ton
Methane 7.15x10⁻⁶ ton
Wastewater 6.85x101 ton
Clean gas, waste gas 2.40x10⁻⁴ ton
Acetic acid, waste gas 2.90 x10⁻⁴ ton
Particulates, diesel soot, waste gas 1.14 x10⁻⁵ ton
Dust, unspecified, waste gas 5.71 x10⁻⁵ ton
3.5.2 Production of PAA
Two pathways are compared in the production of peracetic acid. The first pathway (ePAA) has three cases regarding the different molar ratio, conversion of HP to PAA and
concentration of HP. On the other hand, the second pathway (tPAA) is a new chemistry based in a non-equilibrium mixture of triacetin and hydrogen peroxide in alkaline conditions.
3.5.2.1 Production of PAA from acetic acid pathway (ePAA)
In ePAA pathway, HP, AA, and SA are used as raw materials. The equilibrium reaction can be seen in Equation 1.
The concentration and yields of PAA depend on factors such as feedstock molar ratio, HP concentration, and conversion to PAA,6,51 as shown in Table 7. The concentration requirements of PAA applied to bleach pulp are typically below 5%; however, it is more cost-effective and easier for process control to produce PAA at a higher concentration and then dilute it before being used in the process. 9,52 The second case in Table 7 is relatively close to the industrial practice 53 of PAA production, given that HP 50% solution is commercially sold in the market,46 and high concentration of PAA is achieve in the production with AA.6,51
Table 7. Three scenarios of PAA production.6
ePAA Molar Ratio
AA to HP
HP wt%
Conversion (%) HP to PAA
ePAA wt%
kg raw material / kg of ePAA
AA HP SA
Case 1 1:1 (1) 50 37 21.6 2.18 2.42 0.036
Case 2 2:1(1) 50 70 27.8 2.30 1.28 0.019
Case 3 1.5:1(1) 90 77 44.8 1.57 0.65 0.017
Table 8. LCI Inputs and outputs for ePAA production, conversion of 70% HP to PAA.
Inputs Flow Amount Unit
Hydrogen peroxide 50% solution, market for HP (GLO)* 1.28 kg
Acetic acid 98%, market for AA (GLO) 2.30 kg
Transport of raw materials, freight lorry 16-32 metric-ton 3.6 x 100 kg x km Sulfuric acid 98% solution, market for (GLO) 0.019 kg
Outputs Flow Amount Unit
Peracetic acid 1 kg
Hydrogen peroxide 0.19 kg
Acetic acid 1.47 kg
Sulfuric acid 0.02 kg
Water 0.92 kg
* GLO represents the average global processes.
3.5.2.2 Production of PAA from triacetin pathway (tPAA).
The production of peracetic acid (tPAA) from the triacetin pathway presents a new alternative chemistry pathway developed a few years ago by Buschmann et al. 8 Triacetin – an acetyl donor – being one of the raw materials for the production of tPAA is in a non-equilibrium mixture with hydrogen peroxide in alkaline conditions to produce a peracid solution. 8 The
reaction is shown in Equation 2.
C9H14O6+ 3H2O2 3C2H4O3+ C3H8O3 Equation 2
of this chemistry for large-scale production (e.g., greater than 2 tons per day per site on a 100% active basis) we have proposed a second scenario that assumes process optimization down to 50% triacetin in excess for tPAA production. A summary for the scenarios of tPAA production is shown in Table 9.
Table 9. Scenarios for the production of tPAA from triacetin pathways
tPAA % Triacetin
in excess
HP wt%
Conversion (%) HP to PAA
PAA wt%
kg of raw material/ kg PAA
Triacetin HP NaOH
Scenario 1 100 50 97 5.45 1.97 0.46 0.77
Scenario 2 50 50 97 5.57 1.48 0.46 0.77
Scenario 3 0 50 97 5.73 0.98 0.46 0.77
The inputs and outputs for the production of 1 kg of PAA are presented in Table 10 using 100% triacetin in excess (scenario 1).
Table 10. LCI of scenario 1 for tPAA production, 97% conversion HP to PAA.
Inputs Flow Amount Unit
Triacetin, market for triacetin (GLO) 1.97 kg
Hydrogen peroxide 50% solution, market for HP - GLO 0.46 kg
NaOH 50% solution, market for NaOH -GLO 0.77 kg
Water, market group for water – GLO 15.06 kg
Transport of raw materials, freight lorry 16-32 metric-ton, -GLO 3.2 x 100 kg x km
Outputs Flow Amount Unit
Peracetic acid 1 kg
Hydrogen peroxide 0.01 kg
Glycerol 0.83 kg
Sodium acetate 1.14 kg
NaOH 0.01 kg
Water 15 kg
3.6 LCIA for the production of PAA
The results presented in Table 11 are a comparison of nine environmental impacts
between the production of PAA from three pathways, ePAA and tPAA case with 100% and 50% triacetin in excess respectively. In most categories, the ePAA pathway has the lowest
environmental impacts while tPAA with 100% excess triacetin has the highest environmental impacts. However, the environmental impacts of the tPAA pathway can be greatly reduced (17%-26% reduction) when PAA is produced with 50% triacetin in excess. In some impact categories such as GWP, ME, and HH, the results of tPAA with 50% triacetin in excess can be as low as similar to the results of the ePAA pathway. Based on the results, reducing excessive use of triacetin while still maintaining a desirable conversion rate and PAA yields should be the future direction of process optimization for PAA production from an environmental
sustainability perspective.
Table 11. LCIA results for PAA production from ePAA (case 2) and tPAA scenarios
Impact category Unit/1 kg of PAA ePAA tPAA* tPAA**
GWP kg CO2 eq. 5.6 7.2 5.8
POF kg C2H4 eq. 2.1×10⁻² 3.1×10⁻² 2.5×10⁻²
AC Mole H+ eq.
3.7×10⁻² 6.7×10⁻² 5.2×10⁻²
RDF kg Sb eq. 3.0×10⁻⁴ 5.2×10⁻⁴ 4.1×10⁻⁴
DAE kg Sb eq. 2.4×10⁻⁵ 4.8×10⁻⁵ 4.0×10⁻⁵
FE kg P eq 2.2×10⁻³ 3.5×10⁻³ 2.8×10⁻³
ME kg N eq 1.2×10⁻³ 1.9×10⁻² 1.4×10⁻²
HH CTUh 1.8×10⁻⁶ 2.2×10⁻⁶ 1.8×10⁻⁶
FEC CTUe 32 47 38
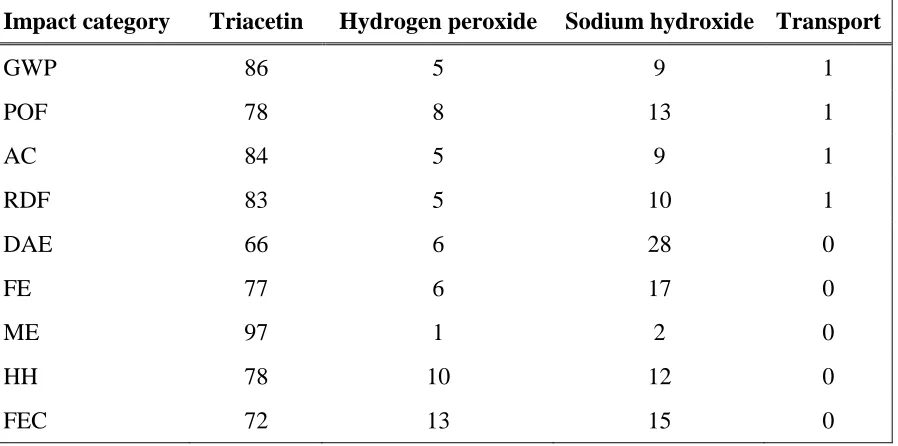
* 100% triacetin in excess ** 50% triacetin in excess
contributed by the upstream of the raw materials production. The results of tPAA with 50% triacetin in excess are shown in Table 12. The results of ePAA and tPAA with 100% triacetin in excess show the same trend and are presented in Table 13, finally the results for ePAA pathway can found in
Table 14.
Table 12. Hotspot analysis for the production of tPAA (50% triacetin in excess) (%)
Impact
category Triacetin Hydrogen peroxide Sodium hydroxide Transport
GWP 72 10 16 1
POF 80 7 11 1
AC 82 6 12 1
RDF 79 7 13 1
DAE 59 7 34 0
FE 71 8 21 0
ME 93 1 2 0
HH 73 12 15 0
FEC 66 15 18 0
Table 13. Hotspot analysis for the production of ePAA (molar ratio AA to HP 2:1) (%)
Impact category Acetic acid Hydrogen peroxide Sulfuric acid Transport
GWP 69 30 0 1
POF 76 22 0 2
AC 76 23 0 1
RDF 66 26 6 2
DAE 67 30 2 1
FE 73 27 0 0
ME 57 41 0 1
HH 57 42 0 0
Table 14. Hotspot analysis for the production of tPAA (100% triacetin in excess) (%)
Impact category Triacetin Hydrogen peroxide Sodium hydroxide Transport
GWP 86 5 9 1
POF 78 8 13 1
AC 84 5 9 1
RDF 83 5 10 1
DAE 66 6 28 0
FE 77 6 17 0
ME 97 1 2 0
HH 78 10 12 0
FEC 72 13 15 0
Given the hotspot analysis, one potential improvement for reducing the life-cycle environmental impact of PAA production is to look for low-impact production pathways of raw materials. For example, for tPAA pathway, triacetin production is the main process of the LCIA results. Triacetin is produced from acetic acid, acetic anhydride, sodium carbonate, and glycerin that has a large contribution to the results. Currently, glycerin can be produced from both fossil-fuel based and bio-based sources, 55 and the global average of different sources in Ecoinvent is used in the previous results. By using soybean-based glycerin, the environmental impacts of PAA can be significantly reduced, 10% - 21% reduction in environmental impact categories such as GWP, HH and FEC for tPAA 50% triacetin in excess. These results present lower
Table 15. LCIA results for PAA production from ePAA and tPAA (using glycerin from soybean as raw material for triacetin production)
Impact category Unit/1 kg of PAA ePAA tPAA* tPAA**
GWP kg CO2 eq. 5.6 5.4 4.5
POF kg C2H4 eq. 2.10x10⁻² 2.71x10⁻² 2.15x10⁻²
AC Mole H+ eq. 3.71x10⁻² 4.94x10⁻² 3.94x10⁻²
RDF kg Sb eq. 3.00x10⁻⁴ 3.90x10⁻⁴ 3.10x10⁻⁴
DAE kg Sb eq. 2.44x10⁻⁵ 4.01x10⁻⁵ 3.41x10⁻⁵
FE kg P eq 2.17x10⁻³ 2.97x10⁻³ 2.42x10⁻³
ME kg N eq 1.19x10⁻³ 1.83x10⁻³ 1.49x10⁻³
HH CTUh 1.84x10⁻⁶ 1.95x10⁻⁶ 1.61x10⁻⁶
FEC CTUe 32 34 28
* 100% triacetin in excess ** 50% triacetin in excess
3.7 Conclusions
The life cycle assessment of PAA production was perform from two production
CHAPTER IV
4 BLEACHING EXPERIMENTS
4.1 Introduction
The function of PAA in the kraft pulping process, specifically in the bleaching of pulp is to oxidize lignin during a bleaching stage, under acidic, neutral or alkaline conditions. The applications of peracetic acid in one or more bleaching stages has been demonstrated as a delignification agent and in alkaline conditions as a brightening agent. 12,56 The reaction
mechanisms and reaction products depend on pH. Hill and co-workers 57 showed that increasing the initial pH of peracetic acid delignification from pH 2 to pH 10 lowers the delignification effect of both softwood and hardwood fibers. At pH values in the range of 7 to 9, the reduction in kappa number obtained with peracetic acid was essentially similar to that of an equimolar
quantity of chlorine 10,58.
An important condition to take into account for successful peracid delignification of kraft pulp is the removal of transition metals either by acid washing or by chelation. Chelants are polydentate ligand molecules, often used in the pulp and paper industry to minimize the negative effect of metal ions. Among the most typical chelants, ethylendiaminetetraacetic (EDTA) and diethylentriaminepentaacetic acid (DTPA) can be used. 10,58
Peracetic acid has proved to be an efficient alternative as a TCF bleaching chemical, when used before a hydrogen peroxide bleaching stage; this is because it improves the brightness of the pulp and it additionally leads to a lower consumption of hydrogen peroxide, which
As part of chapter III, experimental work is conducted to demonstrate the efficiency of bleaching with PAA. The literature presents evidence regarding the uses of ePAA; however, as mentioned in the previous chapter II, the environmental impacts for PAA production were
presented from two pathways (ePAA and tPAA). Currently, there is no information regarding the uses of tPAA as a bleaching agent, therefore both peracids (ePAA and tPAA) are tested in this chapter to understand whether tPAA achieves similar brightness as ePAA for further application in the pulp and paper industry. The results from the bleaching experiments with PAA are
compared to the traditional bleaching agent ClO2 used in ECF bleaching technology. 4.2 Experimental Procedure
Figure 5. Bleaching experiments test
4.2.1 Materials
The hardwood kraft pulp was obtained from a pulp and paper mill through the Department of Forest Biomaterials, NC State. The pulp was washed after the oxygen
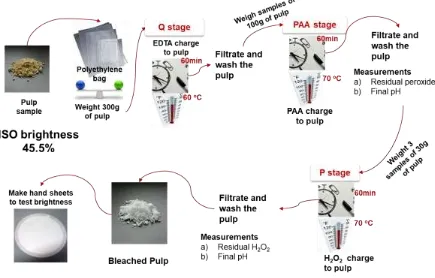
delignification stage (O stage). The Kappa number after the O stage was 9.4 and an initial ISO brightness of 45.50%. It was stored in polyethylene bags in a cold room to conserve its moisture. The chemicals used in the bleaching stages include the use of ePAA 32 wt.% commercially available, other reagents such as HP 30 wt.%, sodium hydroxide (NaOH) in pellets and
measure ISO Brightness developed by Technidyne. The equipment is called ColorTouch X™; it was launched in 1994 with a set of tools to meet the demands of the brightness, color,
fluorescence.60 In addition the ColorTouch X™ provides a higher level of accuracy and capabilities meeting industry standards such as:
a) ISO Standards 2469, 2470, 2471, 3688, 5631, 9416, 11475, 11476, 12625, 22754, 22891; b) TAPPI Optical Methods T519, T525, T527, T534, T560;
c) PAPTAC E.1, E.2, E.5, E.8 60.
Figure 6. ColorTouch X, ISO Color Spectrophotometry. 60
4.2.2 Bleaching Technologies
4.2.2.1 TCF Bleaching
The TCF bleaching sequences was conducted using hardwood kraft pulp after the oxygen delignification stage as mentioned previously. A second oxygen delignification stage was
performed with O2. The second O stage was set in a small reactor, at 100psi, 100 oC, and 30 min.
Table 16. Operating conditions for TCF bleaching sequence
Stages O2 Q1 Op PAA/Q2 P
Time (min) 30 60 90 70 70
Temp (oC) 100 90 60 60 60
Consistency (K) 10 10 10 10 10
Chemical charge
(%) on pulp NaOH= 1.5 EDTA= 0.8
H2O2= 1 NaOH= 1
PAA= 1 EDTA= 0.8
H2O2= 2 NaOH= 2
pH 9 5-6 9 5-6 >10
ISO Brightness O2 Q1 Op PAA/Q2 P
Trial 1 53 58 78 ePAA 83 86
tPAA 83 86
Trial 1 54 57 76 ePAA 82 83
tPAA 80 82
Average 53 58 77 ePAA 82 84
tPAA 82 84
4.2.2.2 ECF bleaching
An ECF bleaching sequence was chosen to perform bleaching experiment with the same hardwood pulp used during the TCF bleaching experiments, in order to have the same comparison in achieving a brightness of 84%. The bleaching sequence chosen to test an ECF technology was D1 Eop D2, the experimental work was done at a lab-scale using the operating conditions and the chemical charges reported in Table 17. In order to achieve an 84% brightness, the chemical charges of ClO2 were extrapolated from the results obtained in the experiments to
Table 17. Operating conditions for ECF bleaching sequence
Stages O2 D1 Eop D2
Time (min) 60 60 180
Temp (oC) 100 70 70 70
Chemical charge (%)
on pulp NaOH= 2
ClO2= 0.7
H2SO4=1.1
H2O2= 0.5
NaOH= 0.94 ClO2= 0.3
pH 9 3 11.5 3
ISO Brightness 45 75 79 84
The experimental procedure for TCF technology can be found in Figure 7, where all the stages are organized with its operating conditions. In the case of the PAA stage both peracid solutions (ePAA and tPAA) were tested.
Figure 7. Experimental bleaching procedure using ePAA and tPAA
4.3 Results
Brightness (Br) of 86.25%. The bleaching sequence O O Q1 Op PAA/Q2 P was run twice in the lab with both ePAA and tPAA to verify its effectiveness in achieving an industrial brightness.
The photos of handsheets made in the first round after each bleaching stage are shown in Figure 8. The handsheets made after each stage are assigned with the stage name (e.g., O2, Q1, Op). The percentage shown in the handsheets are the concentration of chemicals charged on the pulp. The results from the experiments indicated that using ePAA and tPAA achieves a final ISO Brightness of 85.60% and 85.75% respectively. These values are very close to the ECF
brightness baseline of 86.25%.
a) ePAA b) tPAA
Figure 8. Hand sheets from bleaching sequence using ePAA and tPAA
Figure 9. Handsheets from ECF bleaching sequence
Figure 10. ISO Brightness for bleaching stages prior to PAA application
The bleaching stage PAA/Q2 was tested with both peracids solution, Figure 11presents the application of ePAA and the results for the brightness of the pulp when two different charges were applied. From these results it can be seen that a charge of 0.5% PAA on the pulp achieves an ISO brightness of 80.73%, and by increasing to 1% PAA charge the brightness increases to 82.18%.
After the PAA stage there is a final P stage used to increase the brightness of the pulp. HP is applied on the pulp with two different concentrations 1%HP and 2% HP. The chemical charge is applied to each PAA charges of 0.5% PAA and 1% PAA. It was found that the ISO brightness is proportional to the chemical charge applied to the pulp. In the case for the highest ePAA charged applied (1%), when charging 1% HP the brightness achieved was 83.56% and when the concentration was 2% HP, it increased to the final brightness of 84.32%.
45.5 53.33 58.16 78.06 45.5 53.52 56.99 76.0 45.50 53.43 57.57 77.00 0 20 40 60 80 100
O1 O2 Q1 Op Stage
Figure 11. ISO Brightness average trials for bleaching stages with ePAA and P (H2O2)
After testing the tPAA solution on the pulp at the same conditions as the ePAA charges, it was found that this solution did not require pH adjustment. Moreover, the ISO brightness results show that, a charge of tPAA 0.5% the average ISO brightness achieved was 80.35%, which is less than 1% difference relative to bleaching with ePAA. In addition, after the final P stage a final average ISO brightness of 83.91% on the pulp was achieved with the highest
chemical charges (2% HP) as seen in Figure 12, which is very similar to the value obtained when bleaching with ePAA.
80.73 82.52 83.34 82.18 83.56 84.32
0 20 40 60 80 100
0.5% ePAA/Q2 P 1% ePAA/Q2 P
IS
O
B
rig
htness
(%
)
Bleaching stages
Figure 12. Bleaching stages with tPAA and H2O2
The bleaching sequence for the ECF technology was O1 D1 Eop D2. The chemical charge of the bleaching agent in D1 stage started with a 0.2 kappa factor in order to calculate the amount of ClO2 required for delignifying the pulp using the operating conditions for time and
temperature shown in Table 17. The results for the brightness are shown in Figure 13. It is worth to mention that in order to estimate the chemical charge needed to achieve an ISO brightness of 84% the data from the experiments was extrapolated to a ClO2 charge of 0.3%. The information
from these results are further used as inputs in a WinGEMS simulation model for pulp bleached using ECF where a ClO2 generator is used and simulates the production of this bleaching
chemical using its raw materials (NaClO3, CH3OH and H2SO4). This simulated process allows
gathering the life cycle inventory data for ECF technology as shown in Table 18 to further assessing the environmental impacts of this technology (see Chapter 5).
80.35 82.07 83.01 81.82 83.32 83.91
0 20 40 60 80 100
0.5% tPAA/Q2 P 1% tPAA/Q2 P
IS
O
B
rig
htness
(%
)
Bleaching sequences