by Using Climate-Based Daylight Modeling. (Under the direction of Dr. Jianxin Hu). This research focuses on daylight and energy assessments in office buildings with different atrium proportions and roof aperture designs. The goal is to assess and optimize atrium roof aperture design and proportion to improve daylighting performance and energy efficiency of atrium buildings. This study investigates daylight and thermal performance metrics in central and attached atrium types with different proportions and roof aperture designs, such as monitor and horizontal skylight. This research measures daylight
performance of an atrium based on its proportion defined by the Well Index (WI). Climate-based daylight modeling (CBDM) is applied as the assessment strategy in Raleigh, NC. Spatial Daylight Autonomy (sDA) and Annual Solar Exposure (ASE) are adopted as the dynamic daylight metrics. This study also validates DIVA for Rhino as the simulation tool by comparing daylight results of the computer simulation with the physical scale-model results.
by
SeyedehMahsan Mohsenin
A dissertation submitted to the Graduate Faculty of North Carolina State University
in partial fulfillment of the requirements for the degree of
Doctor of Philosophy Design
Raleigh, North Carolina 2015
APPROVED BY:
________________________________ _______________________________
Dr. Jianxin Hu Dr. Wayne Place
Committee Chair
________________________________ ________________________________
BIOGRAPHY
Mahsan received a Master of Science in Architectural Studies from the Massachusetts Institute of Technology in 2011. She began her PhD in Design at North Carolina State
ACKNOWLEDGMENTS
I am grateful to all my committee members who have generously contributed to the development of this dissertation. Dr. Jianxin Hu has not only inspired me to look into the methodological aspects in daylighting studies on atrium buildings, but also guided me through the entire research process. Dr. Wayne Place has been a source of inspiration on daylight physics and has informed me of the relevant literature in atrium buildings. Dr. Stephen Terry provided valuable guidance in understanding the fundamentals of heating and cooling design in buildings and thermal analysis of atrium buildings. I am also grateful for the advice that Dr. Robin Abrams provided, specifically on the urban implications of this study. I would also like to thank Alstan Jakubiec, a DIVA-for-Rhino developer, for his endless support and feedback on using the DIVA simulation tool. And finally, thanks to David Tredwell, a multimedia specialist at North Carolina State University. Without his help, the online user interface of the database would not have been developed successfully.
TABLE OF CONTENTS
LIST OF TABLES ... vi
LIST OF FIGURES ... vii
Chapter 1 INTRODUCTION ... 1
1.1 Research Goal... 1
1.2 Definition of Key Terms ... 2
Chapter 2 LITERATURE REVIEW ... 6
2.1 Daylighting Rules of Thumb ... 6
2.1.1 Daylight Feasibility Test ... 7
2.1.2 Limiting Depth ... 8
2.1.3 How much light is enough?... 9
2.1.4 How much light is excessive? ... 9
2.2 Daylighting Performance Metrics ... 10
2.3 Daylighting Prediction Methods ... 11
2.3.1 Existing Expert Systems ... 12
2.4 Daylighting in Atrium Buildings ... 13
2.4.1 Why Atrium Buildings? ... 13
2.4.2 Atrium Buildings Case Studies... 14
2.4.3 Atria Factors Influencing Daylighting ... 15
2.5 Thermal Analysis and prediction methods ... 16
2.5.1 Building Load Calculations with Cooling Load Temperature Difference (CLTD) ... 17
2.6 LEED Requirements for Daylighting... 23
2.7 Literature Synthesis ... 24
Chapter 3 RESEARCH METHODOLOGY ... 29
3.1 Conceptual Framework ... 29
3.1.1 Atrium Types ... 29
3.1.3 Well Index and its Validity ... 31
3.1.4 Furniture ... 35
3.2 Research Method ... 38
3.1.5 Validating Computer Simulation by Scale-Model Experiment ... 38
3.1.6 Computer-Model Simulation ... 40
3.1.6.1 Daylight Simulation Settings ... 41
3.1.6.2 Thermal Simulation Settings ... 42
Chapter 4 RESEARCH FINDINGS AND CONCLUSION ... 44
4.1 Lighting Assessment ... 45
4.1.1 Climate-Based Metrics... 46
4.1.2 Point-in-Time Metrics ... 49
4.1.3 On LEED Daylighting Credit ... 51
4.2 Energy Assessment... 54
4.3 The Impact of Atrium Type ... 55
4.4 User Interface Design ... 57
4.5 Conclusion and Discussion ... 58
REFERENCES ... 65
APPENDICES ... 71
LIST OF TABLES
Table 1 Cooling Load Temperature Differences for Calculating Cooling Load from Flat Roofs
(ASHRAE, 1985; 26.8) ... 18
Table 2 Cooling Load Temperature Differences for Calculating Cooling Load from Sunlit Group C Walls (ASHRAE, 1985; 26.10) ... 19
Table 3 CLTD Correction for Latitude and Month Applied to Walls and Roofs, North Latitudes (ASHRAE, 1985; 26.12) ... 19
Table 4 Maximum Solar Heat Gain Factor, Btu/h.ft2 for Sunlit Glass, North Latitudes (ASHRAE, 1985; 26.15) ... 20
Table 5 Cooling Load Factors for Glass Without Interior Shading, North Latitudes ASHRAE, 1985; 26.17) ... 20
Table 6 CLTD Cooling Loads for a Central Atrium Building with WI=0.5 using the Skylight Roof in Raleigh ... 21
Table 7 Well Index Validity ... 33
Table 8 Specification of Explored Atrium Cases ... 41
Table 9 Radiance Ambient Parameters ... 42
Table 10 U-value for Different Materials Used in This Study ... 43
Table 11 Climate Data for Raleigh, NC ... 43
Table 12 Daylight Metrics for Monitor and Skylight Roof in Central, Attached and Semi-Enclosed Atria ... 45
Table 13 Energy Performance of Central Atria Based on Well Index ... 46
Table 14 Energy Performance of Attached Atria Based on Well Index ... 48
Table 15 Exploration of Atrium Buildings Based on WI Through Point-in-Time Illuminance Values ... 52
Table 16 Peak Cooling and Heating Based on the Aperture Type in Atrium Buildings ... 55
Table 17 LEED Points for Daylit Floor Area: Spatial Daylight Autonomy (USGBC, 2013) ... 72
Table 18 LEED Points for Daylit Floor Area: Illuminance Calculation (USGBC, 2013) ... 73
Table 19 LEED Points for Daylit Floor Area: Measurement (USGBC, 2013) ... 74
LIST OF FIGURES
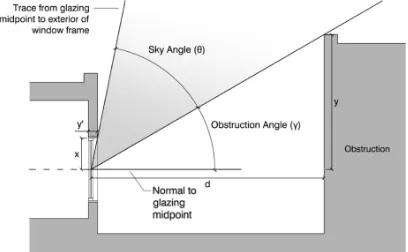
Figure 1. Sky Angle = Sky angle (θ) = 90º – arctan(y’/x) – arctan(y/d) (Otis & Reinhart, 2009; 6) ... 7
Figure 2. Daylighting Pattern Guide Interface (New Buildings Institute, 2015) ... 13
Figure 3. Atrium at the U.S. EPA Regional Headquarters, KS ... 14
Figure 4. Center for Advanced Energy Studies, Idaho Falls, ID, GSBS Architects (New Buildings Institute, 2015)... 14
Figure 5. KPMG European Headquarters, London, UK ... 14
Figure 6. James R. Thompson Center, Chicago, IL (A view on cities, 2015) ... 14
Figure 7. Smithsonian American Art Museum, Washington, D.C. (Foster + Partners, 2015) ... 14
Figure 8. Summary of the literature review map ... 28
Figure 9.Atrium types plan view (left to right): central, attached and semi-enclosed (Huang, 2003) 29 Figure 10. Aperture types (left to right) monitor w/3, monitor w/6, and horizontal skylight ... 30
Figure 11. Monitor roof glazing height ... 31
Figure 12. “Sliding” concept of individual floors in atria to calculate Well Index in individual levels ... 34
Figure 13. The impact of furniture on daylight using skylight aperture with WI= 0.5 ... 36
Figure 14. Plan view of the furniture layout in a typical office ... 37
Figure 15. Scale-model validation of DIVA for Rhino through 6-month data ... 39
Figure 16. Daylight sensor grids used in computer simulations ... 41
Figure 17. Point-in-time analysis of atrium buildings for WI=1 on Dec 21st at 9:00 a.m. under clear sky with sun ... 50
Figure 18. Comparison of average dynamic daylight metrics among atrium types with WI=0.5 and skylight roof (climate zone 3) ... 56
Figure 19. Comparison of average dynamic daylight metrics among atrium types with WI=1 and skylight roof (climate zone 3) ... 56
Figure 20. User Interface Design of Atrium Database ... 58
Figure 21. Point-in-time tab of the user interface ... 59
Chapter 1 INTRODUCTION
1.1 Research Goal
Buildings account for 41% of U.S. primary energy consumption and 74% of total U.S. electricity consumption (Department Of Energy, 2011). The growing need to lessen the use of energy in buildings calls for innovative ways to optimize the use of natural light in buildings. Augmenting the use of natural light not only helps with sustainable solutions, but also reduces energy costs. Conversely, to use natural light in buildings, architects often offer large expanses of glass for light, which often brings in too much heat if the light is not successfully controlled, forcing engineers to increase the cooling tonnage. As a result, there is a need to optimize the use of daylight in buildings and to provide an easy-to-use design tool for architects.
It is often complex to predict and optimize daylight in atrium buildings. In order to increase the desirable solar gain in buildings, this research proposes to investigate how an atrium building augments the amount of light entering the building and optimizes its energy consumption. This premise assumes atria within buildings act as urban courtyards, reflecting daylight performance at an urban scale. Therefore, the main research question is: what dimensional attributes of an atrium increase the desirable solar gain and optimize its energy consumption?
The goal of this dissertation is to provide architects with a daylight database to assist them with more energy-efficient design of atrium buildings. This research is therefore to achieve an atrium database to reduce energy consumption in the office building sector without using detailed energy calculations for designers.
1.2 Definition of Key Terms
This section clarifies the terms used in the literature of daylighting in atrium buildings.
Illuminance
According to Reinhart, illuminance is “the total luminance flux incident on a surface and is measured in lumen per unit area or lux.” (Reinhart, 2014; 79) Light flux is basically the amount of visible light perceived by human eye, measured in lumens.
Daylight Factor (DF)
Daylight Factor is a static daylight metric that quantifies the amount of diffuse daylight using a ratio of the interior illuminance and the outside illuminance (New Buildings Institute, 2015).
Climate-Based Daylight Modelling (CBDM)
CBDM is a daylight prediction model which defines various luminous quantities using sun and sky conditions derived from meteorological datasets. CBDM includes spatial daylight autonomy, annual sunlight exposure and useful daylight illuminance(Beckers, 2012).
Daylight Autonomy (DA)
Daylight Autonomy demonstrates the percentage of the occupied times of the year when the minimum illuminance requirement at the daylight sensor is met by daylight alone (Reinhart, Mardaljevic, & Rogers, 2006).
Useful Daylight Illuminance (UDI)
Useful Daylight Illuminance represents the annual illumination distribution for a space to reach a preordained illumination goal in a range of 100 lux-2000 lux (New Buildings Institute, 2015).
Spatial Daylight Autonomy (sDA)
space in which the illuminance level is greater than 300 lux for 50% of the occupied hours (Illuminating Engineering Society, 2012).
Annual Sunlight Exposure (ASE)
Annual Sunlight Exposure (ASE) is a metric describing the potential for excessive sunlight exposure by calculating the percentage of the space that exceeds a certain illuminance level more than a specified number of annual hours (Illuminating Engineering Society, 2012). For instance, ASE (1000, 250) represents the percentage of space in which the illuminance level is more than 1000 lux for 250 annual occupied hours.
Atrium Well Index (WI)
The daylight performance of an atrium depends on its geometry. Well Index is a quantifier that describes the three-dimensional proportion of an atrium. Equation 1 defines the Well Index according to Calcagni & Paroncini (Calcagni & Paroncini, 2004):
WI =height2 × width (width+length × length ) Eq. (1)
Based on this equation, the Well Index (WI) of a square-shaped atrium is measured as height divided by width, as the width of the atrium equals its length.
Chapter 2 LITERATURE REVIEW
2.1 Daylighting Rules of Thumb
2.1.1 Daylight Feasibility Test
The concept of having the minimum light flux entering a sidelit space was introduced in 1989 “Daylighting Manual” by Public Works and Government Services Canada (Reinhart, 2014). The light flux is a function of Window to Wall Ratio (WWR), visual transmission of the glazing unit てvis, and obstructions from neighboring buildings (Figure 1). Reinhart and Lo Verso defined the concept of a daylight feasibility test, stating that the minimum sky angle θ × WWR > 2000 (Reinhart & LoVerso, 2010). In this formula, WWR is measured in percentage, meaning that the minimum WWR for θ = 90 degrees that is an unobstructed façade is around 22% (2000 / 90 ~ 22 degrees). On the other end, a fully glazed façade (WWR = 80%) requires a sky angle of at least θ = 2000 / 80 = 25 degrees to be daylit.
Atrium rule of thumb, derived from the feasibility test, suggests that the ratio of height to width of an atrium should not exceed tan (22) ~ 2.5. This example implies that in a square shape atrium of 30 ft, the number of stories should not exceed five levels to have the ground level properly daylit (assuming floor to ceiling height is 10 ft and the height of ceiling interstitial space is 5 ft)
2.1.2 Limiting Depth
The next daylighting rule of thumb is the limiting depthfor daylit spaces. There are three estimating methods:
A) Daylight Uniformity ― defined by the following formula:
where:
Rmean: mean surface reflectance
w: room width in meters (Otis & Reinhart, 2009).
B) No skyline depth ― the depth at which the sky is no longer visible = (h window-head-height – work plane height) × tan (θ). (Ibid)
C) Depth of daylight ― calculated through 2.5 × h window-head-height (with no shading device) and 2.0 × h window-head-height (with shading device). (Ibid)
According to Otis & Reinhart, the greatest room depth that can be used for
2.1.3 How much light is enough
While meeting a code of practice does not necessarily result in well-lit spaces, many standards have provided minimum lighting requirements (USGBC, 2013). For example, the Illuminating Engineering Society recommended 300 lux for general task lighting
(Illuminating Engineering Society, 2012). Innes discussed that “the perception of brightness can sometimes be far more important than the actual measured light level” (Innes, 2012; 88). The Illuminating Engineering Society (IES) and the Leadership for Energy and
Environmental Design (LEED) made an effort to develop dynamic metrics such as sDA and ASE to more adequately assess well-lit spaces. For instance, LEED v.4 recommended that at least 50% of the space should meet a minimum daylight level of 300 lux for 50% of the occupancy hours (USGBC, 2013). The present study adopts these dynamic metrics and attempts to provide designers with the percentage of space meeting certain levels of illuminance with the considerations on glare and excessive brightness.
2.1.4 How much light is excessive
levels greater than 1000 lux for more than 250 occupancy hours in a year should not exceed 10% (USGBC, 2013).
2.2 Daylighting Performance Metrics
A subset of the literature seeks to understand daylight performance metrics in atria. Static daylight metrics, such as Daylight Factor, are based on individual sky conditions (i.e., overcast sky condition), while dynamic daylight metrics are defined with regard to a time series of illuminance or luminance over the whole calendar year. Reinhart et al. (2006) offered several examples indicating the benefits of making design decisions based on dynamic performance metrics rather than on static indicators.
Reinhart et al. (2006) and Leslie et al. (2012) explored the limitations of static daylight performance metrics, which are based on overcast sky conditions. The most
common static metric used to measure daylighting performance is Daylight Factor. Dynamic daylight metrics, on the contrary, are achieved by climate-based daylight modeling (CBDM). CBDM predicts various luminous quantities by using solar and sky conditions that are derived from meteorological datasets (Mardaljevic, Heschong, & Lee, 2009). Dynamic daylight metrics, such as Daylight Autonomy (DA) and Useful Daylight Illuminance (UDI), are therefore dependent upon both locale and orientation. As a result, using dynamic daylight metrics will significantly enhance the validity of daylighting assessments.
September 21) under a specific sky condition (clear sky or CIE overcast sky). This present research has adopted both the annual daylighting metrics and the point-in-time daylight method.
2.3 Daylighting Prediction Methods
Ander (2006) reviewed daylighting analysis tools including hand calculation, computer simulation, and physical modeling. Calcagni and Paroncini (2004) and Al-Turki and Schiler (1997) described daylight prediction methods for atrium buildings based on physical models by using the Daylight Factor. Littlefair (2002) examined analytical formulae as a technique to evaluate the average Daylight Factor in atria. Currently, a trend existing involving the application of computer tools to simulate and assess daylighting performance. Daylight algorithms adopted in these computer tools vary in how light paths are traced. For instance, the radiosity method accounts for diffuse light, whereas ray-tracing traces the light path through objects and measures the impact of its encounters in the scene (Radiance, 2014). Using an optimized computer simulation tool provides researchers with the ability to obtain daylight results for various cases in a timely manner and under controlled conditions.
Although a physical model has been tested to validate the results of the computer simulation, the present study primarily uses DIVA-for-Rhino, a climate-based daylight modeling tool.
1961-1990 and 1991-2000 (NREL, 2015). The standard file format for annual weather data is the Energy Plus Weather (EPW) file.
2.3.1 Existing Expert Systems
Since simulation tools require investment in time and professional skills, so-called “expert systems” have been developed to assess the impact of design on energy performance. Daylighting Pattern Guide, developed by the New Buildings Institute, in partnership with the University of Idaho and University of Washington, represents an example that provides daylighting performance for buildings, including atria (Figure 2). This expert system
Figure 2. Daylighting Pattern Guide Interface (New Buildings Institute, 2015)
2.4 Daylighting in Atrium Buildings
2.4.1 Why Atrium Buildings?
According to Sharples & Lash, the atrium “has become one of the most popular architectural forms of the last 40 years” (Sharples & Lash, 2007; 301). An atrium is
potentially a source of daylight in deep buildings. Because people spend up to 90% of their time in indoor spaces, access to daylight can improve their physiological health and
2.4.2 Atrium Buildings Case Studies
The following cases represent successful examples of the use of atria in buildings (Figures 3-7).
Figure 3. Atrium at the U.S. EPA Regional Headquarters, KS The atrium design provides most of the office space with natural light. The atrium's glass has a low emissive coating, receiving daylight while reflecting large percentages of the infrared spectrum, which controls heat gain (Whole Building Design Guide, 2005).
Figure 4. Center for Advanced Energy Studies, Idaho Falls, ID, GSBS Architects (New Buildings Institute, 2015)
Figure 5. KPMG European Headquarters, London, UK
Architect: KPF
British Council for Offices National Urban Workplace Award (2011) (KPF)
Figure 6. James R. Thompson Center, Chicago, IL (A view on cities, 2015)
2.4.3 Atria Factors Influencing Daylighting
Daylighting studies on atria often face the challenge of quantifying the relationship between daylighting performance and atrium attributes. Liu et al. (1991) presented the relationship between the shape index of an atrium and daylight quantity. Szerman (1992) reviewed the impact of atrium design parameters on the average Daylight Factor (DF) inside the adjoining spaces. He investigated the relation between atrium Well Index (WI) and the mean DF, providing a nomograph based on artificial sky measurements (Szerman, 1992). This subject was further studied by DeKay, who explored different building latitudes, using the aspect ratio of an atrium (L × W) / H2 (DeKay, 2010). His study examined the
relationship between DF and the street proportion between buildings.
Calcagni and Paroncini (2004) pointed out important atrium attributes that influenced daylight performance, including shape, roof aperture transmittance, and surface reflectance. Liu et al. (1991), Baker et al. (1993), and Kim and Boyer (1986) defined the shape of an atrium with WI (Calcagni & Paroncini, 2004). Littlefair (2002) probed for the correlations among geometrical properties of an atrium. Samant and Yang (2007) indicated that
quadrangular atria had the highest daylight performance among other geometries.
assumed 50% for wall reflectance, 80% for ceiling reflectance, and 20% for the floor reflectance in all cases.
Cole (1990) reproduced data to support the relation between the mean DF and the aspect ratio of an atrium (Well Index, Eq. 1) established by Cartwright.
2.5 Thermal Analysis and prediction methods
The thermal performance of atrium spaces has been examined by researchers such as Göçer (2006), by using computer simulation tools. This research found higher heating energy consumption than cooling in a central atrium in a warm temperate climate. It also found greenhouse effect on thermal performance of the atrium space, while the adjoining spaces were not investigated (Göçer, Tavil, & Özkan, 2006).
Efforts have been made in the present study to explore both heating and cooling loads in adjoining spaces in relationship to the atrium WI. To evaluate the impact of an atrium on building performances, there is a need to analyze energy performance besides daylighting. This research uses DesignBuilder, an energy simulation tool based on EnergyPlus, to perform thermal analysis to assess the energy performance of atrium designs. In addition to computer simulation, this section provides an analytical procedure to understand building load
calculations, including heating and cooling loads. To calculate heating loads, we consider heat loss through a building’s surfaces and heat loss through infiltration and ventilation.
heating and cooling loads, the peak heating and cooling loads are confirmed, by comparing the results of peak cooling loads with hand calculations.
Heating load through conduction is calculated based on Q= UA×∆T where U-value is the material conductivity, A represents the area of the building surface and ∆T is the
temperature difference between indoor and outdoor. Heating load through ventilation follows the same formula replacing UA with 1.08×CFM, where cubic feet per minute (CFM)
represents the volume of outdoor air that needs to be heated. To calculate the difference between the inside and outside temperature, we use heating degree-hours (HDH) which reflects the difference in temperature for annual hours based on the ASHRAE typical year data.Peak cooling loads are often more complicated to measure, because of the time dependent heat transfer due to solar radiation through the thermal mass. The following are common methods to calculate cooling loads through simplified equations (Terry, 2015):
- Transfer Function Method - Finite Difference Method - Bin Method
- Cooling Load Temperature Difference (CLTD) Method
2.5.1 Building Load Calculations with Cooling Load Temperature Difference (CLTD)
calculated for a specific time and day of a year. The following formula can be used to compute cooling load.
Q cooling load = Q walls & roof + Q fenestration + Q ventilation + Q people & equipment
Eq. (2) Heat transfer through the wall and roof are computed using the CLTD method.
Q walls & roof = U.A. CLTD correction where
Eq. (3) CLTD correction = (CLTD base + LM) + (78-Ti) + (To-85)
Eq. (4) CLTD baseis looked up using tables provided by ASHRAE (1985 Fundamentals Handbook). CLTD base for roof and walls is provided in Tables 5 and 7 respectively in Chapter 26 of the ASHRAE 1985 Fundamentals Handbook. See (Table 1) and (Table 2) CLTD base for walls are categorized based on the construction group.
Table 1
Cooling Load Temperature Differences for Calculating Cooling Load from Flat Roofs (ASHRAE, 1985; 26.8)
With Suspended Ceiling
Roof No
Description of
construction Weight U-value
Solar Time 14
3
Table 2
Cooling Load Temperature Differences for Calculating Cooling Load from Sunlit Group C Walls (ASHRAE, 1985; 26.10)
Solar Time
Wall
facing 14
N 9
NE 20
E 27
SE 24
S 14
SW 13
W 13
NW 11
LM: Latitude month correction
LM is derived for Raleigh’s latitude: 35.8° N based on the orientation of the surface from Table 9 in Chapter 26 of the ASHRAE 1985 Fundamentals Handbook. See (Table 3)
Table 3
CLTD Correction for Latitude and Month Applied to Walls and Roofs, North Latitudes (ASHRAE, 1985; 26.12)
Lat. Month N NNE
NNW NE NW ENE WNW E W SSE WSW SE SW SSE SSW
S HOR
32 May/Jul 1 1 1 0 0 -1 -1 -3 -3 1
40 May/Jul 0 0 0 0 0 0 0 0 1 1
In Equation 4, Ti: Temperature Inside To: Average Temperature Outside
For windows, there are two factors to be considered. The first is a conduction/ convection effect like a wall. The second is radiation that is transmitted through the glass.
Q fenestration = U.A. CLTD window + A × SC × SHGF × CLF
CLTD window can be looked up in Table 10 on Page 26.14 of the ASHRAE 1985 Fundamentals Handbook.
SC: shading coefficient depends on shading type and fenestration material (can be looked up in tables 34-37, pages 27. 34-35 ASHRAE 1985 Fundamentals Handbook)
This study uses SC=0.88 Btu/hr.ft2.F for insulating glass with 1/8 inch thickness.
SHGF: solar heat gain factor varies based on the orientation at certain latitude (can be looked up in pages 26. 15-16) See (Table 4)
Table 4
Maximum Solar Heat Gain Factor, Btu/h.ft2 for Sunlit Glass, North Latitudes (ASHRAE, 1985; 26.15)
36° N
N (shade) E/W S HOR
July 39 216 90 268
CLF: cooling load factor converts radiation to heat and depends on thermal mass, time and interior shading (can be looked up in pages 26. 17-18 1985 Fundamentals Handbook) This study uses CLF for glass without interior shading at solar time 14:00 and assumes medium construction. Table 5 describes related details.
Table 5
Cooling Load Factors for Glass Without Interior Shading, North Latitudes ASHRAE, 1985; 26.17)
Fenestration
facing N E W HOR
CLF 0.75 0.31 0.29 0.67
In order to better understand the computation, we calculate annual heating and cooling loads for July 9 at 14:00 for a central atrium building with skylight aperture orientation. Heating load for the central atrium building with a WI of 0.5 in Raleigh with given dimensions is as follows:
• (UA)Wall = 0.062×(2×15×(90+146)) Btu/hr-F
• (UA)Roof = 0.044×((90×146)-(30×86)) Btu/hr-F
• (UA)Floor = F-factor×Perimeter = 0.35×2×(146+90) Btu/hr-F
• (UA)Glazing = 0.345×(86×30) Btu/hr-F
• (UA)Infiltration = 1.08×CFM =1.08×(5 cfm/people×45 people) + (0.06 cfm/ft2×13140 ft2) =
1094.47 (based on ASHRAE, 2009)
Q Annual heating = UA total× Heating Degree-Hours (35160) = 107.35 kBtu×10^3 Table 6
CLTD Cooling Loads for a Central Atrium Building with WI=0.5 using the Skylight Roof in Raleigh
Q cooling-July 9 at 14:00
1. ENVELOPE British Units Results
OPAQUE EXTERIOR WALLS
Area [ft2] 7080
U-value [Btu/h-ft2-oF] 0.062
CLTD correction [oF] 11.7
Wall heat gain [Btu/h] 5136
Roof Horizontal Glazing
Table 6 Continued
U-value [Btu/h-ft2-oF] 0.345
Aperture heat gain [Btu/h] 419,244
Roof Opaque Area
Area [ft2] 10560
U-value [Btu/h-ft2-oF] 0.044
CLTD correction 46.7
Roof heat gain [Btu/h] 21699
2. VENTILATION
ventilation requirements [cfm/person] 10
ventilation requirements [cfm/ft2] 0.12
total ventilation needed [cfm] 2880
ΔW [lbmwater/lbmdry air] 10
total ventilation heat gain [Btu/h] 126131
3. INTERNAL GAINS
PEOPLE
sensible heat gain per person [Btu/h] 250
latent heat gain per person [Btu/h] 200
total heat gain per person [Btu/h] 450
total people heat gain - sensible [Btu/h] 11250
Table 6 Continued
total people heat gain [Btu/h] 20250
EQUIPMENT
number of computers & monitors [#] 45
computer & monitor heat gain [W] 150
total equipment heat gain [Btu/h] 23018
total cooling load [kBtu/h] 615
Comparing computer heating loads for an atrium with WI=0.5 using a skylight roof (98.08 kBtu×10^3) with the hand calculation result (107.35 kBtu×10^3) demonstrates a valid 9% difference. This study has also simulated cooling loads for July 9 at 14:00, resulting in 616.26 kBtu. The comparison between the computer simulation and CLTD hand calculation (615 kBtu) verifies the validity of cooling load computation.
2.6 LEED Requirements for Daylighting
of silver (50-59 points), gold (60-79 points), and platinum (80+ points). In 2009, LEED developed EQc8.1 for daylighting, through which a project could earn up to 2 points. This study considers LEED version 4 requirements to assess the atrium buildings. LEED v.4 suggests using sDA and ASE to evaluate buildings, by using three different options (Appendix A).
2.7 Literature Synthesis
Figure 8 summarizes outcomes of this literature review. This list of studies generally summarizes what has been covered by the efforts of previous researchers. It also introduces some important issues and limitations to be addressed by future research:
• Daylight Factor was used in the previous studies as a performance metric to assess
• Climate-based daylight modeling is a daylight prediction model that defines various
luminous quantities using sun and sky conditions derived from meteorological datasets. CBDM uses Daylight Autonomy and Useful Daylight Illuminanceas performance metrics (Mardaljevic, Heschong, & Lee, 2009). As a tool to conduct CBDM, DIVA-for-Rhino was developed by the Graduate School of Design at Harvard University. “It is a highly optimized daylighting and energy modeling plug-in for the Rhplug-inoceros NURBS modeler” (Solemma LLC, 2014). Compared to the conventional Daylight Factor approach that only involves overcast sky condition, DIVA uses TMY3 weather data to calculate climate-based results. However, including climate as a factor can make the results less broadly applicable, because they are climate-specific. For example, the daylighting results assessed in a building located in rainy Seattle cannot be applied to the same building design located in sunny Phoenix. As the starting point of developing the database, this present study focuses on climate zone 3 based on U.S. climate zones. However, replicating computer simulations for all eight climate zones in the United States (based on Department of Energy’s classification) will complete the data set.
• The previous studies tend to address the averaged daylight quantities across all
adjoining floors by using Mean Daylight Factor. However, the daylight performances at individual floors (e.g., top, bottom, and middle floors) were not studied separately. • The impact of atrium roof aperture has not been a focus of the previous studies, in
• Limitations of previous expert systems for designers.
To address the above issues, this dissertation is intended to apply the CBDM approach in the assessment of atrium buildings in terms of daylight quantity. Specifically, the objectives are:
• To use the climate-based daylight modeling (CBDM) approach to assess atrium and
adjoining spaces by using the WI (Equation 1) as the method of characterizing atrium proportions;
• To examine the impact of atrium aperture type — central, attached and semi-enclosed
atria;
• To examine the impact of atrium roof aperture type on daylight performance; • To examine the impact of furniture layout on daylight metrics; and
• To provide architects with a database to assist them with evaluating the performance
of atrium buildings without conducting complex computer simulations. To simplify the research and limit the number of parameters, the following assumptions are established:
• The atrium shape is assumed to be quadrangular with the focus on north- and
south-facing spaces due to the undesirable eastern and western daylight exposures. • Roof glazing transmittance and surface reflectance are set to be constant across
different options.
(facades facing the streets) (Beckers, 2012). Therefore, the atrium’s contribution is
Figure 8. Summary of the literature review map
Daylight in Atrium Buildings
Daylighting Performance Metrics
sDA and ASE (IES LM-83-12, 2012)
Dynamic metrics: Reinhart, 2010
Daylighting Prediction Methods
Computer simulation: (Reinhart, 2014)
DIVA (Solemma LLC)
Experiment: (Calcagni & Paroncini, 2004)
Formulae: (Littlefair, 2002)
Atria Factors
Important constraints of an atrium that influence daylight performance, including shape, roof aperture transmittance, and surface reflectance( Calcagni and
Paroncini, 2004)
Cole (1990) reproduced data to support the relation between the mean Daylight Factor and the aspect ratio
of an atrium
Atria reflectance distribution (Samant and Yang, 2007) Atrium geometry: (DeKay, 2010)
Thermal Analysis of Atrium Buildings
1985 and 2009 ASHRAE Handbook of Fundamentals
ASHRAE Standard 55 and 62.1 (2013)
Design Builder (NREL) Göçer, Tavil, & Özkan, 2006
Daylighting Rules of Thumb
minimum sky angle θ * WWR > 2000 (Reinhart & LoVerso, 2010)
Well Index (Szerman, 1992) & (Samant and Yang, 2007) & (Cartwright, 1986)
Daylighting handbook (Reinhart, 2014)
The concept of having the minimum light flux entering a sidelit space was introduced in 1989 “Daylighting Manual” by Public Works and Government Services
Chapter 3 RESEARCH METHODOLOGY
3.1 Conceptual Framework
One of the objectives of this research is to provide architects with a design database to assist them in evaluating the performance of atrium buildings without investing a
substantial amount of time in energy analysis. To build such a database for atrium buildings, this project focuses on daylighting and thermal performances (output) based on the climate in Raleigh, NC. Daylight performance is assessed by spatial Daylight Autonomy (sDA) and Annual Sunlight Exposure (ASE), and thermal evaluation is based on annual heating and cooling loads. Atrium factors that are considered in the study consist of atrium type,
proportion (Well Index), and roof aperture type as the primary independent variables (input). In all simulations in this study, daylight is measured in two areas that measure 30 ft
×
30 ft adjacent to north and south of the atrium.3.1.1 Atrium Types
Figure 9 represents common atrium types. This study examines central and attached atria. The daylight results in atria have the potential to be applied in urban settings, assuming
an atrium as an open urban space.
3.1.2 Roof Aperture Types
This research considers monitor and horizontal skylight aperture types, because of their prevalent use in buildings (
Figure 10). Monitor roof apertures have the advantage of providing the space
primarily with diffuse light, while horizontal skylights tend to introduce direct sun beams that
cause glare.
Figure 10. Aperture types (left to right) monitor w/3, monitor w/6, and horizontal skylight
To assess the effect of monitor glazing height, this research examined daylight metrics for atria with the same Well Index but different glazing height equal to one third and one sixth of atrium width (w). This hypothesis is tested in atrium buildings with glazing heights smaller than one sixth of the atrium’s width. Though assuming a glazing height of one half the atrium’s width demonstrates higher spatial Daylight Autonomy, it potentially causes glare and may not be architecturally feasible. For instance, a two-story building with an atrium 30 ft wide does not need a monitor roof height of 15 ft. The results, shown in
Figure 11 illustrates the increase in sDA and ASE based on the increase in monitor glazing height. The results demonstrate that sDA300, 50% is greater than 50% when the monitor glazing height exceeds one sixth of atrium width, while smaller heights do not have a great impact on sDA and ASE. It is therefore empirically concluded to control monitor glazing height by running simulations for monitor glazing height equal to one third and one sixth of atrium width.
Figure 11. Monitor roof glazing height
3.1.3 Well Index and its Validity
As it was mentioned, Well Index (WI) is used to characterize and measure the obstructive effects in atrium buildings.
WI =height (width + length)2 × width × length
It has been demonstrated that Well Index is an effective indicator for characterizing atrium proportions in studies based on Daylight Factor (Calcagni & Paroncini, 2004; DeKay, 2010). In this section, we are investigating the validity of the Well Index for characterizing atrium proportion when dynamic daylighting approach (CBDM) is adopted. Specifically, the questions are:
• Will atria with the same Well Index result in the same averaged dynamic daylight
metrics, across all floors?
• Will atria with the same Well Index result in the same dynamic daylight metrics at the
bottom floor?
For instance, the following two atria have the same Well Index (WI=1).
• 60 ft
×
60 ft central atrium in a four-story building (building height = 15 ft×
4= 60 ft)• 45 ft
×
225 ft central atrium in a five-story building (building height = 15 ft×
5= 75 ft)streamline the creation of the proposed atrium design database, because it is not practically feasible to list performance data for all possible atrium dimensions.
Table 7
Well Index Validity
Roof
type Height
Atrium width Atrium depth Avg sDA300, 50% Avg ASE1000, 250 Bottom sDA300, 50% Bottom ASE1000, 250
Cooling/ft3 Heating/ft3
Central Atrium WI=1
skylight 4
×
15 60 60 0.63 0.51 0.29 0.33 2.73 0.59skylight 5
×
15 75 75 0.63 0.51 0.25 0.33 3.59 0.55skylight 5
×
15 45 225 0.63 0.46 0.25 0.33 3.49 0.55monitor
w/3 4
×
15 60 60 0.5 0.29 0.17 0.08 1.65 1.22monitor
w/3 5
×
15 75 75 0.55 0.32 0.17 0.08 1.23 1.11Central Atrium WI=0.5
skylight 3
×
15 90 90 0.81 0.67 0.59 0.58 3.50 0.61skylight 5
×
15 100 300 0.85 0.67 0.65 0.58 2.15 0.66Attached Atrium WI=0.5
skylight 4
×
15 120 120 1 0.8 1 0.77 3.50 0.61skylight 5
×
15 100 300 0.97 0.75 0.94 0.67 2.15 0.66Central Atrium WI=2
skylight 4
×
15 30 30 0.33 0.24 0 0 2.68 0.52skylight 5
×
15 37.5 37.5 0.31 0.22 0 0 2.20 0.56skylight 5
×
15 25 75 0.32 0.24 0 0 2.20 0.56This research has also tested whether the daylight level remains the same in
indicate that sDA and ASE remain the same for the bottom floor in different atrium buildings with the same Well Index. To predict the daylight level at any other adjoining floor of an atrium, one can imagine the atrium floor is “sliding” up to become flush with the floor of interest, which will result in a new atrium proportion and a new Well Index. Now the floor of interest has been transformed into the bottom floor of a new atrium building and its
performance can be predicted by using the bottom floor performance data obtained from an atrium with the same Well Index. For example, Figure 12 shows this thought process for assessing the top floor in a 60 ft×60 ft four-story building as the one in a 45 ft×225 ft five-story building, with both having a Well Index = 1.00. Comparing the two cases, researchers realized that individual floors have the same performance if the Well Index of that individual floor is the same. To be more specific, every single floor could be treated as a building with a Well Index characterization and this Well Index will give the same energy modeling results no matter which floor number it has.
For instance, the WI third floor in a 30 ft×30 ft four-story atrium is 1.00 and its daylight and energy performance are the same as the ones in the first floor of a two-story building with an atrium of 30 ft×30 ft. Figure 12 illustrates the idea that by “sliding” individual floors,
we can calculate the WI of that specific floor, which gives the same energy performance in atria with the same Well Index but with different building proportions.
Heating and cooling per the cubic feet of the atrium itself has been calculated and confirmed that they remain the same among atrium with the same Well Index under the same conditions. As mentioned before, conditions include the climate, atrium type, roof aperture design and material properties, which are controlled in this study. This finding provides researchers with the fact that the Well Index not only provides them with the average dynamic daylight metric, but it gives information for every individual floor. The reason behind this is explained by the sky angle, which changes based on the height and width of the atrium. Therefore, this research concluded to calculate dynamic daylight metrics and energy performance of atria for 0.1 intervals of atrium Well Index atrium to cover more dimension variations.
3.1.4 Furniture
rather than simulated annual results. Since furniture arrangements result in diverse
illuminance distributions under different sky and solar conditions, this study suggests that the impact of furniture be assessed by computer simulation.
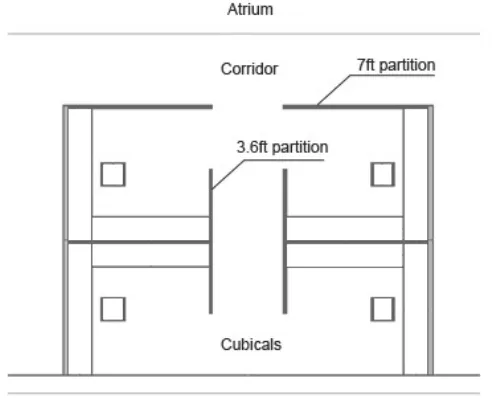
The simulation is conducted in a 30 ft×30 ft space to the south of a central atrium with a skylight roof and WI= 0.5 in Raleigh, NC. An unfurnished open space serves as the base case. Case 1 includes a combination of 7 ft and 3.6 ft-high office partitions. These models are simulated in DIVA for Rhino, assuming furniture reflectance value of 45% (recommended by IES, 2012). The results show a 27% decrease from the base case (unfurnished) to case 1 (furnished), with a 6% difference in ASE1000, 250 (Figure 13).
Base case Case 1
sDA300, 50% 0.94 0.67
ASE1000, 250 0.50 0.44
ASE3000, 250 0.17 0.17
Based on these assessments, this research suggests that partitions be included in simulations (Figure 14). Since different reflectance values did not considerably change the results, future simulations will be done using 45-50% as the furniture reflectance.
3.2 Research Method
This study applies a two-stage research design including Scale-Model Experimentfor Validating computer simulation and Computer-basedSimulation as the primary tool for assessing daylighting models.
3.1.5 Validating Computer Simulation by Scale-Model Experiment
Useful Daylight Illuminance (UDI - 100-2000 lux) between scale-model data and computer simulation is compared in this study, because it addresses both lower and upper thresholds. UDI is defined as the percentage of hours that fall between 100-2000 lux for a point of interest in a space. Another reason to use UDI, instead of sDA, is because only one sensor is placed at each adjoining space, while sDA and ASE measurements require a grid of
sensors to provide the percentage of space that meets a certain level of daylight.
Figure 15 shows the comparison between computer simulation and physical scale model testing results for all north-wing sensors (A1, A5, A9, A13) and south-wing sensors (A3, A7, A11, A15). The results show that performance data UDIs obtained from physical model testing and computer simulation are reasonably close.
3.1.6 Computer-Model Simulation
Atrium sizes are estimated based on the average size for small office parcels in Raleigh, NC (ASHRAE, Advanced Energy Design Guide for Small Office Buildings: 30% Energy Savings, 2011). Based on the maximum potential depth for daylight penetration, the depth of the adjoining spaces is assumed to be 30 ft, and floor-to-ceiling height is 10 ft, and the height of ceiling interstitial space is 5 ft. This study assumes generic materials with typical surface reflectance for the floor at 20%, the ceiling at 80%, the wall at 50% and double-pane low-E glass at 65% transmittance for roof glazing. The atrium partition (the wall between atrium and adjoining space) is defined as a single-pane glazing with 88%
transmittance.
Table 8
Specification of Explored Atrium Cases
WI Atrium dimensions (ft) Height
0.1 150×150 1×15
0.2 90×90 1×15
0.3 90×30 1×15
0.4 25×75 1×15
0.5 90×90 3×15
1 90×30 3×15
1.5 40×40 4×15
2 25×75 5×15
3.1.6.1 Daylight Simulation Settings
Illuminance values are simulated in a 30×30 ft area adjacent to the north and south side of an atrium, where light sensors are placed on a 3.5×3.5 ft grid (Figure 16).
Radiance uses a series of parameters to simulate a daylit space: Ambient bounces (ab) represent the number of reflections between the surfaces, which, along with ambient division, can have a significant impact on the accuracy of daylight output. Ambient division (ad) and super-samples set the number of samples sent. Ambient resolution (ar) specifies the
maximum error, scene dimension, and the sampling cutoff point. Table 9 summarizes the minimum, accurate, and maximum radiance ambient parameters, on which this study is based (Ward, 2014).
Table 9
Radiance Ambient Parameters
Parameters Description Min Fast Accurate Current
Research
Max
ab ambient bounces 0 0 2 6 8
aa ambient accuracy .5 .2 .15 .1 0 *
ar ambient resolution 8 32 128 300 0 *
ad ambient divisions 0 32 512 1000 4096
as ambient super-samples 0 32 256 256 1024
* Maximum value disables optimization and can be very expensive
3.1.6.2 Thermal Simulation Settings
The atrium is modeled in Design Builder with adiabatic walls between atrium and adjoining spaces. Cloning each story of the building on top of the other automatically
Table 10
U-value for Different Materials Used in This Study
Building material U-value
Roof: Asphalt+Air gap+Plasterboard 0.044
Wall: Brickwork+XPS extruded polystyrene+Concrete block 0.062
Ground floor: UF foam+Cast concrete+screed+Wooden flooring 0.35
Roof glazing: Double-pane Low-E 65% 0.345
Table 11
Climate Data for Raleigh, NC
Climate data for Raleigh, ASHRAE Cooling 0.4% Data
Cooling dry bulb Temperature [oF] 94.1
Humidity ratio [lbs moisture/lb dry air] 0.016
Summer occupied setpoint [oF] 76
Summer occupied humidity ratio [lbs moisture/lb dry air] 0.0096
Total Solar Radiation - Horizontal [Btu/ft2/day] 75
Average Outside temperature in July 9th 80.7
CLIMATE DATA, ASHRAE Heating 99.6% Data
Heating dry bulb Temperature [oF] 16
Chapter 4 RESEARCH FINDINGS AND CONCLUSION
This study has investigated the effects of atrium proportion (characterized by Well Index), roof aperture design (skylight and monitor) and atrium type (central and attached) on daylighting and energy performances. While Well Index was used in previous studies to assess daylit atria in terms of Daylight Factor, this study has evaluated the validity of Well Index for characterizing atrium proportion by using climate-based metrics and concluded that atria sharing the same Well Index will have lighting and energy performances that are
significantly close. This finding implies that one can simulate a series of atria with distinct Well Index values (e.g., from WI= 0.1 to WI= 2 with 0.1 intervals). The lighting and energy performance data associated with each of the WI values can form a database. This will allow designers to calculate the Well Index of their own specific atrium design, and use the
calculated WI value to look up its performance in the database. In addition, different roof aperture design and atrium type are added as additional design parameters for each Well Index value in the database.
4.1 Lighting Assessment
Table 12 summarizes daylight results for central, attached and semi-enclosed atria with monitor and skylight as roof apertures, based on a Well Index of 0.5, 1 and 2.With other parameters, such as the climate, adjoining space depth, material reflectance, material transmittance, furniture and monitor roof glazing height, the results potentially provide architects with a preliminary atrium design database for Raleigh, NC.
Table 12
Daylight Metrics for Monitor and Skylight Roof in Central, Attached and Semi-Enclosed Atria
Atrium Type WI Roof Type sDA300, 50% ASE1000, 250 ASE3000, 250
Central
0.5 monitor w/3 0.59 0.38 0.20
0.5 monitor w/6 0.44 0.25 0.14
0.5 skylight 0.64 0.52 0.31
1 monitor w/3 0.38 0.25 0.13
1 monitor w/6 0.22 0.11 0.04
1 skylight 0.45 0.40 0.24
2 monitor w/3 0.25 0.20 0.09
2 monitor w/6 0.10 0.05 0.04
2 skylight 0.27 0.24 0.04
Attached
0.5 monitor w/3 0.92 0.59 0.30
0.5 monitor w/6 0.87 0.51 0.19
0.5 skylight 0.95 0.61 0.31
1 monitor w/3 0.58 0.38 0.13
1 monitor w/6 0.55 0.25 0.09
1 skylight 0.60 0.40 0.19
2 monitor w/3 0.54 0.39 0.15
2 monitor w/6 0.53 0.33 0.09
2 skylight 0.63 0.49 0.21
Semi-enclosed
0.5 monitor w/3 0.73 0.67 0.41
0.5 monitor w/6 0.67 0.59 0.26
0.5 skylight 0.77 0.67 0.44
1 monitor w/3 0.93 0.69 0.43
1 monitor w/6 0.89 0.70 0.37
1 skylight 1.00 0.70 0.48
2 monitor w/3 0.87 0.69 0.45
2 monitor w/6 0.86 0.70 0.39
4.1.1 Climate-Based Metrics
More simulations have been conducted to cover more WIs with denser intervals (Table 13 and Table 14). Certain data are constructed by using the linear interpolation method. Interpolation is a method to generate new data within a discrete set of known data points, using the following equation:
Eq. (6) Using CBDM has limited the results to a certain climate zone such as the one in which Raleigh is located (zone 3). The current project is intended to develop a methodology for this type of research. The database certainly needs more entries to cover more climate conditions beyond Raleigh, NC.
Table 13
Energy Performance of Central Atria Based on Well Index
WI Roof Avg
sDA
Avg ASE1000
Avg
ASE3000 sDA ASE1000 ASE3000 Cooling Heating
0.1 monitor w/3 0.9 0.53 0.19 0.9 0.53 0.19 1.68 1.09
0.1 monitor w/6 0.58 0.26 0.08 0.58 0.26 0.08 1.92 0.89
0.1 skylight 0.86 0.65 0.31 0.86 0.65 0.31 9.49 0.70
0.2 monitor w/3 0.69 0.44 0.19 0.69 0.44 0.19 2.26 1.11
0.2 monitor w/6 0.56 0.32 0.1 0.56 0.32 0.1 2.41 0.83
0.2 skylight 0.72 0.56 0.31 0.72 0.56 0.31 9.22 0.66
0.3 monitor w/3 0.63 0.42 0.19 0.63 0.42 0.19 3.41 1.23
0.3 monitor w/6 0.35 0.11 0 0.35 0.11 0 3.17 0.99
0.3 skylight 0.67 0.58 0.31 0.67 0.58 0.31 10.55 1.18
0.4 monitor w/3 0.6 0.42 0.19 0.6 0.42 0.19 3.27 1.03
0.4 monitor w/6 0.29 0.14 0.08 0.29 0.14 0.08 2.89 0.78
0.4 skylight 0.42 0.31 0.08 0.42 0.31 0.08 9.93 0.62
0.5 monitor w/3 0.59 0.38 0.2 0.43 0.33 0.22 1.40 0.98
0.5 monitor w/6 0.44 0.25 0.14 0.33 0.19 0.17 1.25 0.65
0.5 skylight 0.64 0.52 0.31 0.6 0.47 0.31 2.15 0.66
0.6 monitor w/3 0.55 0.36 0.18 0.38 0.28 0.20 1.45 1.03
0.6 monitor w/6 0.40 0.22 0.12 0.28 0.17 0.14 1.23 0.67
Table 13 Continued
0.7 monitor w/3 0.51 0.33 0.17 0.33 0.23 0.17 1.50 1.08
0.7 monitor w/6 0.35 0.19 0.10 0.23 0.15 0.11 1.22 0.69
0.7 skylight 0.57 0.48 0.28 0.46 0.38 0.28 2.38 0.64
0.8 monitor w/3 0.47 0.30 0.16 0.28 0.18 0.14 1.55 1.13
0.8 monitor w/6 0.31 0.16 0.08 0.20 0.13 0.10 1.20 0.71
0.8 skylight 0.53 0.46 0.27 0.39 0.34 0.24 2.50 0.62
0.9 monitor w/3 0.42 0.28 0.14 0.22 0.13 0.11 1.60 1.17
0.9 monitor w/6 0.26 0.12 0.06 0.16 0.10 0.09 1.18 0.74
0.9 skylight 0.50 0.43 0.25 0.32 0.29 0.21 2.61 0.61
1 monitor w/3 0.38 0.25 0.13 0.17 0.08 0.08 1.65 1.22
1 monitor w/6 0.22 0.09 0.04 0.13 0.08 0.08 1.16 0.76
1 skylight 0.46 0.41 0.24 0.25 0.25 0.17 2.73 0.59
1.1 monitor w/3 0.33 0.21 0.11 0.16 0.08 0.08 1.58 1.15
1.1 monitor w/6 0.18 0.07 0.03 0.09 0.06 0.06 1.14 0.77
1.1 skylight 0.40 0.36 0.21 0.23 0.23 0.17 2.73 0.58
1.2 monitor w/3 0.28 0.18 0.08 0.15 0.08 0.07 1.51 1.08
1.2 monitor w/6 0.13 0.05 0.02 0.06 0.05 0.03 1.11 0.78
1.2 skylight 0.35 0.31 0.18 0.22 0.22 0.16 2.72 0.57
1.3 monitor w/3 0.22 0.14 0.05 0.14 0.08 0.05 1.44 1.01
1.3 monitor w/6 0.09 0.03 0.01 0.04 0.03 0.02 1.08 0.79
1.3 skylight 0.29 0.26 0.15 0.20 0.20 0.13 2.72 0.56
1.4 monitor w/3 0.17 0.11 0.03 0.13 0.08 0.03 1.37 0.95
1.4 monitor w/6 0.05 0.02 0.01 0.02 0.02 0.01 1.06 0.80
1.4 skylight 0.23 0.22 0.12 0.19 0.19 0.11 2.72 0.56
1.5 monitor w/3 0.11 0.07 0 0.11 0.07 0 1.29 0.88
1.5 monitor w/6 0 0 0 0 0 0 1.03 0.80
1.5 skylight 0.17 0.17 0.08 0.17 0.17 0.08 2.72 0.55
1.6 monitor w/3 0.15 0.10 0.02 0.09 0.06 0.00 1.22 0.88
1.6 monitor w/6 0.03 0.02 0.01 0.00 0.00 0.00 0.97 0.80
1.6 skylight 0.19 0.18 0.07 0.15 0.15 0.06 2.71 0.54
1.7 monitor w/3 0.19 0.13 0.03 0.07 0.05 0.00 1.15 0.87
1.7 monitor w/6 0.06 0.03 0.02 0.00 0.00 0.00 0.92 0.81
1.7 skylight 0.21 0.19 0.06 0.13 0.13 0.05 2.70 0.53
1.8 monitor w/3 0.23 0.15 0.05 0.05 0.03 0.00 1.08 0.87
1.8 monitor w/6 0.09 0.05 0.02 0.00 0.00 0.00 0.86 0.81
1.8 skylight 0.23 0.21 0.06 0.12 0.12 0.03 2.70 0.53
1.9 monitor w/3 0.26 0.18 0.07 0.02 0.02 0.00 1.01 0.86
1.9 monitor w/6 0.13 0.06 0.03 0.00 0.00 0.00 0.79 0.82
1.9 skylight 0.25 0.22 0.05 0.10 0.10 0.02 2.69 0.52
2 monitor w/3 0.3 0.21 0.09 0 0 0 0.94 0.86
2 monitor w/6 0.15 0.07 0.04 0 0 0 0.74 0.83
Table 14
Energy Performance of Attached Atria Based on Well Index
WI Roof Avg
sDA
Avg ASE1000
Avg
ASE3000 sDA ASE1000 ASE3000 Cooling Heating
0.1 monitor w/3 1 0.69 0.19 1 0.69 0.19 1.68 1.09
0.1 monitor w/6 1 0.47 0.1 1 0.47 0.1 1.92 0.89
0.1 skylight 1 0.83 0.31 1 0.83 0.31 9.49 0.70
0.2 monitor w/3 1.00 0.61 0.28 1.00 0.61 0.28 2.26 1.11
0.2 monitor w/6 0.94 0.47 0.1 0.94 0.47 0.1 2.41 0.83
0.2 skylight 1.00 0.64 0.31 1.00 0.64 0.31 9.22 0.66
0.3 monitor w/3 0.67 0.42 0.16 0.67 0.42 0.16 3.41 1.23
0.3 monitor w/6 0.49 0.25 0.08 0.49 0.25 0.08 3.17 0.99
0.3 skylight 0.69 0.61 0.31 0.69 0.61 0.31 10.55 1.18
0.4 monitor w/3 0.67 0.53 0.19 0.67 0.53 0.19 3.27 1.03
0.4 monitor w/6 0.64 0.36 0.08 0.64 0.36 0.08 2.89 0.78
0.4 skylight 0.78 0.61 0.31 0.78 0.61 0.31 9.93 0.62
0.5 monitor w/3 0.92 0.59 0.30 0.83 0.56 0.31 1.40 0.98
0.5 monitor w/6 0.87 0.51 0.19 0.79 0.54 0.28 1.25 0.65
0.5 skylight 0.95 0.61 0.31 0.89 0.57 0.31 2.15 0.66
0.6 monitor w/3 0.85 0.55 0.26 0.75 0.50 0.27 1.45 1.03
0.6 monitor w/6 0.80 0.46 0.17 0.72 0.48 0.25 1.23 0.67
0.6 skylight 0.88 0.57 0.29 0.81 0.52 0.27 2.27 0.65
0.7 monitor w/3 0.78 0.50 0.23 0.68 0.44 0.23 1.50 1.08
0.7 monitor w/6 0.73 0.41 0.15 0.65 0.43 0.22 1.22 0.69
0.7 skylight 0.81 0.52 0.26 0.73 0.47 0.23 2.38 0.64
0.8 monitor w/3 0.71 0.46 0.20 0.60 0.38 0.19 1.55 1.13
0.8 monitor w/6 0.67 0.36 0.13 0.57 0.37 0.18 1.20 0.71
0.8 skylight 0.74 0.48 0.24 0.65 0.42 0.19 2.50 0.62
0.9 monitor w/3 0.65 0.42 0.17 0.52 0.32 0.15 1.60 1.18
0.9 monitor w/6 0.61 0.31 0.11 0.50 0.31 0.15 1.18 0.74
0.9 skylight 0.67 0.44 0.22 0.57 0.38 0.15 2.62 0.61
1 monitor w/3 0.58 0.38 0.13 0.44 0.25 0.11 1.65 1.22
1 monitor w/6 0.55 0.25 0.09 0.42 0.25 0.11 1.16 0.76
1 skylight 0.60 0.40 0.19 0.49 0.33 0.11 2.73 0.59
1.1 monitor w/3 0.61 0.40 0.17 0.48 0.29 0.15 1.58 1.15
1.1 monitor w/6 0.58 0.29 0.13 0.46 0.28 0.15 1.14 0.77
1.1 skylight 0.63 0.42 0.22 0.53 0.36 0.15 2.73 0.58
1.2 monitor w/3 0.64 0.42 0.20 0.52 0.32 0.19 1.51 1.08
1.2 monitor w/6 0.61 0.32 0.17 0.50 0.31 0.19 1.11 0.78
1.2 skylight 0.66 0.44 0.24 0.57 0.39 0.19 2.72 0.57
1.3 monitor w/3 0.67 0.44 0.24 0.56 0.36 0.23 1.44 1.01
1.3 monitor w/6 0.64 0.36 0.21 0.54 0.35 0.23 1.08 0.79
1.3 skylight 0.69 0.46 0.27 0.61 0.42 0.23 2.72 0.56
1.4 monitor w/3 0.70 0.46 0.28 0.61 0.40 0.27 1.37 0.95
1.4 monitor w/6 0.68 0.40 0.25 0.59 0.39 0.27 1.06 0.80
1.4 skylight 0.73 0.49 0.30 0.65 0.46 0.27 2.72 0.56
1.5 monitor w/3 0.73 0.48 0.31 0.65 0.43 0.31 1.29 0.88
Table 14 Continued
1.5 skylight 0.76 0.51 0.32 0.69 0.49 0.31 2.72 0.55
1.6 monitor w/3 0.69 0.46 0.28 0.60 0.40 0.27 1.22 0.88
1.6 monitor w/6 0.67 0.41 0.24 0.59 0.40 0.27 0.97 0.80
1.6 skylight 0.74 0.51 0.30 0.65 0.47 0.27 2.71 0.54
1.7 monitor w/3 0.65 0.44 0.25 0.56 0.37 0.23 1.15 0.88
1.7 monitor w/6 0.64 0.39 0.21 0.55 0.38 0.23 0.92 0.81
1.7 skylight 0.72 0.51 0.28 0.61 0.45 0.23 2.71 0.54
1.8 monitor w/3 0.61 0.42 0.21 0.51 0.34 0.19 1.08 0.87
1.8 monitor w/6 0.60 0.37 0.17 0.51 0.35 0.19 0.86 0.81
1.8 skylight 0.69 0.50 0.26 0.56 0.42 0.19 2.70 0.53
1.9 monitor w/3 0.58 0.41 0.18 0.46 0.31 0.15 1.01 0.86
1.9 monitor w/6 0.57 0.35 0.13 0.47 0.32 0.15 0.80 0.82
1.9 skylight 0.66 0.49 0.23 0.51 0.39 0.15 2.69 0.52
2 monitor w/3 0.54 0.39 0.15 0.42 0.28 0.11 0.94 0.86
2 monitor w/6 0.53 0.33 0.09 0.43 0.29 0.11 0.74 0.83
2 skylight 0.63 0.49 0.21 0.47 0.36 0.11 2.68 0.52
4.1.2 Point-in-Time Metrics
4.1.3 On LEED Daylighting Credit
LEED v.4 Daylight Credit provides two options for earning the points. In option 1, buildings can earn 2-3 points (1-2 points in the Healthcare category) if at least 50% of the space meets sDA300, 50% and ASE1000, 250 should not exceed 10% of the space (Illuminating Engineering Society, 2012). There have been debates about the practical aspects of LEED v.4 requirements, since the threshold – 1000 lux for assessing glare (ASE) — is considered too low by some researchers (Hu, Place, & Malekafzali, 2014), and it is likely to result in a dim space if designers adhere to this requirement. There have been studies in the literature in which higher thresholds were used for assessing glare. For example, Useful Daylight Index (UDI) uses 2000 lux as the upper threshold for glare (New Buildings Institute, 2015). Continuous Daylight Autonomy uses 10 times the lower threshold as the glare threshold (New Buildings Institute, 2015). For example, if an office space requires 300 lux as the minimum light level, the upper threshold for glare assessment will be 3000 lux. To account for these recommendations, ASE3000, 250 has also been used as the threshold to calculate another set of ASE percentages in the present study. Table 13 and Table 14 highlight atria that meet LEED option 1 requirements. For instance, a central atrium with a Well Index of 0.1 and 0.2 using a monitor roof with glazing height equal to one sixth of its width gains 2 points (Appendix A).
Buildings can earn 1-2 points by using LEED Daylight Credit option 2 through point-in-time computer modeling. Option 2 provides 2 points when 75% of the space meets
at the equinox (for buildings in the categories of New Construction, Core and Shell, Schools, Retail, Data Centers, Warehouses & Distribution Centers, CI, Hospitality) (USGBC, 2013). Table 15 shows the percentage of space that meets LEED option 2 requirement using the point-in-time simulation. Highlighted rows indicate atrium cases that meet LEED option 2 requirements.
Table 15
Exploration of Atrium Buildings Based on WI Through Point-in-Time Illuminance Values
WI Roof point-in-time clsky@9
(300-3000 lux)
point-in-time clsky@9 (100-1000 lux) Central Atrium
0.1 monitor w/3 0.74 0.71
0.1 monitor w/6 0.5 0.97
0.1 skylight 0.74 0.69
0.2 monitor w/3 0.53 0.86
0.2 monitor w/6 0.36 0.85
0.2 skylight 0.56 0.75
0.3 monitor w/3 0.36 0.69
0.3 monitor w/6 0.11 0.58
0.3 skylight 0.58 0.76
0.4 monitor w/3 0.35 0.64
0.4 monitor w/6 0.08 0.36
0.4 skylight 0.58 0.78
0.5 monitor w/3 0.28 0.64
0.5 monitor w/6 0.22 0.53
0.5 skylight 0.42 0.69
0.75 monitor w/3 0.22 0.48
0.75 monitor w/6 0.11 0.35
0.75 skylight 0.33 0.59
1 monitor w/3 0.15 0.31
1 monitor w/6 0.01 0.17
1 skylight 0.25 0.49
1.25 monitor w/3 0.08 0.24
1.25 monitor w/6 0.01 0.14
1.25 skylight 0.21 0.38
1.5 monitor w/3 0 0.17
1.5 monitor w/6 0 0.11
1.5 skylight 0.17 0.26
1.75 monitor w/3 0 0.09
Table 15 Continued
1.75 skylight 0.1 0.17
2 monitor w/3 0 0
2 monitor w/6 0 0.04
2 Skylight 0 0.08
Attached Atrium
0.1 monitor w/3 0.97 0.57
0.1 monitor w/6 0.97 0.75
0.1 skylight 0.75 0.69
0.2 monitor w/3 0.73 0.71
0.2 monitor w/6 0.58 0.73
0.2 skylight 0.69 0.72
0.3 monitor w/3 0.49 0.85
0.3 monitor w/6 0.19 0.71
0.3 skylight 0.63 0.75
0.4 monitor w/3 0.71 0.69
0.4 monitor w/6 0.6 0.72
0.4 skylight 0.83 0.5
0.5 monitor w/3 0.61 0.69
0.5 monitor w/6 0.53 0.69
0.5 skylight 0.75 0.56
0.75 monitor w/3 0.58 0.76
0.75 monitor w/6 0.50 0.79
0.75 skylight 0.58 0.63
1 monitor w/3 0.55 0.83
1 monitor w/6 0.47 0.89
1 skylight 0.41 0.70
1.25 monitor w/3 0.57 0.77
1.25 monitor w/6 0.53 0.8
1.25 skylight 0.51 0.695
1.5 monitor w/3 0.6 0.71
1.5 monitor w/6 0.6 0.72
1.5 skylight 0.61 0.69
1.75 monitor w/3 0.58 0.76
1.75 monitor w/6 0.58 0.77
1.75 skylight 0.60 0.72
2 monitor w/3 0.56 0.81
2 monitor w/6 0.55 0.81
2 skylight 0.59 0.75
instance, MEEB indicates the relationship between the atrium depth and the daylight
regardless of the atrium type and its location (Stein, 2006). This research, however, provides preliminary data for daylight in atrium buildings, which are based on specific design
parameters, such as roof aperture design and atrium type.
4.2 Energy Assessment
The energy performance of a building is dependent upon the volume of the interior spaces. Because atria with the same Well Index can have different volumes, this project assesses energy performances of atria with the same Well Index in terms of per-cubic-feet of an atrium. Both annual cooling and heating per atrium volume are simulated by using
DesignBuilder, whereas peak heating and cooling loads are predicted by using hand
calculations. Table 13 and Table 14 show the annual cooling and heating per cubic foot of an atrium space, assuming the atrium has adiabatic walls. The results show that, for the same Well Index and roof aperture type, the cooling and heating loads per cubic foot of atrium space are also reasonably close. This finding makes the thermal load results applicable based on Well Index, regardless of the dimensions or height of the atrium building.
Peak cooling and heating calculation are based on the impact of the aperture type, and are measured for an atrium with one inch of width:
Atria with monitor roof w/3
Peak Heating = U (Btu/ ft2-hr-F) ×A (ft2) ×∆T (F) = ((0.44×w) + 2×(0.345×w/3)) × (68-16) / w×w/3 ft3= 0.01 kBtu/ft3-hr
Q window = U × A × CLTD window + A × SC × SHGF × CLF = (2×(0.345×w/3)×13) + (2×w/3)×(0.88×64.5×0.665) kBtu/ft3-hr
Atria with skylight
Peak Heating = U×A×∆T = (0.345×w) × (68-16) / w = 0.02 kBtu/ft3-hr Peak Cooling = Q roof + Q window + Q ventilation / w = 0.04 kBtu/ft3-hr
Q window = U × A × CLTD window + A × SC × SHGF × CLF = (w×0.345×13) + w×(0.88×268×0.67) kBtu/ft3-hr
Table 16 summarizes peak heating and cooling results.
Table 16
Peak Cooling and Heating Based on the Aperture Type in Atrium Buildings
Roof Type Peak Cooling (kBtu/ft3-hr) Peak Heating (kBtu/ft3-hr)
monitor w/3 0.04 0.01
monitor w/6 0.02 0.01
skylight 0.17 0.02
4.3 The Impact of Atrium Type
The secondary results are basically focused on the comparison of dynamic daylight metrics among different types of atria. Comparing dynamic daylight metrics between central and attached atrium types using different roof apertures demonstrates that the ASE3000, 250 remains the same in both central and attached atrium types, while for both the average and bottom floor sDA300, 50% are higher in attached atria.