MOLARITY MODEL OF MASS TRANSFER PROCESS FOR EXTRACTION IN ROTATING DISC CONTACTOR COLUMN
NURUL NADIYA BINTI ABU HASSAN
MOLARITY MODEL OF MASS TRANSFER PROCESS FOR EXTRACTION IN ROTATING DISC CONTACTOR COLUMN
NURUL NADIYA BINTI ABU HASSAN
A thesis submitted in fulfillment of the requirements for the award of the degree of
Master of Science (Mathematics)
Faculty of Science Universiti Teknologi Malaysia
iii
DEDICATION
TO:
Nurul Sabihah Kadir, Mastura Ab Wahid, Siti Noorhani Jehad, Nor Syaida Ibrahim, Noratiqah Mohd Ariff
Thank you for your encouragements and helps.
TO:
My beloved parent
Abu Hassan bin Ibrahim & Bedah bt Hj Reduan terbayang ketenangan yang selalu kau pamerkan,
bagaikan tiada keresahan,
walau hatimu sering terluka tika diriku terlanjur kata, tak pernah sekali kau tinggalkan diriku sendirian,
ketika ku dalam kedukaan, kau mendakap penuh pengertian,
di saat diriku kehampaan, kau setia mengajarku erti kekuatan,
terpancar kebanggan dalam senyumu melihat ku berjaya, bilaku kegagalan tak kau biarkan aku terus kecewa,
dengan kata azimat engkau nyalakan semangat, restu dan doa kau iringkan.
iv
ACKNOWLEDGEMENTS
I would like to thank PM Dr Jamalludin Talib for his supervision during the two years of my study and for his patience reading the draft of my thesis.
I also would like to thank Dr Normah Maan for her patience in going through of my thesis.
v
ABSTRACT
vi
ABSTRAK
vii
TABLE OF CONTENTS
CHAPTER TITLE PAGE
TITLE PAGE i
DECLARATION OF TESIS ii
DEDICATION iii
ACKNOWLEDGEMENT iv
ABSTRACT v
ABSTRAK vi
TABLE OF CONTENTS vii
LIST OF TABLES x
LIST OF FIGURES xi
LIST OF SYMBOLS xiii
LIST OF APPENDICES xv
1 INTRODUCTION 1
1.1 Introduction 1
1.2 Problem Statement 2
1.3 Objectives of the Research 3
1.4 Scope of Study 3
1.5 Significant of Study 6
1.6 Thesis Organization 6
1.7 Summary 8
2 LITERATURE REVIEW 9
viii
2.2 Liquid-liquid Extraction Equipment 2.2.1 Mixer Settlers
2.2.2 Column Extractor
2.2.3 Rotating Disc Contactor Column
10 10 11 11
2.3 Hydrodynamics
2.3.1 Terminal Velocity 2.3.2 Characteristic Velocity
14 14 15 2.4 Drop Breakage Model
2.4.1 Drop Size
2.4.2 Observation of the Breakage Process 2.4.3 Grouping Drops into Cells.
2.4.4 Average Drop Diameter
16 17 17 18 18
2.5 Drop Size Distribution 20
2.6 Mass Transfer Process
2.6.1 Whitman Two-Film Theory
21 22 2.7 Recent Work on Mass Transfer Model. 24
2.8 Summary 26
3 MASS TRANSFER MODEL 28
3.1 Introduction 28
3.2 Diffusion in Sphere. 29
3.3 Mass Transfer Model
3.3.1 Boundary Approach of Mass Transfer Model
3.3.2 Simultaneous Discrete Mass Transfer Model
35
36
37
3.4 Conclusion 38
ix
4 MOLARITY MODEL OF MASS TRANSFER 40
4.1 Introduction 40
4.2 Molarity 40
4.3 Molarity Model of Mass Transfer. 4.3.1 MM-MT in Stage 1 4.3.2 Mass Transfer in Stage 2 4.3.3 Mass Transfer in Stage 3
42 45 47 49 4.4 Sequence Steps of Molarity Model of Mass Transfer 51
4.5 Summary 53
5 SIMULATION AND DATA ANALYSIS 55
5.1 Introduction 55
5.2 Test run for the Program 55
5.3 The Molarity Model of Mass Transfer, MM-MT
Program 58
5.4 Concentration of Drops and Continuous Phase in
Equilibrium 59
5.4.1 Comparison Method 59
5.4.2 Conclusion 67
5.5 Comparison between the MM-MT, S-DMT model
and Experimental (SPS) Data 68
5.5.1 Conclusion 70
5.6 Summary 72
6 CONCLUSION AND RECOMENDATION 73
6.1 Conclusion 73
6.2 Recommendations 74
REFERENCES 75
x
LIST OF TABLES
TABLE NO TITLE PAGE
2.1 Terminal and characteristic velocity of drops. 16 2.2 Range of drops diameter and the average drops diameter. 20 2.3 Volume fraction of drops in each cell obtained by EVM. 21 2.4 Mathematical model of mass transfer process developed
by previous researchers. 24
4.1 Sequence steps of MM-MT. 52
5.1 Concentration of drops for the test run program. 56 5.2 Concentration of continuous phase for the test program. 56 5.3 Error obtained from the simulation data of the test run 56 5.4 Result from iteration 1 and iteration 10 for both
concentrations of drops and continuous phase 59 5.5 Error obtained in both concentration of drops and
continuous phase 62
5.6 Relative error for concentration of drops from iteration
500, 1000 and 1000. 66
5.7 (a) Data obtained from Molarity Model of Mass Transfer,
MM-MT 67
5.7(b) Data from SPS cited by Talib [4]. 68
5.7(c) Data obtained by Simultaneous Discrete Mass Transfer,
S-DMT model by Mohamed [6]. 68
5.8 Summarization of relative error for concentration of drops and continuous phase obtained in MM-MT, S-DMT and
xi
LIST OF FIGURES
FIGURE NO TITLE PAGE
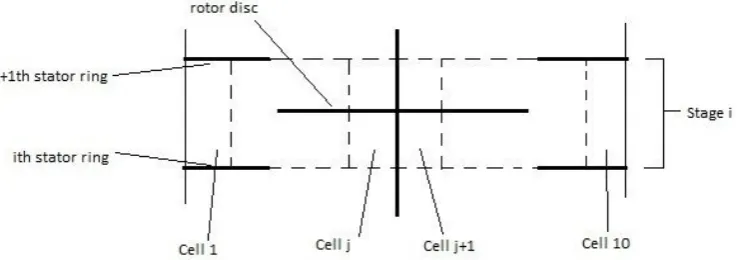
1.1 The illustration for stage The illustration for stage located between 2 stator rings next to each other. 4 1.2 Illustration of stage being divided into cell with the
same width. 4
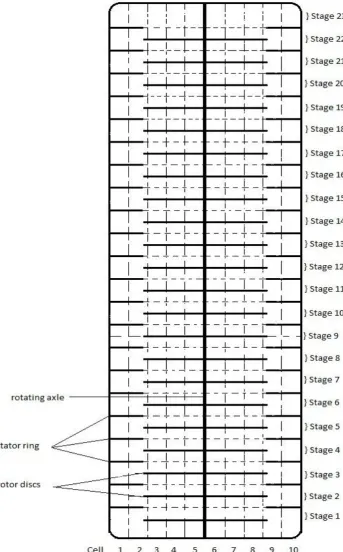
1.3 The RDC column that was modeled into 23 stages and
10 cells in each stage. 5
2.1 Schematic diagram of the Rotating Disc Contactor
Column (RDC) column. 12
2.2 Mass transfer process for X phase and Y phase. 23 4.1 Flow chart of the algorithm given in Table 4.1. 53 5.1 Illustration for drops in a stage for test run model. 55 5.2 Comparison graph for concentration of drops and
continuous phase that being obtained from iteration 1
and iteration 10. 61
5.3 Comparison graph for concentration of drops and continuous phase that being obtained from iteration 10
and iteration 50 63
5.4 Comparison graph for concentration of drops and continuous phase that being obtained from iteration 50
and iteration 100 64
5.5 Comparison graph for concentration of drops and continuous phase that being obtained from iteration 100
xii
xiii
LIST OF SYMBOLS
- Radius of a sphere
- Concentration of a sphere
, - Concentration for both and phases
- Diameter of sphere
- Initial drop diameter of drop - Average diameter of drop
- Molecular diffusivity of dispersed phase - Diameter of rotor disc
- Diameter of stator ring
- Gravity
ℎ - Height of a stage - Number of stages - Number of cells
, - Flux or the rate of the mass transfer for both and phases
, - Mass transfer coefficient for both and phases
- Radius of the column
- Cell number
- Stage number
, - Number of drops
- Number of particle of drops
- Balance number of mole for the continuous phase
- Number of mole
xiv
! - Radius of sphere
" - Time of drop to travel along the column # - Average concentration of sphere
# - Total concentration of drops
$% - Characteristic velocity of drop
$& - Terminal velocity of drop
' - Volume of drops
' - Average volume of drop
'( - Volume fraction
' - Volume of continuous phase in a stage
)*, ) - Bulk and interface concentration of phase
)+, -+ - Initial concentration of continuous and dispersed phase
, - Liquid phases
- Balance concentration of continuous phase
-*, - - Bulk and interface concentration of phase
. - Stator ring number
Greek Symbols
∆0 - Density difference between the continuous phase and the
dispersed phase
1 - Interfacial tension
2% - The viscosity of the continuous phase
0% - Continuous phase density
34 - Critical angular velocity
xv
LIST OF APPENDICES
APPENDIX TITLE PAGE
A Geometrical And Physical Properties Of RDC
Column 79
B Simulation Data For MM-MT 80
C Computer Program For Molarity Model Of Mass
CHAPTER 1
INTRODUCTION
1.1 Introductions
Liquid-liquid extraction has become a common subject to be discussed not just among chemical engineers, but mathematicians as well. Liquid-liquid extraction is a process with many applications in pharmaceuticals, petrochemicals processing, industrial chemical production and metals extraction and recovery [1]. This process is a technique to separate two liquids product. The principle of liquid-liquid extraction process entails the transfer of one elements of a solution to another liquid phase which is relatively immiscible in the first solution [2].
There are many types of equipments used for the processes of liquid-liquid extraction. The one that will be considered in this research is the column extractor type called Rotating Disc Contactor (RDC) column. In the RDC column, there are two phases that were involved in extraction process which called the dispersed phase (drops) and the continuous phase. Mathematical model on the mass transfer process that occurred in RDC column were already completed by previous researchers. However, there are still some weaknesses on the latest mass transfer model that can be improved.
2
concentrations on the chemical substances. Molarity will be embedded in the former model in order to reform it. Then, the suitable algorithm is determined so that the solutions of the improved model can be achieved.
1.2 Problem Statement
Quite a lot of models on RDC column have been developed. The modeling in drops distributions and mass transfer process are the most important factors for the column performance [3]. Therefore, a more realistic mathematical model is presented.
There are a number of researchers in this field such as Ghalehchian [3], Talib [4], Arshad [5], Mohamed [6] and Maan[3]. Talib [4] has presented the mass transfer models which are Initial Approach of Mass Transfer (IAMT) and Boundary Approach of Mass Transfer (BAMT). These two models were said unsteady-state model. According to Maan [3], Ghalehchian has developed a new model by applying the idea of axial mixing into the simulation of the mass transfer process. Arshad [5] also has developed a steady state model for hydrodynamics process. Then, Mohamed [6] has modified a model developed by Talib which is the BAMT model which is called Simultaneous Discrete Mass Transfer (S-DMT) model. Meanwhile Maan [3] has developed an inverse model of mass transfer where it can determine the value of the input while the value of output is known.
3
concentration for both dispersed and continuous phases obtained in this research will be compared with the SSPS data as cited in Talib [4].
1.3 Objective of the Research
The main goals of the research are to model a mass transfer process by using molarity that happen in the RDC column and compare the data obtained from this model with the experimental data obtained in SSPS as cited in Talib [4]. To achieve these goals, the following objectives are the working strategies. The objectives of the study are:
1. To formulate a new model for the mass transfer process for drops and continuous phase in the RDC column.
2. To incorporate the new mass transfer model in the existing algorithm.
3. To develop a programming to simulate the concentration of drops and continuous phase in the new mass transfer model.
1.4 Scope of Study
4
Figure 1.1 : The illustration for stage located between 2 stator rings next to each other.
Then, each stage is also modeled into 10 cells with the same width. The cell is labeled as where = 1,2, … ,10. Each cell is said to have its own range of drops diameter where this range will be explain further in Chapter 2. The cells can be illustrated as in Figure 1.2. Figure 1.3 shows an RDC column being modeled into 23 stages and 10 cells in every stage.
Figure 1.2 : Illustration of stage being divided into cell with the same width.
5
6
Next, the hydrodynamics of drops, the drops distribution, the range of drops diameter and average of drops diameter that are used in order to achieve the objectives above has been obtained by Talib [4]. The hydrodynamic of drops is used to determine the time taken for drops to travel along the column. The drops distribution is used to calculate the number of drops in every cell in every stage. All these data are used to determine the concentration of dispersed and continuous phases. These data are used in simulating the mass transfer process by using C++ 6.0 software.
1.5 Significant of Study
The purpose of this study is to determine the concentration of dispersed and continuous phases in the RDC column. From the concentrations obtained, the efficiency of the column can be observed. The efficiency of the RDC column will increase if the extraction process that occurs in the column increases. In order to increase the extraction process, improvements can be made to the RDC column such as reducing the speed of the rotor discs in the column so that the drops will break into smaller. This will increase the surface area that was brought into contact with the continuous phase.
These concentrations also help in designing the RDC column by varying the geometric properties of the column. For example, by increase or decrease the radius of the column, the height of the column and etc depends on the extraction process happen, an efficient RDC column will be produce.
1.6 Thesis Organization
7
the hydrodynamics of mass transfer process that occurs in the RDC column. Discussion on the hydrodynamic, drop breakage, drop distribution and mass transfer process are also included. The existing models developed by previous researchers are presented.
Chapter 3 reviews on the existing mass transfer models. It discussed on the formulation of the varied boundary function. The details of the exact solution of the Initial Boundary Value Problem (IBVP) with the time depending function boundary condition will be shown and followed by the derivation of a new diffusion equation for sphere.
Chapter 4 discusses the formulation of the mass transfer process in the RDC column by using molarity. The new mass transfer process using molarity is presented. Molarity is a method that will be used to determine the concentration of both drops and continuous phase in the mass transfer process that occurs in the RDC column. Molarity will be embedded in the existing mass transfer model and this process will be explained further in this chapter.
Chapter 5 provided the explanation on the computer program that was build and the simulation data that were obtained from this simulation. The computer program was developed by using C programming. This simulation is then being run until 10000 iterations and the data obtained from this simulation will be compared with the SSPS data as cited in Talib [4]. The concentration error obtained from this comparison is then being compared with the concentration error obtained from the comparison S-DMT model and SSPS data.
8
1.7 Summary