ABSTRACT
BUNN, WILLIAM GREG. CFRP Grid/Rigid Foam Shear Transfer Mechanism for Precast, Prestressed Concrete Sandwich Wall Panels. (Under the direction of Sami H. Rizkalla, Ph.D.)
Prestressed precast concrete sandwich wall panels have been effectively used for decades to provide the building envelope for a wide variety of structures. Panels provide a host of functions, including providing the building envelope, architectural features, carrying gravity and wind loads, as well as insulating the entire structure. Typical concrete sandwich panels consist of two discrete layers of concrete, called wythes, one on either side of an inner layer of rigid foam insulation. The ability to transfer the shear forces between the two separated concrete wythes, across the insulating layer, is essential in attaining composite action and producing structurally efficient panels. Traditionally, a wide variety of steel connectors or solid concrete zones have been used to accomplish this transfer of shear forces. These methods, though shown to function well structurally, create thermal bridges across the insulating layer and severely hinder the insulating value of the entire building, consequently increasing the heating and cooling costs for the structure.
CFRP Grid/Rigid Foam Shear Transfer Mechanism for Precast, Prestressed Concrete Sandwich Wall Panels
by
William Greg Bunn
A thesis submitted to the Graduate Faculty of North Carolina State University
in partial fulfillment of the requirements for the Degree of
Master of Science
Civil Engineering
Raleigh, North Carolina 2011
APPROVED BY:
______________________________ Rudolf Seracino, Ph.D.
______________________________ James M. Nau, Ph.D.
_______________________________ Sami H. Rizkalla, Ph.D.
DEDICATION
I dedicate this thesis to my loving and devoted wife Kellie Ann Bunn. Thank you for your unwavering encouragement, love, inspiration, and patience that made this accomplishment possible.
I would also like to dedicate this thesis to my parents, Susan and Earl “The Pearl” Bunn, thank you for your love, support, strength, and countless sacrifices raising me into the person I am today.
BIOGRAPHY
ACKNOWLEDGMENTS
I would like to express my greatest appreciation to my graduate advisor Dr. Sami Rizkalla for his time, expertise, guidance, and encouragement during this effort. Also, I extend my gratitude to Dr. James Nau and Dr. Rudi Seracino for their continual input and contribution to my education and thesis. To Dr. James Joyce, at East Carolina University, for helping me through the process of finishing my degree requirements after leaving early to pursue my baseball dream, thank you.
I would like to thank lab manager, Greg Lucier, for his help with my constant stream of report revisions and technical questions. To Jonathan McEntire and Jerry Atkinson, thank you for everything that you did to make life in the lab as smooth as possible. Thanks also to Denise Thoesen for help with everyday office issues, purchase orders, and keeping everything running seamlessly.
I would also like to thank Steve Brock of Gate Precast Company and Harry Gleich of Metromont Corporation for producing all of the test specimens, as well as AltusGroup Inc. for funding the research project to investigate carbon grid as a shear transfer mechanism.
I would like to extend a special thank you to Jonathan Soriano, Jake Griffin, and Nicole Lepore, who helped with the endless preparation, set-up, and testing of the panels. To all the other CFL students and friends, thank you for all the small things that go unnoticed in such an endeavor, such as friendship, relaxing, joking, lunches, and downtime.
TABLE OF CONTENTS
LIST OF TABLES ... ix
LIST OF FIGURES ... xi
INTRODUCTION ...1 1
Background ...1 1.1.
Research Objective ...6 1.2.
Scope ...8 1.3.
LITERATURE REVIEW ...9 2
History ...10 2.1.
Composite Action ...15 2.2.
Thermal Efficiency ...24 2.3.
FRP Shear Transfer Mechanism ...28 2.4.
Design Methods ...35 2.5.
Principles of Mechanics ... 37 2.5.1.
ACI Simplified Method ... 38 2.5.2.
PCI Method ... 39 2.5.3.
EXPERIMENTAL PROGRAM ...41 3
Panel Configurations ...42 3.1.
Vertical Grid Panels ... 42 3.1.1.
Debonded Panels ... 45 3.1.2.
Transverse Grid Panels ... 47 3.1.3.
Gap Panels ... 48 3.1.4.
No Grid Panels ... 50 3.1.5.
Long Term Behavior Panels ... 52 3.1.6.
Construction of Wall Panels ...54 3.2.
Material Properties ...56 3.3.
Push Test Setup ...57 3.4.
Long Term Behavior Test Setup ...59 3.5.
Instrumentation ...60 3.6.
Potentiometer Locations ... 60 3.6.1.
TEST RESULTS...62 4
Type of Rigid Foam Insulation ...62 4.1.
Conclusions Relevant to the Type of Rigid Foam Insulation and Spacing between the Grids: ... 69 4.1.1.
Thickness of Rigid Foam Insulation ...69 4.2.
Conclusions Relevant to Thickness of the Rigid Foam: ... 75 4.2.1.
Spacing between Carbon Grid Lines ...76 4.3.
Conclusions Relevant to the Spacing between the Rows of Grid: ... 80 4.3.1.
Bonded versus Debonded Rigid Foam Insulation ...81 4.4.
Shear Strength of Carbon Grid Perpendicular to the Applied Load ...85 4.5.
Presence of Gaps along the Carbon Grid Line ...87 4.6.
Failure Modes ...93 4.8.
Long Term Behavior...98 4.9.
ANALYSIS AND DISCUSSION ...100 5
Proposed Design Equation...100 5.1.
Evaluation of the Gamma Factors ...102 5.2.
Design Equation versus Experimental Data Values ...103 5.3.
Design Example for a Sandwich Panel ...109 5.4.
Discussion ...114 5.5.
SUMMARY AND CONSLUSIONS ...115 6 Recommendations...116 6.1. REFERENCES ...118 7 APPENDICES ...123 8
APPENDIX A: Vertical Grid Results ...124 9
Specimen 24.EPS.12.2.A ...124 9.1.
Specimen 24.EPS.12.2.B ...125 9.2.
Specimen 24.EPS.12.4.A ...126 9.3.
Specimen 24.EPS.12.4.B ...127 9.4.
Specimen 24.EPS.12.6.A ...128 9.5.
Specimen 24.EPS.12.6.B ...129 9.6.
Specimen 36.EPS.18.2.A ...130 9.7.
Specimen 36.EPS.18.2.B ...131 9.8.
Specimen 36.EPS.18.4.A ...132 9.9.
Specimen 36.EPS.18.4.B ...133 9.10.
Specimen 36.EPS.18.6.A ...134 9.11.
Specimen 36.EPS.18.6.B ...135 9.12.
Specimen 48.EPS.24.2.A ...136 9.13.
Specimen 48.EPS.24.2.B ...137 9.14.
Specimen 48.EPS.24.4.A ...138 9.15.
Specimen 48.EPS.24.4.B ...139 9.16.
Specimen 48.EPS.24.6.A ...140 9.17.
Specimen 48.EPS.24.6.B ...141 9.18.
Specimen 48.EPS.24.8.A ...142 9.19.
Specimen 48.EPS.24.8.B ...143 9.20.
Specimen 72.EPS.36.2.A ...144 9.21.
Specimen 72.EPS.36.2.B ...145 9.22.
Specimen 72.EPS.36.4.A ...146 9.23.
Specimen 72.EPS.36.4.B ...147 9.24.
Specimen 72.EPS.36.6.A ...148 9.25.
Specimen 72.EPS.36.6.B ...149 9.26.
Specimen 24.XPS.12.2.A ...150 9.27.
Specimen 24.XPS.12.4.A ...152 9.29.
Specimen 24.XPS.12.4.B ...153 9.30.
Specimen 36.XPS.18.2.A ...154 9.31.
Specimen 36.XPS.18.2.B ...155 9.32.
Specimen 36.XPS.18.4.A ...156 9.33.
Specimen 36.XPS.18.4.B ...157 9.34.
Specimen 48.XPS.24.2.A ...158 9.35.
Specimen 48.XPS.24.2.B ...159 9.36.
Specimen 48.XPS.24.4.A ...160 9.37.
Specimen 48.XPS.24.4.B ...161 9.38.
Specimen 72.XPS.36.2.A ...162 9.39.
Specimen 72.XPS.36.2.B ...163 9.40.
Specimen 72.XPS.36.4.A ...164 9.41.
Specimen 72.XPS.36.4.B ...165 9.42.
APPENDIX B: De-Bonded Panel Results ...166 10
Specimen 48.EPS.24.2.DEBOND.A ...166 10.1.
Specimen 48.EPS.24.2.DEBOND.B ...167 10.2.
Specimen 48.EPS.24.4.DEBOND.A ...168 10.3.
Specimen 48.EPS.24.4.DEBOND.B ...169 10.4.
Specimen 48.XPS.24.2.DEBOND.A ...170 10.5.
Specimen 48.XPS.24.2.DEBOND.B ...171 10.6.
Specimen 48.XPS.24.4.DEBOND.A ...172 10.7.
Specimen 48.XPS.24.4.DEBOND.B ...173 10.8.
APPENDIX C: Transverse Grid Panel Results ...174 11
Specimen 48.EPS.36.2.TRANS.A ...174 11.1.
Specimen 48.EPS.36.2.TRANS.B ...175 11.2.
Specimen 48.XPS.36.2.TRANS.A ...176 11.3.
Specimen 48.XPS.36.2.TRANS.B ...177 11.4.
APPENDIX D: Gap Panel Results ...178 12
Specimen 36.EPS.18.2.GAP.A ...178 12.1.
Specimen 36.EPS.18.2.GAP.B ...179 12.2.
Specimen 36.EPS.18.4.GAP.A ...180 12.3.
Specimen 36.EPS.18.4.GAP.B ...181 12.4.
Specimen 36.XPS.18.2.GAP.A ...182 12.5.
Specimen 36.XPS.18.2.GAP.B ...183 12.6.
Specimen 36.XPS.18.4.GAP.A ...184 12.7.
Specimen 36.XPS.18.4.GAP.B ...185 12.8.
LIST OF TABLES
Table 3-1 : Tested Vertical Grid Panels ... 43
Table 3-2 : Tests of Debonded Panels ... 45
Table 3-3 : Tests of Transverse Grid Panels ... 47
Table 3-4 : Tests of Gap Panels ... 48
Table 3-5 : Tests of No Grid Panels ... 50
Table 3-6 : Specimens for Long Term Behavior Testing ... 52
Table 3-7 : Material Properties for Rigid Foam Insulation ... 56
Table 3-8 : Material Properties for C50 - 1.8 x 1.6 CFRP Grid ... 56
Table 5-1 : Gamma Factors for EPS Insulation ... 103
Table 5-2 : Gamma Factors for XPS Insulation... 103
Table 5-3 : Shear Design Example Panel Parameters ... 113
Table 9-1 : Summary of Results for 24.EPS.12.2.A ... 124
Table 9-2 : Summary of Results for 24.EPS.12.2.B ... 125
Table 9-3 : Summary of Results for 24.EPS.12.4.A ... 126
Table 9-4 : Summary of Results for 24.EPS.12.4.B ... 127
Table 9-5 : Summary of Results for 24.EPS.12.6.A ... 128
Table 9-6 : Summary of Results for 24.EPS.12.6.B ... 129
Table 9-7 : Summary of Results for 36.EPS.18.2.A ... 130
Table 9-8 : Summary of Results for 36.EPS.18.2.B ... 131
Table 9-9 : Summary of Results for 36.EPS.18.4.A ... 132
Table 9-10 : Summary of Results for 36.EPS.18.4.B ... 133
Table 9-11 : Summary of Results for 36.EPS.18.6.A ... 134
Table 9-12 : Summary of Results for 36.EPS.18.6.B ... 135
Table 9-13 : Summary of Results for 48.EPS.24.2.A ... 136
Table 9-14 : Summary of Results for 48.EPS.24.2.B ... 137
Table 9-15 : Summary of Results for 48.EPS.24.4.A ... 138
Table 9-16 : Summary of Results for 48.EPS.24.4.B ... 139
Table 9-17 : Summary of Results for 48.EPS.24.6.A ... 140
Table 9-18 : Summary of Results for 48.EPS.24.6.B ... 141
Table 9-19 : Summary of Results for 48.EPS.24.8.A ... 142
Table 9-20 : Summary of Results for 48.EPS.24.8.B ... 143
Table 9-21 : Summary of Results for 72.EPS.36.2.A ... 144
Table 9-22 : Summary of Results for 72.EPS.36.2.B ... 145
Table 9-23 : Summary of Results for 72.EPS.36.4.A ... 146
Table 9-24 : Summary of Results for 72.EPS.36.4.B ... 147
Table 9-25 : Summary of Results for 72.EPS.36.6.A ... 148
Table 9-26 : Summary of Results for 72.EPS.36.6.B ... 149
Table 9-27 : Summary of Results for 24.XPS.12.2.A ... 150
Table 9-28 : Summary of Results for 24.XPS.12.2.B ... 151
Table 9-30 : Summary of Results for 24.XPS.12.4.B ... 153
Table 9-31 : Summary of Results for 36.XPS.18.2.A ... 154
Table 9-32 : Summary of Results for 36.XPS.18.2.B ... 155
Table 9-33 : Summary of Results for 36.XPS.18.4.A ... 156
Table 9-34 : Summary of Results for 36.XPS.18.4.B ... 157
Table 9-35 : Summary of Results for 48.XPS.24.2.A ... 158
Table 9-36 : Summary of Results for 48.XPS.24.2.B ... 159
Table 9-37 : Summary of Results for 48.XPS.24.4.A ... 160
Table 9-38 : Summary of Results for 48.XPS.24.4.B ... 161
Table 9-39 : Summary of Results for 72.XPS.36.2.A ... 162
Table 9-40 : Summary of Results for 72.XPS.36.2.B ... 163
Table 9-41 : Summary of Results for 72.XPS.36.4.A ... 164
Table 9-42 : Summary of Results for 72.XPS.36.4.B ... 165
Table 10-1 : Summary of Results for 48.EPS.24.2.DEBOND.A ... 166
Table 10-2 : Summary of Results for 48.EPS.24.2.DEBOND.B ... 167
Table 10-3 : Summary of Results for 48.EPS.24.4.DEBOND.A ... 168
Table 10-4 : Summary of Results for 48.EPS.24.4.DEBOND.B ... 169
Table 10-5 : Summary of Results for 48.XPS.24.2.DEBOND.A ... 170
Table 10-6 : Summary of Results for 48.XPS.24.2.DEBOND.B ... 171
Table 10-7 : Summary of Results for 48.XPS.24.4.DEBOND.A ... 172
Table 10-8 : Summary of Results for 48.XPS.24.4.DEBOND.B ... 173
Table 11-1 : Summary of Results for 48.EPS.36.2.TRANS.A ... 174
Table 11-2 : Summary of Results for 48.EPS.36.2.TRANS.B ... 175
Table 11-3 : Summary of Results for 48.XPS.36.2.TRANS.A ... 176
Table 11-4 : Summary of Results for 48.XPS.36.2.TRANS.B ... 177
Table 12-1 : Summary of Results for 36.EPS.18.2.GAP.A ... 178
Table 12-2 : Summary of Results for 36.EPS.18.2.GAP.B ... 179
Table 12-3 : Summary of Results for 36.EPS.18.4.GAP.A ... 180
Table 12-4 : Summary of Results for 36.EPS.18.4.GAP.B ... 181
Table 12-5 : Summary of Results for 36.XPS.18.2.GAP.A ... 182
Table 12-6 : Summary of Results for 36.XPS.18.2.GAP.B ... 183
Table 12-7 : Summary of Results for 36.XPS.18.4.GAP.A ... 184
Table 12-8 : Summary of Results for 36.XPS.18.4.GAP.B ... 185
Table 13-1 : Summary of Results for 48.EPS.NONE.2.A ... 186
Table 13-2 : Summary of Results for 48.EPS.NONE.2.B ... 187
Table 13-3 : Summary of Results for 48.XPS.NONE.2.A ... 188
Table 13-4 : Summary of Results for 48.XPS.NONE.2.B... 189
LIST OF FIGURES
Figure 1-1 : Example of an Architectural Sandwich Panel ... 2
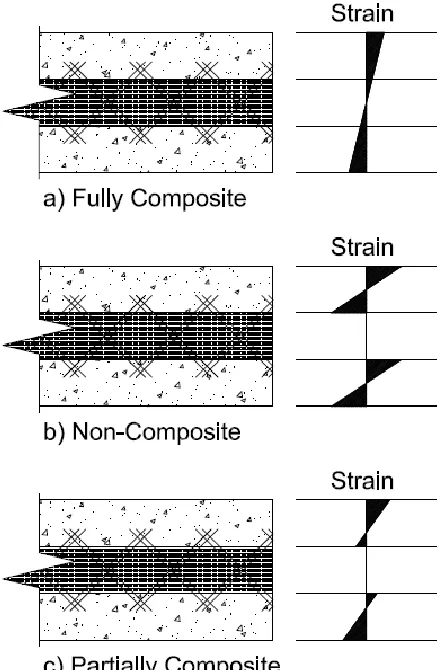
Figure 1-2 : Strain Profiles for Various Degrees of Composite Action ... 5
Figure 1-3 : Double Shear ... 7
Figure 2-1 : Early Example of Tilt-up "Sandwich" Construction ... 10
Figure 2-2 : Examples of Shear Ties given by Collins ... 11
Figure 2-3 : Early Precast Concrete Wall System ... 13
Figure 2-4 : Various Types of Architectural Loadbearing Wall Panels ... 16
Figure 2-5 : Examples of Non-composite Connectors (PCI Journal, Spring 2011) ... 17
Figure 2-6 : One-way Shear Connectors (PCI Journal, Spring 2011) ... 18
Figure 2-7 : Depiction of Non-Composite vs. Composite Action ... 19
Figure 2-8 : Percent Composite Action Results ... 21
Figure 2-9 : Load Deflection at Mid-Span for Panel P11 ... 23
Figure 2-10 : Thermal Mass Effects on Heating and Cooling Loads ... 24
Figure 2-11 : Thermal Resistance vs. Concrete Area for Panels with 0.05% Connectors ... 26
Figure 2-12 : Thermal Resistance vs. Connector Area for Panels with only Connectors ... 26
Figure 2-13 : One Variation of a Three-wythe Sandwich Panel ... 27
Figure 2-14 : FRP Bent Bar Shear Connector ... 29
Figure 2-15 : Photo of GFRP Shell with Reinforcement and Foam Installed ... 30
Figure 2-16 : Cross Section of Wall Panel using GFRP Shell Shear Mechanism ... 31
Figure 2-17 : CFRP Grid used as Shear Transfer Mechanism... 31
Figure 2-18 : Cross Section Views of Panels with CFRP Shear Grid ... 32
Figure 2-19 : Shear Evaluation Method 1 ... 37
Figure 2-20 : Shear Evaluation Method 2 ... 38
Figure 3-1 : Cut Away of Typical Vertical Grid Push Test Specimen ... 41
Figure 3-2 : Typ. 2” Insulation Specimen Section View ... 44
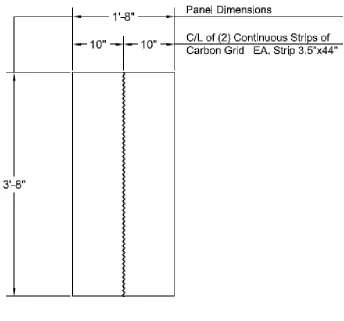
Figure 3-3 : Specimen Elevation of Typical Vertical Grid Panels ... 44
Figure 3-4 : Debonded 4" Insulation Specimen Section View ... 45
Figure 3-5 : Specimen Elevation of Typical Debonded Panels ... 46
Figure 3-6 : Insulation for Debonded Specimens with Plastic Layers Prior to Casting ... 46
Figure 3-7 : Specimen Elevation and Section View of Typical Transverse Grid Panels ... 47
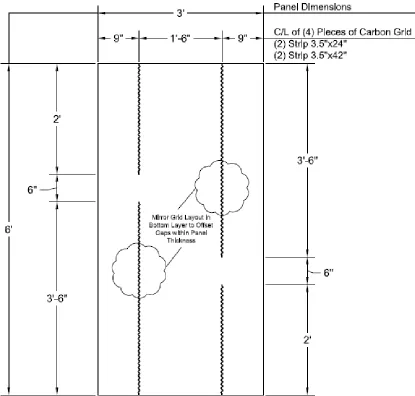
Figure 3-8 : Specimen Elevation Typical Gap - Vertical Grid Panels ... 49
Figure 3-9 : Gap Panel during Construction ... 49
Figure 3-10 : Specimen Elevation Typical No Grid Panels ... 51
Figure 3-11 : 2" Insulation Specimen Section View ... 51
Figure 3-12 : Typical Long Term Behavior Specimen Elevation ... 53
Figure 3-13 : Long Term Behavior Specimen Section View ... 53
Figure 3-14 : Photos Illustrating Steps 1, 2, & 3 ... 55
Figure 3-15 : Photos Illustrating Construction Steps 4 & 9 ... 55
Figure 3-16 : Photo Illustrating Construction Step 10 ... 55
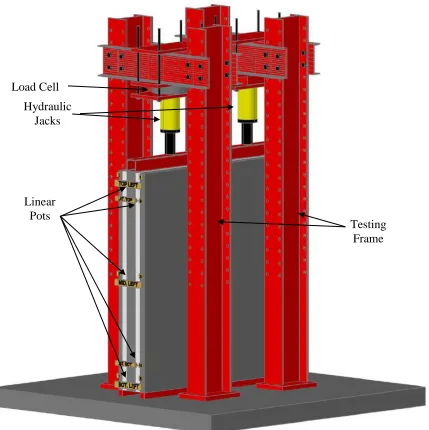
Figure 3-18 : Long Term Behavior Test Setup ... 59
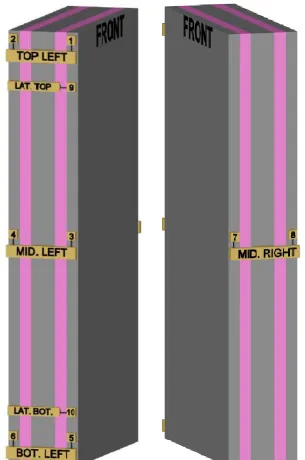
Figure 3-19 : Locations of Linear Pots #1-10 for All Tests ... 61
Figure 4-1 : Effect of Insulation Type (2”) - Load Deflection for 2' Panels ... 63
Figure 4-2 : Effect of Insulation Type (2”) - Load Deflection for 3' Panels ... 64
Figure 4-3 : Effect of Insulation Type (2”) - Load Deflection for 4' Panels ... 64
Figure 4-4 : Effect of Insulation Type (2”) - Load Deflection for 6' Panels ... 65
Figure 4-5 : Effect of Insulation Type (4”) - Load Deflection for 2' Panels ... 65
Figure 4-6 : Effect of Insulation Type (4”) - Load Deflection for 3' Panels ... 66
Figure 4-7 : Effect of Insulation Type (4”) - Load Deflection for 4' Panels ... 66
Figure 4-8 : Effect of Insulation Type (4”) - Load Deflection for 6' Panels ... 67
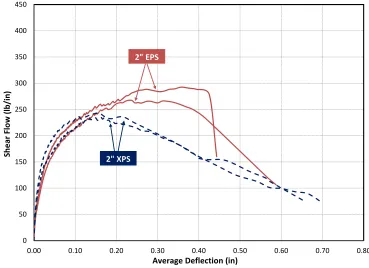
Figure 4-9 : Effect of Insulation Type (2”) - Shear Flow ... 68
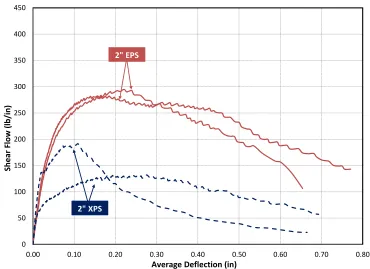
Figure 4-10 : Effect of Insulation Type (4”) - Shear Flow ... 68
Figure 4-11 : Effect of Insulation Thickness (EPS) - Load Deflection for 2' Panels... 70
Figure 4-12 : Effect of Insulation Thickness (EPS) - Load Deflection for 3' Panels... 70
Figure 4-13 : Effect of Insulation Thickness (EPS) - Load Deflection for 4' Panels... 71
Figure 4-14 : Effect of Insulation Thickness (EPS) - Load Deflection for 6’ Panels ... 71
Figure 4-15 : Effect of Insulation Thickness (XPS) - Load Deflection for 2' Panels ... 72
Figure 4-16 : Effect of Insulation Thickness (XPS) - Load Deflection for 3' Panels ... 72
Figure 4-17 : Effect of Insulation Thickness (XPS) - Load Deflection for 4' Panels ... 73
Figure 4-18 : Effect of Insulation Thickness (XPS) - Load Deflection for 6' Panels ... 73
Figure 4-19 : Effect of Foam Thickness - Shear Flow for EPS Rigid Foam Insulation ... 74
Figure 4-20 : Effect of Foam Thickness - Shear Flow for XPS Rigid Foam Insulation ... 75
Figure 4-21 : Effect of Grid Spacing - Load Deflection for Panels with 2” EPS Insulation .. 76
Figure 4-22 : Effect of Grid Spacing - Load Deflection for Panels with 4” EPS Insulation .. 77
Figure 4-23 : Effect of Grid Spacing - Load Deflection for Panels with 6” EPS Insulation .. 77
Figure 4-24 : Effect of Grid Spacing - Load Deflection for Panels with 2” XPS Insulation .. 78
Figure 4-25 : Effect of Grid Spacing - Load Deflection for Panels with 4” XPS Insulation .. 78
Figure 4-26 : Effect of Grid Spacing - Shear Flow for EPS Rigid Foam Insulation ... 79
Figure 4-27 : Effect of Grid Spacing - Shear Flow for XPS Rigid Foam Insulation ... 80
Figure 4-28 : Load Deflection for Panels with 2” EPS Insulation – Bonded vs. Debonded .. 81
Figure 4-29 : Load Deflection for Panels with 4” EPS Insulation – Bonded vs. Debonded .. 82
Figure 4-30 : Load Deflection for Panels with 2” XPS Insulation – Bonded vs. Debonded .. 82
Figure 4-31 : Load Deflection for Panels with 4” XPS Insulation – Bonded vs. Debonded .. 83
Figure 4-32 : Shear Flow for EPS Rigid Foam Insulation – Bonded vs. Debonded ... 84
Figure 4-33 : Shear Flow for XPS Rigid Foam Insulation – Bonded vs. Debonded ... 84
Figure 4-34 : Load Deflection for Panels with 2” Insulation – Effect of Transverse Grid ... 85
Figure 4-35 : Shear Flow for Transverse (TRANS) Grid versus Vertical (VERT) Grid Panels ... 86
Figure 4-36 : Load Deflection for 2" EPS Panels with Gaps ... 87
Figure 4-37 : Load Deflection for 4" EPS Panels with Gaps ... 88
Figure 4-38 : Load Deflection for 2" XPS Panels with Gaps ... 88
Figure 4-40 : Shear Flow for EPS Rigid Foam Insulation with 6” Gaps in Carbon Shear Grid
... 90
Figure 4-41 : Shear Flow for XPS Rigid Foam Insulation with 6” Gaps in Carbon Shear Grid ... 90
Figure 4-42 : Load Deflection for 4’ Panels with 2" EPS with and without Carbon Grid ... 92
Figure 4-43 : Example of Cut Line for Tested Panels ... 93
Figure 4-44 : Photo of Typical Buckling of Compression Chords in Carbon Grid (EPS Foam) ... 94
Figure 4-45 : Photo of Typical Rupture of Tension Chord in Carbon Grid (EPS Foam) ... 94
Figure 4-46 : Examples of Carbon Grid Pull-Out and Rupture (XPS) ... 95
Figure 4-47 : Carbon Grid Pull-Out and Concrete Face of Carbon Grid Embedment (XPS) 95 Figure 4-48 : Photo of Typical Concrete Faces from XPS Panels after Removing Insulation96 Figure 4-49 : Photo of Typical Concrete Faces from EPS Panels after Removing Insulation 97 Figure 4-50 : EPS Long Term Behavior Results ... 98
Figure 4-51 : XPS Long Term Behavior Results ... 99
Figure 5-1 : Avg. Experimental vs. Avg. Calculated Shear Flow ... 104
Figure 5-2 : Effect of Insulation Type Data with Calculated Shear Flow – 2” Insulation ... 105
Figure 5-3 : Effect of Insulation Type Data with Calculated Shear Flow – 4” Insulation ... 105
Figure 5-4 : Effect of Insulation Thickness with Calculated Values- EPS ... 106
Figure 5-5 : Effect of Insulation Thickness with Calculated Values- XPS ... 106
Figure 5-6 : Effect of Grid Spacing – EPS ... 107
Figure 5-7 : Effect of Grid Spacing – XPS ... 107
Figure 5-8 : Effect of a Gap in the Continuous Line of Grid ... 108
Figure 5-9 : Panel Configuration, Loading, Shear, and Moment Diagrams ... 110
Figure 9-1 : Load vs. Displacement on all 8 sensors for 24.EPS.12.2.A ... 124
Figure 9-2 : Load vs. Lateral Displacement for 24.EPS.12.2.A ... 124
Figure 9-3 : Specimen 24.EPS.12.2.A after Testing ... 124
Figure 9-4 : Specimen 24.EPS.12.2.A after Testing ... 124
Figure 9-5 : Load vs Displacement on all 8 Sensors for 24.EPS.12.2.B ... 125
Figure 9-6 : Load vs Lateral Displacement for 24.EPS.12.2.B ... 125
Figure 9-7 : Specimen 24.EPS.12.2.B after Testing ... 125
Figure 9-8 : Specimen 24.EPS.12.2.B after Testing ... 125
Figure 9-9 : Load vs. Displacement on all 8 sensors for 24.EPS.12.4.A ... 126
Figure 9-10 : Load vs Lateral Displacement... 126
Figure 9-11 : Specimen 24.EPS.12.4.A before ... 126
Figure 9-12 : Specimen 24.EPS.12.4.A after Testing ... 126
Figure 9-13 : Load vs Displacement on all 8 Sensors for 24.EPS.12.4.B ... 127
Figure 9-14 : Load vs Lateral Displacement for 24.EPS.12.4.B ... 127
Figure 9-15 : Specimen 24.EPS.12.4.B before and after Testing ... 127
Figure 9-16 : Load vs. Displacement on all 8 sensors for 24.EPS.12.6.A ... 128
Figure 9-17 : Load vs Lateral Displacement for 24.EPS.12.6.A ... 128
Figure 9-18 : Specimen 24.EPS.12.6.A before and after Testing ... 128
Figure 9-20 : Load vs Lateral Displacement for 24.EPS.12.6.B ... 129
Figure 9-21 : Specimen 24.EPS.12.6.B before and after Testing ... 129
Figure 9-22 : Load vs Displacement on all 8 Sensors for 36.EPS.18.2.A ... 130
Figure 9-23 : Photo of Foam Shear for Specimen 36.EPS.18.2.A ... 130
Figure 9-24 : Load vs Displacement on all 8 Sensors for 36.EPS.18.2.B ... 131
Figure 9-25 : Specimen 36.EPS.18.2.B after Testing (Load Released) ... 131
Figure 9-26 : Load vs Displacement on all 8 Sensors for 36.EPS.18.4.A ... 132
Figure 9-27 : Load vs Lateral Displacement for 36.EPS.18.4.A ... 132
Figure 9-28 : Specimen 36.EPS.18.4.A before and after Testing ... 132
Figure 9-29 : Load vs Displacement on all 8 Sensors for 36.EPS.18.4.B ... 133
Figure 9-30 : Load vs Lateral Displacement for 36.EPS.18.4.B ... 133
Figure 9-31 : Specimen 36.EPS.18.4.B after Testing ... 133
Figure 9-32 : Load vs Displacement on all 8 Sensors for 36.EPS.18.6.A ... 134
Figure 9-33 : Load vs Lateral Displacement for 36.EPS.18.6.A ... 134
Figure 9-34 : Specimen 36.EPS.18.6.A before and after Testing ... 134
Figure 9-35 : Load vs Displacement on all 8 Sensors for 36.EPS.18.6.B ... 135
Figure 9-36 : Load vs Lateral Displacement for 36.EPS.18.6.B ... 135
Figure 9-37 : Specimen 36.EPS.18.6.B before and after Testing ... 135
Figure 9-38 : Load vs Displacement on all 8 Sensors for 48.EPS.24.2.A ... 136
Figure 9-39 : Load vs Lateral Displacement for 48.EPS.24.2.A ... 136
Figure 9-40 : Specimen 48.EPS.24.2.A before and after Testing ... 136
Figure 9-41 : Load vs Displacement on all 8 Sensors for 48.EPS.24.2.B ... 137
Figure 9-42 : Load vs Lateral Displacement for 48.EPS.24.2.B ... 137
Figure 9-43 : Specimen 48.EPS.24.2.B before and after Testing ... 137
Figure 9-44 : Load vs Displacement on all 8 Sensors for 48.EPS.24.4.A ... 138
Figure 9-45 : Load vs Lateral Displacement for 48.EPS.24.4.A ... 138
Figure 9-46 : Specimen 48.EPS.24.4.A before and after Testing ... 138
Figure 9-47 : Load vs Displacement on all 8 Sensors for 48.EPS.24.4.B ... 139
Figure 9-48 : Load vs Lateral Displacement for 48.EPS.24.4.B ... 139
Figure 9-49 : Specimen 48.EPS.24.4.B before and after Testing ... 139
Figure 9-50 : Load vs Displacement on all 8 Sensors for 48.EPS.24.6.A ... 140
Figure 9-51 : Load vs Lateral Displacement for 48.EPS.24.6.A ... 140
Figure 9-52 : Specimen 48.EPS.24.6.A before and after Testing ... 140
Figure 9-53 : Specimen 48.EPS.24.6.A before and after Testing ... 140
Figure 9-54 : Load vs Displacement on all 8 Sensors for 48.EPS.24.6.B ... 141
Figure 9-55 : Load vs Lateral Displacement for 48.EPS.24.6.B ... 141
Figure 9-56 : Specimen 48.EPS.24.6.B before and after Testing ... 141
Figure 9-57 : Load vs Displacement on all 8 Sensors for 48.EPS.24.8.A ... 142
Figure 9-58 : Load vs Lateral Displacement for 48.EPS.24.8.A ... 142
Figure 9-59 : Specimen 48.EPS.24.8.A before and after Testing ... 142
Figure 9-60 : Load vs Displacement on all 8 Sensors for 48.EPS.24.8.B ... 143
Figure 9-61 : Load vs Lateral Displacement for 48.EPS.24.8.B ... 143
Figure 9-63 : Load vs Displacement on all 8 Sensors for 72.EPS.36.2.A ... 144
Figure 9-64 : Load vs Lateral Displacement for 72.EPS.36.2.A ... 144
Figure 9-65 : Specimen 72.EPS.36.2.A before and after Testing ... 144
Figure 9-66 : Load vs Displacement on all 8 Sensors for 72.EPS.36.2.B ... 145
Figure 9-67 : Load vs Lateral Displacement for 72.EPS.36.2.B ... 145
Figure 9-68 : Specimen 72.EPS.36.2.B before and after Testing ... 145
Figure 9-69 : Load vs Displacement on all 8 Sensors for 72.EPS.36.4.A ... 146
Figure 9-70 : Load vs Lateral Displacement for 72.EPS.36.4.A ... 146
Figure 9-71 : Specimen 72.EPS.36.4.A after Testing ... 146
Figure 9-72 : Load vs Displacement on all 8 Sensors for 72.EPS.36.4.B ... 147
Figure 9-73 : Load vs Lateral Displacement for 72.EPS.36.4.B ... 147
Figure 9-74 : Specimen 72.EPS.36.4.B before and after Testing ... 147
Figure 9-75 : Load vs. Displacement on all 8 sensors for 72.EPS.36.6.A ... 148
Figure 9-76 : Load vs Lateral Displacement for 72.EPS.36.6.A ... 148
Figure 9-77 : Photo Before and After Testing of Specimen 72.EPS.36.6.A ... 148
Figure 9-78 : Load vs Displacement on all 8 Sensors for 72.EPS.36.6.B ... 149
Figure 9-79 : Load vs Lateral Displacement for 72.EPS.36.6.B ... 149
Figure 9-80 : Specimen 72.EPS.36.6.B after Testing ... 149
Figure 9-81 : Specimen 72.EPS.36.6.B before and after Testing ... 149
Figure 9-82 : Load vs Displacement on all 8 Sensors for 24.XPS.12.2.A ... 150
Figure 9-83 : Load vs Lateral Displacement for 24.XPS.12.2.A ... 150
Figure 9-84 : Specimen 24.XPS.12.2.A after Testing ... 150
Figure 9-85 : Load vs Displacement on all 8 Sensors for 24.XPS.12.2.B ... 151
Figure 9-86 : Load vs Lateral Displacement for 24.XPS.12.2.B ... 151
Figure 9-87 : Specimen 24.XPS.12.2.B after Testing... 151
Figure 9-88 : Specimen 24.XPS.12.2.B after Testing... 151
Figure 9-89 : Load vs Displacement on all 8 Sensors for 24.XPS.12.4.A ... 152
Figure 9-90 : Load vs Lateral Displacement for 24.XPS.12.4.A ... 152
Figure 9-91 : Specimen 24.XPS.12.4.A after Testing ... 152
Figure 9-92 : Load vs Displacement on all 8 Sensors for 24.XPS.12.4.B ... 153
Figure 9-93 : Load vs Lateral Displacement for 24.XPS.12.4.B ... 153
Figure 9-94 : Specimen 24.XPS.12.4.B after Testing... 153
Figure 9-95 : Load vs Displacement on all 8 Sensors for 36.XPS.18.2.A ... 154
Figure 9-96 : Specimen 36.XPS.18.2.A after Testing ... 154
Figure 9-97 : Specimen 36.XPS.18.2.A after Testing ... 154
Figure 9-98 : Load vs Displacement on all 8 Sensors for 36.XPS.18.2.B ... 155
Figure 9-99 : Specimen 36.XPS.18.2.B after Testing... 155
Figure 9-100 : Specimen 36.XPS.18.2.B after Testing ... 155
Figure 9-101 : Load vs Displacement on all 8 Sensors for 36.XPS.18.4.A ... 156
Figure 9-102 : Load vs Lateral Displacement for 36.XPS.18.4.A ... 156
Figure 9-103 : Specimen 36.XPS.18.4.A before and after Testing ... 156
Figure 9-104 : Load vs Displacement on all 8 Sensors for 36.XPS.18.4.B ... 157
Figure 9-106 : Specimen 36.XPS.18.4.B before and after Testing... 157
Figure 9-107 : Load vs Displacement on all 8 Sensors for 48.XPS.24.2.A ... 158
Figure 9-108 : Load vs Lateral Displacement for 48.XPS.24.2.A ... 158
Figure 9-109 : Specimen 48.XPS.24.2.A before and after Testing ... 158
Figure 9-110 : Load vs Displacement on all 8 Sensors for 48.XPS.24.2.B ... 159
Figure 9-111 : Load vs Lateral Displacement for 48.XPS.24.2.B ... 159
Figure 9-112 : Specimen 48.XPS.24.2.B after Testing ... 159
Figure 9-113 : Load vs Displacement on all 8 Sensors for 48.XPS.24.4.A ... 160
Figure 9-114 : Load vs Lateral Displacement for 48.XPS.24.4.A ... 160
Figure 9-115 : Specimen 48.XPS.24.4.A before and after Testing ... 160
Figure 9-116 : Load vs Displacement on all 8 Sensors for 48.XPS.24.4.B ... 161
Figure 9-117 : Load vs Lateral Displacement for 48.XPS.24.4.B ... 161
Figure 9-118 : Specimen 48.XPS.24.4.B after Testing ... 161
Figure 9-119 : Load vs Displacement on all 8 Sensors for 72.XPS.36.2.A ... 162
Figure 9-120 : Load vs Lateral Displacement for 72.XPS.36.2.A ... 162
Figure 9-121 : Specimen 72.XPS.36.2.A before and after ... 162
Figure 9-122 : Specimen 72.XPS.36.2.A before and after Testing ... 162
Figure 9-123 : Load vs Displacement on all 8 Sensors for 72.XPS.36.2.B ... 163
Figure 9-124 : Load vs Lateral Displacement for 72.XPS.36.2.B ... 163
Figure 9-125 : Specimen 72.XPS.36.2.B before and after Testing... 163
Figure 9-126 : Load vs Displacement on all 8 Sensors for 72.XPS.36.4.A ... 164
Figure 9-127 : Load vs Lateral Displacement for 72.XPS.36.4.A ... 164
Figure 9-128 : Specimen 72.XPS.36.4.A before and after Testing ... 164
Figure 9-129 : Load vs Displacement on all 8 Sensors for 72.XPS.36.4.B ... 165
Figure 9-130 : Load vs Lateral Displacement for 72.XPS.36.4.B ... 165
Figure 9-131 : Specimen 72.XPS.36.4.B before and after Testing... 165
Figure 10-1 : Load vs Displacement on all 8 Sensors for 48.EPS.24.2.DEBOND.A ... 166
Figure 10-2 : Load vs Lateral Displacement for 48.EPS.24.2.DEBOND.A ... 166
Figure 10-3 : Specimen 48.EPS.24.2.DEBOND.A after Testing ... 166
Figure 10-4 : Load vs Displacement on all 8 Sensors for 48.EPS.24.2.DEBOND.B... 167
Figure 10-5 : Load vs Lateral Displacement for 48.EPS.24.2.DEBOND.B ... 167
Figure 10-6 : Specimen 48.EPS.24.2.DEBOND.B before and after Testing ... 167
Figure 10-7 : Load vs Displacement on all 8 Sensors for 48.EPS.24.4.DEBOND.A ... 168
Figure 10-8 : Load vs Lateral Displacement for 48.EPS.24.4.DEBOND.A ... 168
Figure 10-9 : Specimen 48.EPS.24.4.DEBOND.A after Testing ... 168
Figure 10-10 : Specimen 48.EPS.24.4.DEBOND.A before and after Testing ... 168
Figure 10-11 : Load vs Displacement on all 8 Sensors for 48.EPS.24.4.DEBOND.B... 169
Figure 10-12 : Load vs Lateral Displacement for 48.EPS.24.4.DEBOND.B ... 169
Figure 10-13 : Specimen 48.EPS.24.4.DEBOND.B after Testing ... 169
Figure 10-14 : Load vs Displacement on all 8 Sensors for 48.XPS.24.2.DEBOND.A ... 170
Figure 10-15 : Load vs Lateral Displacement for 48.XPS.24.2.DEBOND.A ... 170
Figure 10-16 : Specimen 48.XPS.24.2.DEBOND.A before and after Testing ... 170
Figure 10-18 : Load vs Lateral Displacement for 48.XPS.24.2.DEBOND.B ... 171
Figure 10-19 : Specimen 48.XPS.24.2.DEBOND.B after Testing ... 171
Figure 10-20 : Load vs Displacement on all 8 Sensors for 48.XPS.24.4.DEBOND.A ... 172
Figure 10-21 : Load vs Lateral Displacement for 48.XPS.24.4.DEBOND.A ... 172
Figure 10-22 : Specimen 48.XPS.24.4.DEBOND.A after Testing ... 172
Figure 10-23 : Specimen 48.XPS.24.4.DEBOND.A before and after Testing ... 172
Figure 10-24 : Load vs Displacement on all 8 Sensors for 48.XPS.24.4.DEBOND.B ... 173
Figure 10-25 : Load vs Lateral Displacement for 48.XPS.24.4.DEBOND.B ... 173
Figure 10-26 : Specimen 48.XPS.24.4.DEBOND.B after Testing ... 173
Figure 11-1 : Load vs Displacement on all 8 Sensors for 48.EPS.36.2.TRANS.A ... 174
Figure 11-2 : Load vs Lateral Displacement for 48.EPS.36.2.TRANS.A ... 174
Figure 11-3 : Specimen 48.EPS.36.2.TRANS.A after Testing ... 174
Figure 11-4 : Load vs Displacement on all 8 Sensors for 48.EPS.36.2.TRANS.B ... 175
Figure 11-5 : Load vs Lateral Displacement for 48.EPS.36.2.TRANS.B ... 175
Figure 11-6 : Specimen 48.EPS.36.2.TRANS.B after Testing ... 175
Figure 11-7 : Load vs Displacement on all 8 Sensors for 48.XPS.36.2.TRANS.A ... 176
Figure 11-8 : Load vs Lateral Displacement for 48.XPS.36.2.TRANS.A... 176
Figure 11-9 : Specimen 48.XPS.36.2.TRANS.A after Testing ... 176
Figure 11-10 : Load vs Displacement on all 8 Sensors for 48.XPS.36.2.TRANS.B ... 177
Figure 11-11 : Load vs Lateral Displacement for 48.XPS.36.2.TRANS.B ... 177
Figure 11-12 : Photo of Specimen 48.XPS.36.2.TRANS.B after Testing ... 177
Figure 11-13 : Specimen 48.XPS.36.2.TRANS.B after Testing ... 177
Figure 12-1 : Load vs Displacement on all 8 Sensors for 36.EPS.18.2.GAP.A ... 178
Figure 12-2 : Load vs Lateral Displacement for 36.EPS.18.2.GAP.A ... 178
Figure 12-3 : Specimen 36.EPS.18.2.GAP.A before and after Testing ... 178
Figure 12-4 : Load vs Displacement on all 8 Sensors for 36.EPS.18.2.GAP.B ... 179
Figure 12-5 : Load vs Lateral Displacement for 36.EPS.18.2.GAP.B ... 179
Figure 12-6 : Specimen 36.EPS.18.2.GAP.B after Testing ... 179
Figure 12-7 : Load vs Displacement on all 8 Sensors for 36.EPS.18.4.GAP.A ... 180
Figure 12-8 : Load vs Lateral Displacement for 36.EPS.18.4.GAP.A ... 180
Figure 12-9 : Specimen 36.EPS.18.4.GAP.A after Testing ... 180
Figure 12-10 : Load vs Displacement on all 8 Sensors for 36.EPS.18.4.GAP.B ... 181
Figure 12-11 : Load vs Lateral Displacement for 36.EPS.18.4.GAP.B ... 181
Figure 12-12 : Specimen 36.EPS.18.4.GAP.B after Testing ... 181
Figure 12-13 : Load vs Displacement on all 8 Sensors for 36.XPS.18.2.GAP.A... 182
Figure 12-14 : Load vs Lateral Displacement for 36.XPS.18.2.GAP.A ... 182
Figure 12-15 : Specimen 36.XPS.18.2.GAP.A after Testing ... 182
Figure 12-16 : Load vs Displacement on all 8 Sensors for 36.XPS.18.2.GAP.B ... 183
Figure 12-17 : Load vs Lateral Displacement for 36.XPS.18.2.GAP.B ... 183
Figure 12-18 : Specimen 36.XPS.18.2.GAP.B after Testing... 183
Figure 12-19 : Load vs Displacement on all 8 Sensors for 36.XPS.18.4.GAP.A... 184
Figure 12-20 : Load vs Lateral Displacement for 36.XPS.18.4.GAP.A ... 184
Figure 12-22 : Load vs Displacement on all 8 Sensors for 36.XPS.18.4.GAP.B ... 185
Figure 12-23 : Load vs Lateral Displacement for 36.XPS.18.4.GAP.B ... 185
Figure 12-24 : Specimen 36.XPS.18.4.GAP.B before and after Testing... 185
Figure 13-1 : Load vs Displacement on all 8 Sensors for 48.EPS.NONE.2.A ... 186
Figure 13-2 : Load vs Lateral Displacement for 48.EPS.NONE.2.A ... 186
Figure 13-3 : Specimen 48.EPS.NONE.2.A after Testing ... 186
Figure 13-4 : Load vs Displacement on all 8 Sensors for 48.EPS.NONE.2.B ... 187
Figure 13-5 : Load vs Lateral Displacement for 48.EPS.NONE.2.B ... 187
Figure 13-6 : Specimen 48EPS.NONE.B after Testing ... 187
Figure 13-7 : Specimen 48.EPS.NONE.2.B before and after Testing ... 187
Figure 13-8 : Specimen 48.XPS.NONE.2.A... 188
INTRODUCTION
1
Background
1.1.
The first use of precast concrete wall panels in the construction industry was in the form of “tilt-ups” or “tilt-slabs.” At that time the contractor cast the floor slab and set the formwork for the wall panels directly on the slab, next to where the panel would ultimately be installed. The panels were then cast in the horizontal position and, after proper curing, forms were stripped and the panels tilted up for installation in the proper location. (Havel 75-79) Later, advances were made by moving the panel construction offsite into a factory setting; precast concrete producers were then capable of achieving the same type of construction and improve the quality control and efficiency.
Sandwich panels consist of two discrete layers of concrete, called wythes, one on either side of an inner layer of rigid foam insulation. They are commonly described by a sequence of three numbers that denote the thickness of each layer in the panel. For example, a 3-2-3 panel would consist of two layers of 3” concrete, referred to as the inner and outer wythes, separated by a 2” layer of foam insulation. An illustration of a modern architectural sandwich panel with a thin brick veneer is shown in Figure 1-1.
Figure 1-1 : Example of an Architectural Sandwich Panel (AltusGroup, LLC website)
contractors have found that the use of sandwich panels allows for rapid construction, providing a clean, comfortable environment for other trades to work.(PCI Committee on Precast Sandwich Wall Panels, 2011)
The addition of an insulating layer changes the structural behavior of the solid concrete wall panel, as the applied load is now resisted by two discrete thin concrete wythes. The early generation of sandwich panels were non-composite and consisted of one thick concrete structural wythe (or a hollow-core slab, double tee, or single tee), a layer of rigid insulation, and a second nonstructural concrete wythe, normally referred to as cladding. (PCI Committee on Precast Sandwich Wall Panels, 2011) To resist the handling and service forces on these non-composite panels, steel ties and solid concrete zones were used to connect the two concrete wythes and ensure the integrity of the panel.
material to provide the connection between the inner and outer concrete wythes. FRP is a material characterized by a lower thermal conductivity in comparison to concrete and steel.
Fiber reinforced polymer (FRP) composites have many desirable qualities that make them an attractive alternative for the construction of prestressed precast concrete sandwich wall panels. When compared to steel, FRP composites have a high ratio of strength to mass density (10-15 times greater). In addition, carbon fiber (CFRP) and aramid fiber (AFRP) reinforcements have up to three times higher fatigue characteristics, excellent resistance to corrosion, and are electromagnetically neutral.(Erki & Rizkalla, 1993) However, the most appealing characteristic of FRP and particularly CFRP, in regards to concrete sandwich wall panels, is its low thermal conductivity that allows the panel to achieve the designed thermal properties. The CFRP material ties the two wythes of concrete together with minimal formation of thermal bridges, such as those formed by concrete block-outs or steel ties.
Figure 1-2 : Strain Profiles for Various Degrees of Composite Action (Each sketch depicts two concrete wythes with a foam core)
moment and act independently from each other, as shown in Figure 1-2(b). Partially composite panels have shear connectors that provide some shear resistance, without full composite action, as shown in Figure 1-2(c); therefore, the bending stiffness and strength are between those of the fully composite and fully non-composite panels.
The amount of shear transferred across the insulation for a specific configuration of shear connection is challenging to predict, and therefore, the degree of composite action is difficult to determine. Difficulty in determining the level of composite action leads to trouble in predicting the structural behavior of the panel, including moment capacity and thermal deflections (or thermal bowing) caused by temperature differences between the two concrete wythes. The experimental program presented in this thesis attempts to characterize the behavior of panels using CFRP grid as a shear transfer mechanism. This research will help designers to determine the degree of composite action attained from different panel configurations.
Research Objective
1.2.
by these parameters. Details of the selected specimens and the testing procedure are discussed in detail in Chapter 3. Panels were tested in a double shear fashion to minimize the eccentric location of the applied shear, as shown in Figure 1-3. Test results were used to develop a design equation to predict the shear flow strength of various combinations of grid spacing, foam types, foam thicknesses, and grid orientation.
Figure 1-3 : Double Shear
V
Scope
1.3.
LITERATURE REVIEW
2
History
2.1.
One of the earliest reported uses of concrete sandwich wall panels for building construction was in 1906. The panel was constructed with a two inch layer of sand placed between two wythes of concrete and tied together with reinforcement. The sand was eventually washed out as the panel was lifted into place, creating a hollow core sandwich panel. This early concrete sandwich wall panel, constructed in 1906, is shown in Figure 2-1. Early generations of concrete sandwich wall panels used different materials to separate the two wythes of concrete. These materials included sand, woodchips, lightweight vermiculite concrete, cellular glass, foam concrete, and expanded shale.(Collins, 1954)
Even at the time of Collins’ article in 1954, it was well known that shear ties were needed to connect the outer concrete wythes together. Collins suggested that a wood fiber filler material could possibly be used without shear connectors, though he noted that most designers chose to include minimum shear ties for all tilt-up construction panels. Examples of shear ties at the time are shown in Figure 2-2. Finally, Collins concluded by mentioning that, “The proposed sandwich wall panel – 33 ft. high, 6 ½ in. thick, with two outer shells 1 ¾ in. thick, the filler of lightweight concrete, and prestressed - would meet the reduced weight requirements, provide excellent insulation and offer one of the best opportunities to date to prestress wall panels economically.” The millions of square feet of sandwich panels produced to date demonstrate the validity of Collins’ statement.
Figure 2-2 : Examples of Shear Ties given by Collins
A 1000-family housing development named Forrestal Village was erected in 1951-1952 at Great Lakes, Illinois. It was the first large scale residential construction project in North America to employ precast concrete sandwich wall panels.(Lorman & Wiehle, 1953) Three different shear connectors were used during construction, starting with simple 6” long steel J-pins, similar to the pin shown in Figure 2-2(D). These pins were punched through the foam insulation layer into the bottom concrete wythe and the top layer cast on the “J” portion protruding upward. This method was superseded by 4” wide strips of welded wire mesh and then by expanded metal shear connectors like the one shown in Figure 2-2(A).
Figure 2-3 : Early Precast Concrete Wall System (ACI Journal, 1935)
Joining the concrete wythes with sufficient shear connectors allows them to work together, as one structural unit in composite action.
The progression of sandwich panel construction and design through the recent decades started in the 1960s with fully composite double tee sandwich wall panels with solid concrete zones. Solid concrete zones were again used to create full composite action in the next generation of panel technology, flat faced sandwich wall panels. However, due to thermal bridging, caused by the concrete ribs connecting the wythes through the insulation core, the thermal efficiency of these panels was reduced. To produce a more thermally efficient panel, while maintaining the full composite action and structural efficiency, metal trusses began replacing the solid concrete ribs. Although these steel trusses provided an improvement over solid concrete shear zones, its conductivity still hampered the thermal efficiencies of these panels.(Gleich, 2007)
Composite Action
2.2.
Composite action is achieved when the shear forces that are developed at the face of one wythe can be transferred to the other wythe through the shear connectors. This allows both wythes to work together to resist the applied forces as a single section. The most effective design can be achieved when the predicted behavior matches the actual structural behavior.(PCI Committee on Precast Sandwich Wall Panels, 2011) The predicted behavior, however, is highly dependent on the degree of composite action attained by the panel. Until recently, the knowledge base on the performance and behavior of sandwich panels was centered primarily on the observations of panels in service and limited testing up to failure. There have been several studies recently on sandwich wall panels examining several different parameters believed to affect their behavior. This experimental work has been carried out in an effort to better characterize the composite action of sandwich panels and develop more accurate predictions of their behavior.
Figure 2-4 : Various Types of Architectural Loadbearing Wall Panels (PCI Journal, Sept.-Oct. 1999)
connectors, including FRP connectors, are shown in Figure 2-5.(PCI Committee on Precast Sandwich Wall Panels, 2011)
Figure 2-5 : Examples of Non-composite Connectors (PCI Journal, Spring 2011)
evaluate the shear flow characteristics of any shear transfer mechanism used in prestressed precast concrete sandwich wall panels. The percent composite action achieved for a particular panel configuration cannot be determined unless the load carrying capacity and stiffness of the shear connectors is well defined.
Figure 2-6 : One-way Shear Connectors (PCI Journal, Spring 2011)
complicated issue, difficult to predict, and highly dependent on many factors. In some cases, the secondary moment effects caused by this bowing can ultimately control the design of load bearing panels. Composite action between the wythes causes the panel to act as a single unit in resisting bending forces, as shown in Figure 2-7. This composite behavior has a drawback in that the differential strain between the wythes, caused by temperature or humidity gradients, produces bowing.(Losch, 2003) Non-composite panels typically do not experience this thermal bowing because thermal strain in the outer concrete wythe is not transferred to the inner wythe, i.e. each wythe will deform independently. The degree of composite action dictates the extent of this bowing, and therefore, the need to accurately predict the shear transfer across the rigid insulation layer arises.
Figure 2-7 : Depiction of Non-Composite vs. Composite Action
Figure 2-8 : Percent Composite Action Results (PCI Journal, March-April 1994)
predicted values was far larger for forces in the diagonal truss elements. The models overestimated the forces in the truss element by as much as six to eight fold compared to those obtained from strain gauge data during testing. The analytical and experimental work completed by Bush further highlights the need to better characterize any shear transfer mechanism used in sandwich wall panels, in order to better predict panel performance and behavior.
Figure 2-9 : Load Deflection at Mid-Span for Panel P11 (Construction and Building Materials, 2008)
Thermal Efficiency
2.3.
Thermal transmission is a key physical property that determines the insulating
capability of sandwich panels. The ability of the panel to prevent heat flow across the
thickness of the panel is affected by the characteristics of the insulation system to resist
transfer of energy. (PCI Committee on Precast Sandwich Wall Panels, 2011) The effect of
thermal mass and thermal lag of concrete sandwich wall panels is shown in Figure 2-10. The thermal mass of concrete sandwich panels results in lower peak heating and cooling loads, in comparison to metal and wood framed walls. Thermal mass also causes a lag in the time it takes to reach these peaks, thus producing lower heating and cooling loads. As the inner concrete wythe thickness is increased, these thermal properties become more pronounced, as shown in Figure 2-10.
Figure 2-10 : Thermal Mass Effects on Heating and Cooling Loads Various Wall Panels (Left) & Sandwich Panels (Right)
The use of concrete and steel as shear connectors in concrete sandwich wall panels reduces the effective thermal performance of the building envelope. These materials conduct thermal energy at a much higher rate than the insulating core, creating thermal bridges. “Thermal bridging is the phenomenon associated with how heat moves through substances with different thermal conductivities. It indicates that heat takes the path of least resistance through these materials.”(McCall, 1985) Heat is allowed to pass through the sandwich panel, via the steel wythe connectors, which can have a thermal conductivity as much as 1500 times greater than the insulating core. Results indicate that steel connectors, penetrating just 0.01% of the total panel area, can reduce the thermal performance of the panel by as much as 7%. A combination of 0.08% steel and 21.25% concrete reduces the insulating performance of the sandwich panel by 77%.(McCall, 1985)
Figure 2-11 : Thermal Resistance vs. Concrete Area for Panels with 0.05% Connectors Penetrating the Insulation (Sauter, 1991)
In an attempt to increase the thermal efficiency of precast concrete sandwich wall panels, Lee and Pessiki (2006) investigated the use of a three-wythe panel system. Panels had an additional wythe of concrete and layer of insulation added to the typical two-wythe sandwich panel. Concrete ribs were used as shear transfer mechanisms and were staggered through the concrete thickness, as shown in Figure 2-13. This increased the length of the path that thermal energy needed to travel in order to traverse the panel thickness.(Lee & Pessiki, 2006) Experimental results indicated that, in general, three-wythe panels performed better thermally than the typical two-wythe panel due to the increase in the length of the thermal path. It was also found that the R-value of the three-wythe panel increased as the insulation overlap length was increased.
Figure 2-13 : One Variation of a Three-wythe Sandwich Panel (PCI Journal, March-April 2008)
An experimental program was later completed to assess the structural behavior of two three-wythe panels, each containing different variations in the size and location of the concrete ribs. It was found that these two panels were capable of creating 79% and 94% composite action, depending on the size and location of the concrete ribs.(Lee & Pessiki, 2008)
inverse of R-value, have been tightened from approximately 1.2 during 1961-1977, down to 0.2 from 2006 onward. The authors concluded by commenting that thermal bridging severely hindered the insulating qualities of building envelopes built during that period. Insulating requirements will undoubtedly become more stringent as nations continue to focus on energy efficiency and environmental impact. Construction of sandwich panels that outperform the current code requirements, by minimizing the thermal bridging, will allow for less future retrofitting, reduced energy consumption, and subsequently reduced long-term costs of these structures.
FRP Shear Transfer Mechanism
2.4.
Figure 2-14 : FRP Bent Bar Shear Connector (PCI Journal, July-August 1994)
To evaluate the interaction between the rigid foam insulation and concrete at the bonded interface, panels were tested both with and without a layer of material to break this bond. Specimens tested with full bond between the insulation and the concrete resulted in lower strains in the FRP bars at any given load, compared to those with the bond breaker. This suggests that the interface bond does share the shear transfer between the concrete wythes.(Einea, 1992)
These research programs have indicated that FRP shear connectors can provide the dual purpose of improving the thermal capabilities of a building envelope, while at the same time, providing the desired structural integrity and efficiency.
An innovative technique for transferring shear that was investigated by Pantelides et al (2008) indicated that 97-99% composite action could be attained by using GFRP shells as the shear transfer mechanism in precast concrete sandwich wall panels. Pantelides found that the panels failed in a ductile manner, suggesting that the GFRP shells provided sufficient shear transfer between the inner and outer concrete wythes. This GFRP shell shear mechanism is shown in Figure 2-15 and a drawing of the cross-section of this system is shown in Figure 2-16.
Figure 2-16 : Cross Section of Wall Panel using GFRP Shell Shear Mechanism (Journal of Composites for Construction, 2008)
Recently, the precast industry has begun using CFRP grid, cut at a 45 degree angle, and placed in a truss orientation as a shear transfer mechanism, as shown in Figure 2-17. Test results indicated that these grids could produce the same composite action while minimizing the thermal bridging effect.(Frankl, 2008) Detail of the panel cross-section and elevation, using this grid, are shown in Figure 2-18.
Figure 2-18 : Cross Section Views of Panels with CFRP Shear Grid (From Structure Magazine, April 2007)
Frankl et al (2008) completed an extensive experimental program to determine the behavior of precast, prestressed concrete sandwich wall panels reinforced with this CFRP shear grid. Frankl found that full composite action could be achieved with CFRP grid shear connections.(Frankl, 2008) It was discovered that the desired composite action could be achieved using either EPS or XPS rigid foam insulation in combination with CFRP grid. However, panels constructed using EPS insulation, provided a better shear transfer mechanism and achieved higher percent composite action than XPS insulation. This required an increase in the shear reinforcement ratio for XPS compared with EPS insulation.
Hassan analyzed the experimental results from Frankl to establish the shear flow capacities of the carbon fiber grid when used with either EPS or XPS insulation.(Hassan & Rizkalla, 2010) The shear flow capacity of the grid/foam combination q can be expressed using the following equation
(2.1)
where
q = shear flow capacity [lb/in]
F = the max force at the interface at the critical section at the ultimate-load level [lb] L = the length of CFRP grid along the width of the panel up to the critical section [in]
Using this method, Hassan calculated the shear flow capacity for the panels tested by Frankl. The nominal shear flow capacity of the CFRP grid/XPS combination was found to be 190 lb/in, while the CFRP grid/EPS combination produced 400 lb/in. The discrepancy in values was attributed to the superior bond that EPS rigid foam insulation forms at the concrete interface when compared with that of XPS. During post testing inspection of the panels, XPS foam was easily removed by hand as it was completely separated from the concrete wythes.
characterize the CFRP grid and insulation mechanism shear relationship.(Kim, Messenger, & Harmon, 2010) The program investigated the effect of several parameters, grid embedment length, insulation thickness and type, shear grid density, and the effect of repeated loading, on the shear flow strength of the composite connector. Results indicated that the shear transfer strength depends on both the shear grid density (spacing), and the insulation type and thickness.
Design Methods
2.5.
Structural demand from applied gravity and wind loading induce flexural, shear, tension, and compression stresses in the precast concrete sandwich panels. Resisting these demands in the most efficient way requires some degree of composite action be achieved between the two separate concrete wythes of the sandwich panel. This can be accomplished by providing sufficient shear reinforcement to transfer the forces from the inner to the outer concrete wythe, through the insulation core. Shear connectors and/or solid concrete zones are used to transfer the applied forces and resist the load as a composite cross section. Three different methods can be used to determine the magnitude of the shear force generated by the applied load and are described in the following sections. The quantity of shear reinforcement required to develop composite action can then be determined based on the shear force and the shear capacity of the connector. To ensure composite action between the inner and outer concrete wythes is achieved, the quantity of shear grid required for a certain cross-section of the panel can be computed as follows:
(2.2)
where
= Shear flow strength of grid [kip/in or lb/in] = Load factor [i.e. 1.6]
= Material resistance factor [i.e. 0.85]
Principles of Mechanics
2.5.1.
The first method, based on the elastic response of the member, uses the principles of mechanics. The maximum shear force is determined from the design load combination and the shear flow required is calculated at the concrete/rigid foam interface using the following equation:
(2.3)
Figure 2-19 : Shear Evaluation Method 1
where
Shear flow required to create composite action [lb/in] Maximum shear force due to the applied loading [lb] First moment of area above the concrete/foam interface [in3]
ACI Simplified Method
2.5.2.
In the second method, recommended by ACI 318, shear stress ( ) is computed based on the maximum shear force acting on the panel. The shear stress acting at the interface is calculated based on the full effective cross section bd. Therefore, the shear flow can be calculated as follow:
(2.4)
where
Shear flow required to create composite action [lb/in] Maximum shear force due to the applied loading [lb] d = Distance between resultant tension and compression forces [in]
PCI Method
2.5.3.
The third method, recommended by PCI, requires design of the composite action based on the full capacity of the panel; therefore, the shear stress is calculated at the maximum moment region from the compression and tension forces acting on the cross-section.(PCI Committee on Precast Sandwich Wall Panels, 2011) The maximum horizontal shear force is determined based on the lesser of the compression and tension capacity of the section at mid-span. To simplify the calculation, the assumption is made that the entire exterior wythe is acting in compression. The required shear flow capacity, q
required, can be
computed as follows:
(2.5)
(2.6)
(2.7)
(2.8)
where
Shear force required to create composite action [kips] Area of prestressing steel in tension wythe, [in2]
Area of non-prestressed steel in tension wythe, [in2]
Yield stress in non-prestressed steel [ksi] Concrete compressive strength, [ksi] Width of wall panel, [in.]
Thickness of compression wythe, [in.]
EXPERIMENTAL PROGRAM
3
A total of sixty-six panel specimens were tested to examine various parameters relevant to the behavior and strength of the carbon grid/rigid foam shear transfer mechanism. All specimens were configured with three concrete wythes, 2” outer wythes and a 4” center wythe, and two foam layers as shown in the cut-away rendering in Figure 3-1. Each specimen was tested in a “push-out” fashion, the bottom surfaces of the outer two concrete wythes supported vertically, leaving a 2” gap under the middle concrete wythe to allow for vertical deflection. Load was applied vertically to the top surface of the middle concrete wythe, directly testing the shear transfer between the center wythe and the two outer wythes through the proposed grid/rigid foam shear transfer mechanism.
Panel Configurations
3.1.
Five different panel configurations are considered in this thesis including: panels with typical vertical grid, panels with vertical grid and de-bonded rigid foam insulation, panels with transverse grid, panels with gaps along the vertical grid, and panels with no grid. Configurations of the various panels considered in this program are described in detail in the following sub-sections.
Vertical Grid Panels
3.1.1.
Figure 3-2 : Typ. 2” Insulation Specimen Section View
Figure 3-3 : Specimen Elevation of Typical Vertical Grid Panels
Debonded Panels
3.1.2.
Table 3-2 presents the four panels that were tested to examine the effect of the bond between concrete and the rigid insulation on the shear strength and behavior. Two specimens of each type were tested for a total of eight specimens. All specimens were fabricated in the same manner as the vertical grid panels, except the bond between concrete and insulation was intentionally broken. This was achieved by using two layers of thin plastic that were placed between each insulation surface and the fresh concrete, as shown in Figure 3-4. The specimens given in this table are referred to in this thesis as “debonded panels,” and are shown schematically in Figure 3-4, Figure 3-5, and Figure 3-6. The debonded panels are later compared to identical bonded panels (without the plastic sheets), tested in the program.
Table 3-2 : Tests of Debonded Panels
Figure 3-4 : Debonded 4" Insulation Specimen Section View
Foam Type
Panel Width
Grid Spacing
Foam Thickness
Test Designation
2" 48EPS.24.2.DEBOND
4" 48EPS.24.4.DEBOND
2" 48XPS.24.2.DEBOND
4" 48XPS.24.4.DEBOND
Debonded EPS
Debonded XPS
4'
4'
24"
Figure 3-5 : Specimen Elevation of Typical Debonded Panels
Transverse Grid Panels
3.1.3.
The two panel configurations given in Table 3-3 were tested to investigate the panel strength when the grid is oriented in the transverse direction (perpendicular to the applied load). Two specimens were tested for each type shown in the table for a total of four specimens. These specimens are referred to as “transverse grid panels,” and are shown schematically in Figure 3-7.
Table 3-3 : Tests of Transverse Grid Panels
Figure 3-7 : Specimen Elevation and Section View of Typical Transverse Grid Panels Foam
Type
Panel Width
w
Grid Spacing (Trans.)
Foam Thickness
t
Test Designation
EPS 4' 36"
TRANSVERSE 2" 48EPS.36.TRANS.2
XPS 4' 36"
Gap Panels
3.1.4.
Eight panels were tested to study the effect of vertical gaps (discontinuity of the grid) along the length of grid, two specimens for each of the four configurations given in Table 3-4. A single 6” gap was placed along each continuous line of grid and offset from the adjacent gap by 18”. The specimens shown in this table are defined in this thesis as “gap panels” and are shown in Figure 3-8 and Figure 3-9.
Table 3-4 : Tests of Gap Panels
Foam Type
Panel Width
w
Grid Spacing
s
Foam Thickness
t
Gap Size
Test Designation
2" 36EPS.18.2.GAP
4" 36EPS.18.4.GAP
2" 36XPS.18.2.GAP
4" 36XPS.18.4.GAP
6"
6" EPS
XPS 18"
18" 3'
Figure 3-8 : Specimen Elevation Typical Gap - Vertical Grid Panels
No Grid Panels
3.1.5.
The two panel configurations given in Table 3-5 were tested without any shear grid to examine the shear flow contribution from the rigid foam insulation without shear grid. The four specimens tested and given in this table (two identical specimens tested for each configuration shown) are defined in this thesis as “no grid panels,” and are shown schematically in Figure 3-10 and Figure 3-11.
Table 3-5 : Tests of No Grid Panels
Foam
Type
Panel
Width
w
Grid
Spacing
s
Foam
Thickness
t
Test
Designation
EPS 4' NO GRID 2" 48EPS.NONE.2
.
Figure 3-10 : Specimen Elevation Typical No Grid Panels