© Penerbit Universiti Sains Malaysia, 2017
Optical Extinction Coefficients of Gold Nanoparticle Aggregates by
Small Angle X-Ray Scattering (SAXS)
Jia-Cherng Chong,1* Noriah Bidin,1 Siew-Ling Lee,2 Mohd Marsin Sanagi,3 Supagorn Rugmai4,5 and Siriwat Soontaranon5
1Laser Centre, Universiti Teknologi Malaysia, 81310 Skudai, Johor, Malaysia 2Ibnu Sina Institute, Universiti Teknologi Malaysia, 81310 Skudai, Johor, Malaysia
3Nanotechnology Research Alliance, Universiti Teknologi Malaysia, 81310 Skudai, Johor, Malaysia
4School of Physics, Suranaree University of Technology, 111 University Avenue, 30000 Nakhon Ratchasima, Thailand
5Synchrotron Light Research Institute, Suranaree University of Technology, 111 University Avenue, 30000 Nakhon Ratchasima, Thailand
*Corresponding author: [email protected]
Published online: 15 April 2017
To cite this article: Chong, J-C. et al. (2017). Optical extinction coefficients of gold nanoparticle aggregates by small angle x-ray scattering (SAXS). J. Phys. Sci., 28(1), 61–71, https://doi.org/10.21315/jps2017.28.1.5
To link to this article: https://doi.org/10.21315/jps2017.28.1.5
ABSTRACT: The size distribution of gold hydrosol aggregates induced by ascorbic acid has been characterised by small angle x-ray scattering (SAXS). The results are used to compute the extinction coefficients around the localised surface plasmon resonance (LSPR) wavelengths and verified by comparing experimental extinction spectra obtained via spectrophotometry. Citrate refluxed gold nanoparticles with initial ionic ratio of 0.94 measured by fitting an averaged intensity profile from two scattering lengths exhibit log-normal distribution with mean diameter of 27.4 nm (σd = 14.4 nm), while ascorbic acid induced agglomeration on gold nanoparticles at pH of 3.2 has mean diameter of 51.2 nm (σd = 19.2 nm). Both experiment and simulated optical extinction shows agreement in LSPR peak wavelength corresponding to their respective mean particle sizes.
1. INTRODUCTION
Many application studies on gold nanoparticles (AuNPs) utilise their fascinating optical tunability due to size-dependent shift of localised surface plasmon resonance (LSPR) frequency.1–3 One of the greatest drawbacks for consistent performance in
photo-thermal conversion or molecular sensing is the agglomeration behaviour of the particles.4–6 The consequences often involve irregular heat distribution for the
case of photo-thermal applications or poor sensitivity as chemical markers. More so than often, changes in particle sizes and dispersity are the result of instability of the ionic species in the medium especially for liquid dispersed AuNPs synthesised via Turkevich-Frens protocols.7,8
Small angle x-ray scattering (SAXS) characterisation with intense synchrotron light source is a powerful technique to extract full size distribution and form factors of nanomaterials of various physical phases through elastic scattering of intense x-rays. It has advantages over electron microscopy for being energetically softer and describes a comparatively larger sample population. However, the cost of operation and degree of sophistication in experimental setup for SAXS often limits the technique to institutions with advanced light source facility. Since optical extinction of any colloid carries convoluted information on its size distribution, chemical behaviour and particle densities; identifying the effects of
size distribution on the profile of LSPR peak contributes to the development of a rapid, sample-specific characterisation instrument by calibrating spectral profile to
a colloidal sample with known size dynamics.
In this study, we utilise SAXS to provide rapid size distribution of citrate stabilised AuNPs in two agglomeration states when pH of the medium is altered by diluted ascorbic acid. The resulting particle sizes are used to compute theoretical
frequency-dependent extinction coefficients and are verified by experimental
optical extinction spectra around LSPR regime.
2. EXPERIMENTAL
2.1 Sample Preparation
The glassware involved in the experiment was prewashed with 3:1 molar fraction
of hydrochloric and nitric acid followed by sonification in isopropyl alcohol and
Turkevich-Frens method.7,8 Upon cooling to room temperature, 500 μl of 5.64 × 10⁻² M of
ascorbic acid (95%, Aldrich) was added into one of the colloidal samples which caused its pH to change from 4.6 to 3.2 as measured by a calibrated digital pH meter; addition of ascorbic acid induces particle agglomeration where increment of size is apparent by characteristic shift of colloidal colour.
Both samples were allowed to age for 18 h before 10 ml of each sample was
purified by centrifugation (Sartorius Sigma 2-16K) at 8000 RPM followed by
redispersion into 5 ml of 1.05%w/v of polyethylene glycol (PEG), Mw = 3350. The
resultant colloids were immediately sonicated for 30 min to prevent secondary agglomeration during adhesion of PEG to the particle surface. Optical extinction of both AuNP samples are measured in 1 cm quartz cuvette with spectrophotometry
setup (Avantes) attached to a fibre spectrometer (OceanOptics USB4000) shortly
before characterisation with SAXS.
2.2 SAXS Measurement
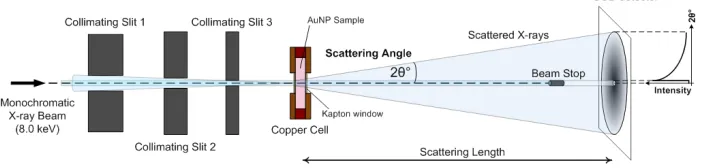
In synchrotron SAXS setup, the samples were exposed to a tightly focused monochromatic soft x-ray beam in vacuum where small fraction of the radiation is elastically scattered in the shape of a cone onto a cooled planar charge coupled device (CCD) detector orthogonal to the incident beam. To avoid exposure
saturation, the central transmitted radiation is filtered with an opaque beam stop as shown in Figure 1, leaving an intensity profile of scattered radiation for analysis.
Our experimental measurements were carried out at beamline 1.3 W Synchrotron Light Research Institute (SLRI), Thailand. Monochromatic soft x-ray beam of
8 keV (ΔE/E = 0.93%) was used throughout the measurements.9 The scattered intensity profiles were obtained with100 μl sample filled into copper cells with x-ray transparent Kapton window.
Figure 1: SLRI SAXS 1.3W beamline overview.
Two sample-detector distances, 1607.47 mm and 4497.21 mm calibrated by
scattering intensity profile of solid styrene ethylene butylene styrene (SEBS),
each sample, 3 sets of data were taken corresponding to empty cell with Kapton window, cell filled with suspending media (i.e., PEG dilution) and the sample itself
for background subtraction. All experimental intensity images were converted to numerical values via circular averaging background-subtraction by homebuilt
SAXSIT software and size distribution was obtained with SASfit V0.93.5. The
size distributions obtained from SAXS are used to compute theoretical extinction
coefficients; the values are then compared with experimental spectrophotometry.
2.3 Mie Extinction Coefficients
Liquid dispersed AuNPs has long been known to exhibit vibrant colours attributed to absorption and scattering of incident light10 due to collective excitation of
surface plasmons.11 Exact solution of Mie Theory quantifies the optical extinction
of colloidal suspensions by solving Maxwell's equations for electromagnetic waves interacting with small conducting spheres taking macroscopic dielectric constant
of the material. The extinction and scattering coefficients, Cext and Csca follow an
expansion series:12
C
ext2
A
2
n
1
Re a
b
n n n 2 1
\
=
+
+
3-
]
g
6 @/
(1)(|
|
|
| )
C
sca2
A
2
n
1
a
b
n n n 2 1 2 2
\
=
+
+
3-
]
g
/
(2)where A is the extinction cross-sectional area, x is a size parameter given by 2πNa/λ; both an and bn are variables dependent on particle size a and N the refractive index of medium chosen as 1.33. Absorption coefficient can thus be obtained by
subtracting scattering term from extinction. Using frequency dependent complex permittivity of gold experimentally found by Johnson and Christy,13 a 200-step extinction coefficient spectra from wavelength of 450 nm to 800 nm was computed
based on 50 bin particle size distribution histogram determined through SAXS.
3. RESULTS AND DISCUSSION
For diluted small scatterers, surface inhomogeneity of nanoclusters require
spatial resolution of detectors as small as 2.5 × 10⁻³ degree. In order to increase
the resolution, the scattering lengths were increased to thousands of millimetres. As a consequence, compensation of longer acquisition time is required to obtain
intensities sufficient for analysis. The scattering image at two lengths for both
counts over 2π with SAXSIT which produce a negative exponential scattered intensity plot against 2θ.
Figure 2: CCD scattered x-ray images (inset) at 4497 mm and 1067 mm used in conversion to scattered intensity plot for (a) undisturbed AuNPs and (b) pH adjusted AuNPs.
At scattering length of 4497.21 mm, the scattered intensity plot shows indistinguishable peak values for both AuNP samples. For shorter scattering length of 1607.47 mm, pH adjusted AuNPs shows lower peak intensity relative to undisturbed colloid indicating extinction due to large particles. The extraction of
size distribution requires intensity profiles converted to scattering vector function,
q given by:
sin
q
4
r
m
i
=
b l
(3)where θ is half the scattering angle and wavelength λ. Averaging vector functions
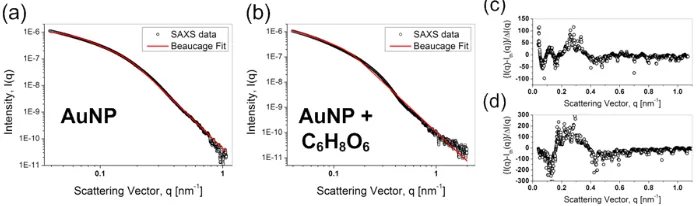
from two scattering lengths for both AuNP samples are shown in Figure 3.
It is found that the length averaged scattering vector functions for both AuNP samples exhibit curve characteristics described by small angle scattering of non-uniform particulates. At lower q region, both samples shows rapid decay edged towards q = 0.3 nm–1 where intensity drops in steep gradient. Considering polydisperse population with mostly spherical geometry, the scattering profile at
low and high q shows transition properties between Guinier and fractal regimes.14 The configuration of scattering vector plots are best fit to phenomenological function described by Beaucage unified exponential-power law where intensity is
given by:15
( )
exp
erf
( / )
/
I q
G
q R
3
B
q R
q
6
g g
p
2 2 3
=
;-
E+
= 6
e@
oG
(4)where constants such as G, B and exponent P are experimentally obtained while Rg is the radius of gyration. The fitting was performed by least square minimisation via SASfit16 shown as red solid lines in Figure 3 (a) and 3 (b). The parameters obtained from best fit have R-value of 0.97 for citrate reduced AuNPs while ascorbic added sample at 0.92. Residuum plots in Figure 3 (c and d) shows general acceptance of
the fitting with slight persistence of disturbance for both samples at q = 0.3 nm–1,
suggesting polydispersity. Following Beaucage et al., a monomodal lognormal size distribution function of the nanoparticles can be expressed as:17
( )
exp
ln
( / )
f R
R
R
2
1
2
2 2v
r
v
n
=
c
6
@
m
(5)where R is the mode of particle radius and both median μ and shape parameter δ can be obtained from equation (4) by fitting scattering vector functions:
exp
R
3
14
5
g 2 2n
d
=
]
g
(6)
/ .
ln
BR
G
12
1 62
g4
d
=
^ h(7)
The term (BRg4/1.62G) in Equation 7 containing the value 1.62 is the scale of
polydispersity index where 1 denotes monodisperse spherical particles. Mean particle diameter, <d> and standard deviation, σ of the nanoparticles can be calculated from the log-normal distribution function by relating μ and δ such as:
exp
exp
exp
2
2 21
v
=
n
]
d
g
6
]
d
g
-
@
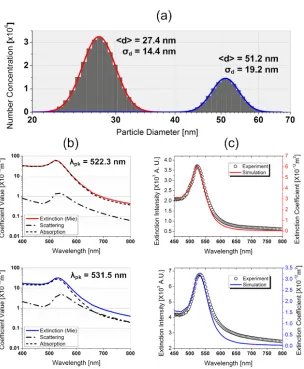
(9)The log-normal distribution curves for both samples illustrated in Figure 4(a) shows comparatively smaller particle sizes in undisturbed AuNPs at mean diameter at 27.4 nm; adding ascorbic acid into the medium pushed the population of particles into larger sizes with mean at 51.2 nm as well as degradation in dispersity indicated by the increase of standard deviation from 14.4 nm to 19.2 nm. Furthermore, the decreasing integral number concentration suggests that the size changes did not involve addition of nucleation sites by ascorbic acid since ascorbic acid was added after initial particle forming phases where well-stabilised AuNPs were already in existence from double action of citrate reduction and capping. Thus, the shift of size distribution can be seen as agglomeration or clumping of the particles.
It is well known that the sizes of citrate reduced and stabilised AuNPs are pH sensitive due to electrostatic interactions of mobile charges on the double layer formed between carboxyl ends of the citrate ions electrostatically attracted to the AuNP core and sodium ions in the immediate vicinity.18 Addingascorbic acid into
the medium rapidly alters the chemical equilibrium established by the counterion species19 and as a result depletes the double layer and the repulsive electrostatic
potential,20 forming agglomerates and thus reduces the total number concentration
of the sample.Although the electrochemical behaviour between dissociates of ascorbic acid and citrate ions lies beyond the scope of this report, the size dynamics
due to agglomeration can be verified by optical extinction especially by peak LSPR
values. Exact solution of Mie extinction using real data from SAXS yield both
scattering and absorption coefficient for a given wavelength where planar white
light was used as a source.
Calculated extinction coefficient spectra show an intense surface plasmon
resonance peak at 522.3 nm for undisturbed gold colloid, this peak redshifted to 531.5 nm accompanied by a decrease of extinction intensity for agglomerated AuNPs. For citrate capped AuNPs, the particle sizes are well within the 1/10λ
regime where incoming light is almost completely absorbed by strong dipole plasmon oscillations.21 The simulated extinction spectrum approximates absorption at the LSPR band and inter-band region and are consistent with the profile experimentally measured by spectophotometry, confirming the size distribution
by SAXS. Increased mean AuNPs sizes induced by ascorbic acid above the
1/10λ approximation limit result in overall increase of scattering coefficient. This
Figure 4: Log-normal particle size distribution, mean diameter and standard deviation obtained from SAXS for (red) undisturbed AuNPs and (blue) pH adjusted AuNPs by ascorbic acid (a); calculated absorption, scattering and extinction coefficient as a function of wavelength based on particle size distribution obtained by SAXS (b); and comparison of extinction profiles around LSPR wavelength with experimental spectrophotometry measurements (c).
Compared to experimentally measured extinction spectra, the LSPR band matches
the simulation profile but poor agreement was found after 550 nm. The matching of peak profile can be attributed to dipole LSPR from primary population of
giving rise to multipole plasmon oscillations that contributes to an increase of
extinction coefficient22 between 570 nm to 750 nm. In addition, the secondary size
distribution of large particles also increases the scattering contribution dominant in
the extinction coefficient at wavelength longer than 600 nm.
4. CONCLUSION
Two samples of citrate reduced colloidal gold were produced via Turkevich-Frens method at citrate to gold ratio of 0.94. Upon addition of ascorbic acid, the AuNPs increased in mean size about twice the diameter with respect to undisturbed particles. The changes of the particle number and size can be explained by agglomeration due to weakening of stabilising electrostatic potential. The size distributions obtained
from SAXS are verified by comparing consequential theoretical optical extinction
with experimentally measured extinction spectra. It is found that for both cases,
the LSPR peak profiles corresponding to major population of the particles matches
considerably. However, the increased deviation towards red-end of the extinction band around 570 nm to 750 nm in agglomerated AuNP sample can be attributed to presence of large non-uniform particles.
5. ACKNOWLEDGEMENTS
The authors would like to express appreciation to the Malaysian Ministry of Higher Education and Research University Grant of Universiti Teknologi Malaysia
(flagship vote 00G79) for the financial support. Also, the authors would like to
thank the management of Siam Photon Source for providing training and beam line service for the experiment.
6. REFERENCES
1. Hong, S. M. & Li, X. (2013). Optimal size of gold nanoparticles for surface-enhanced Raman spectroscopy under different conditions. J. Nanomater., Article ID 790323, https://doi.org/10.1155/2013/790323.
2. Lahr, R. H. & Vikesland, P. J. (2014). Surface-enhanced raman spectroscopy (SERS) cellular imaging of intracellulary biosynthesized gold nanoparticles.
3. Tu, M. H, Sun, T. & Grattan, K. T. V. (2012). Optimization of gold-nanoparticle-based optical fibre surface plasmon resonance (SPR)-based
sensors. Sensor Actuat. B Chem., 164(1), 43–53, https://doi.org/10.1016/j. snb.2012.01.060.
4. Huang, X. H. et al. (2008). Plasmonic photothermal therapy (PPTT) using gold nanoparticles. Lasers Med. Sci., 23, 217–228, https://doi.org/10.1007/ s10103-007-0470-x.
5. Eustis, S. & El-Sayed, M. A. (2006). Why gold nanoparticles are more precious than pretty gold: Noble metal surface plasmon resonance and its enhancement of the radiative and nonradiative properties of nanocrystals of different shapes. Chem. Soc. Rev., 35, 209–217, https://doi.org/10.1039/ B514191E.
6. Maltzahn, G. et al. (2009). SERS-coded gold nanorods as a multifunctional platform for densely multiplexed near-infrared imaging and photothermal heating. Adv. Mater., 21, 3175–3180, https://doi.org/10.1002/ adma.200803464.
7. Turkevich, J., Stevenson, P. C. & Hiller, J. (1951). A study of nucleation and growth processes in the synthesis of colloidal gold. Discuss. Faraday Soc., 11, 55–75, https://doi.org/10.1039/df9511100055.
8. Fren, G. (1973). Controlled nucleation for the regulation of the particle size in monodisperse gold suspensions. Nature, 241, 20–22, https://doi. org/10.1038/physci241020a0.
9. Soontaranon, S. & Rugmai, S. (2012). Small angle x-ray scattering at Siam Photon Laboratory. Chin. J. Phys., 50(2), 204–210.
10. Turkevich, J., Garton, G. & Stevenson, P. C. (1954). The colour of colloidal gold. J. Coll. Sci., 9(1), 26, https://doi.org/10.1016/0095-8522(54)90070-7. 11. Link, S. & El-Sayed, M. A. (1999). Spectral properties and relaxation
dynamics of surface plasmon electronic oscillations in gold and silver nanodots and nanorods. J. Phys. Chem. B, 103, 8410–8426, https://doi. org/10.1021/jp9917648.
12. Kreibig, U. & Vollmer, M. (1995). Optical properties of metal clusters. Berlin: Springer-Verlag Berlin Heidelberg, https://doi.org/10.1007/978-3-662-09109-8.
13. Johnson, P. B. & Christy, R. W. (1972). Optical constants of the noble metals.
Phys. Rev. B, 6, 4370–4375, https://doi.org/10.1103/PhysRevB.6.4370. 14. Bushnell, G. C. et al. (2002). On techniques for the measurement of the mass
fractal dimension of aggregates. Adv. Colloid Interface Sci., 95(1), 1–50, https://doi.org/10.1016/S0001-8686(00)00078-6.
15. Beaucage, G., Kammler, H. K. & Pratsinis, S. E. (2003). Particle size
distributions from small-angle scattering using global scattering functions.
16. Breßler, I., Kohlbrecherb, J. & Thunemanna, A. F. (2015). SASfit: A tool for
small-angle scattering data analysis using a library of analytical expressions.
J. App. Cryst., 48, 1587–1598, https://doi.org/10.1107/s1600576715016544. 17. Forbes, C. et al. (2011). Statistical distributions, 4th ed. New York: John
Wiley & Sons.
18. Kimling, J. et al. (2006). Turkevich method for gold nanoparticle synthesis
revisited. J. Phys. Chem. B, 110(32), 15700–15707, https://doi.org/10.1021/ jp061667w.
19. Khan, Z. et al. (2013). Au(III)–CTAB reduction by ascorbic acid: Preparation
and characterization of gold nanoparticles. Coll. Surf. B Biointerf., 104, 11– 17, https://doi.org/10.1016/j.colsurfb.2012.11.017.
20. Rodríguez-González, B., Mulvaney, P. & Liz-Marzán, L. M. (2007). An electrochemical model for gold colloid formation via citrate reduction. Zeit. Phys. Chem., 221(3), 415–426, https://doi.org/10.1524/zpch.2007.221.3.415. 21. Ungureanu, C. et al. (2009). Discrete dipole approximation simulations of
gold nanorod optical properties: Choice of input parameters and comparison with experiment. J. App. Phys., 105(10), 102032–102037, https://doi. org/10.1063/1.3116139.
22. Yurki, M. A., De Kanter, D. & Hoekstra, A. G. (2010). Accuracy of