Computer simulation study of probe-target hybridization in model DNA
microarrays: Effect of probe surface density and target concentration
Arthi Jayaraman,a兲Carol K. Hall,b兲and Jan Genzer
Department of Chemical and Biomolecular Engineering, North Carolina State University, College of Engineering I, Box 7905, 911 Partners Way, Raleigh, North Carolina 27695, USA
共Received 20 July 2007; accepted 29 August 2007; published online 12 October 2007兲
We use lattice Monte Carlo simulations to study the thermodynamics of hybridization of single-stranded “target” genes in solution with complementary “probe” DNA molecules immobilized on a microarray surface. The target molecules in our system contain 48 segments and the probes tethered on a hard surface contain 8–24 segments. The segments on the probe and target are distinct, with each segment representing a sequence of nucleotides that interacts exclusively with its unique complementary target segment with a single hybridization energy; all other interactions
are zero. We examine how surface density 共number of probes per unit surface area兲 and
concentration of target molecules affect the extent of hybridization. For short probe lengths, as the surface density increases, the probability of binding long stretches of target segments increases at low surface density, reaches a maximum at an intermediate surface density, and then decreases at high surface density. Furthermore, as the surface density increases, the target is less likely to bind completely to one probe; instead, it binds simultaneously to multiple probes. At short probe lengths, as the target concentration increases, the fraction of targets binding completely to the probes
共specificity兲 decreases. At long probe lengths, varying the target concentration does not affect the specificity. At all target concentrations as the probe length increases, the fraction of target molecules bound to the probes by at least one segment 共sensitivity兲 increases while the fraction of target
molecules completely bound to the probes 共specificity兲 decreases. This work provides general
guidelines to maximizing microarray sensitivity and specificity. Our results suggest that the sensitivity and specificity can be maximized by using probes 130–180 nucleotides long at a surface density in the range of 7⫻10−5– 3⫻10−4probe molecules per nm2. ©2007 American Institute of Physics.关DOI:10.1063/1.2787618兴
I. INTRODUCTION
DNA microarrays have been widely adopted by the sci-entific community for a variety of applications:1–4 共1兲 to identify the sequence of genes or gene mutations;共2兲to de-termine the expression level 共abundance兲 of genes; 共3兲 to reconstruct the metabolic pathways for cell operation;共4兲to identify which genes are differentially expressed in healthy
versus diseased cells, enabling disease diagnosis; 共5兲 to
screen for environmental toxins or pathogens based on changes in genetic profiles of exposed organisms; and共6兲to facilitate legal identification.
A DNA microarray, also commonly known as gene chip, DNA chip, or gene array, is a small glass or nylon slide containing thousands of single-stranded genes or gene frag-ments immobilized on the surface in spots arranged in a grid,
with one gene represented per spot.2 Fluorescently labeled
single-strand “target” molecules in a sample solution ex-posed to the microarray surface bind specifically and hybrid-ize to complementary “probe” molecules immobilhybrid-ized on the microarray surface. The binding of the target genes by the appropriate probe molecules is a consequence of the Watson-Crick base-pairing rules. The four different nucleotides that
make up a single-stranded DNA molecule—adenine 共A兲,
thymine共T兲, guanine共G兲, and cytosine共C兲, are compelled to
bind 共pair兲 to their base pair complements. Subsequent
analysis of the pattern of fluorescence on the microarray sur-face allows scientists to identify the genes in the DNA sample solution and to determine their abundance.
Sensitivity and specificity are the two main measures of microarray performance.5–11Sensitivity refers to the hybrid-ization signal-to-noise ratio. A high signal-to-noise ratio in-dicates high sensitivity and, therefore, more efficient detec-tion of the genes under study. Specificity refers to the ability to discriminate between different nucleotide sequences.7The probes should be designed to discriminate between target and nontarget molecules differing by as little as a single nucle-otide. The higher the specificity, the less likely is cross hy-bridization and generation of false positives. Currently the understanding of how to design microarrays for maximal sensitivity and specificity is limited, due in part to the short-age of publicly available data on optimum design. Therefore in order to fully exploit the potential of microarrays, there is a need for a fundamental understanding of the principles that govern the interplay between the various factors that affect microarray performance.
In the past few years investigators have examined the influence of various factors on microarray performance in
a兲Electronic mail: [email protected]
b兲Electronic mail: [email protected]
共 兲
order to optimize sensitivity and specificity.5–13 The factors that influence microarray sensitivity and specificity include the choice of probe molecule sequence, length, and concen-tration; the target molecule sequence, length, and
concentra-tion; and the probe and target nucleotide 共G-C兲
composi-tions, the spacer length, and the temperature. Ramdaset al.9
have evaluated experimentally the effect of oligonucleotide probe length and concentration on signal intensity 共 sensitiv-ity兲 in microarrays. They observed that the signal intensity increased linearly with the length of the oligonucleotide. The signal intensity also increased as the probe concentration in-creased, although the effect of probe concentration on the signal intensity was minimal compared to the effect of probe length. Relogio et al.10 have shown in vitro that while
60-nucleotide 共60-mer兲 long oligonucleotide probes had ten
times the sensitivity of a 25-mer probe, they had much lower
specificity than the 25-mer probes. Chou et al.5 observed
similar results, further suggesting that the addition of spacers could improve the signal intensity of short probes. Peterson
et al.8have used surface plasmon resonance spectroscopy to study the effect of probe density on the kinetics of hybrid-ization. They reported that at low probe densities, almost 100% of the probes hydridize and the kinetics of binding follows Langmuir-like behavior, whereas at high probe den-sities only 10% of the probes hybridize and the kinetics of binding is slow.
Investigators have used computer simulations to gain in-sight into the structure and dynamics of DNA at the molecu-lar level, to interpret experimental data, and to test analytical theories. The level of detail used in the model representing the geometry and energetics of DNA molecules depends on what aspects of DNA behavior one wishes to investigate. Atomic-resolution models provide the most realistic descrip-tion of DNA geometry and energetics. Atomistic simuladescrip-tions of DNA are generally performed using the traditional mo-lecular dynamics共MD兲method. Extensive reviews of the use of molecular dynamics for the simulation of a variety of nucleic acid systems can be found in the literature.14–23 Us-ing atomistic-MD simulations researchers have been able to investigate the stability of experimentally observed standard
structures of single-stranded DNA 共for example, hairpin
structures and quadruplex structures兲,24,25 double-stranded
DNA,15,17,26,27 and other motifs including anomalous
structures.28–34The dynamics of hybridization of DNA teth-ered to a surface and the effect of the surface on the confor-mation of the DNA have also been studied using all-atom MD simulations.35,36 However, it is important to note that all-atom MD simulations usually have an already hybridized double helix form of a DNA as an initial configuration and are used to study the stability of the double helix DNA struc-ture. Although all-atom MD simulations of DNA fragments can be performed on the nanosecond time scale within cur-rent computer capabilities, many of the physical and biologi-cal DNA processes of interest such as replication, transcrip-tion, and denaturation are observed at longer time scales. Also, simulations of large multichain systems of oligonucle-otides with atomic detail are not feasible within the compu-tational power currently available.
In order to simulate the behavior of DNA at longer time
scales within current computational power,
intermediate-resolution and low-resolution models have been
developed.37–59A comprehensive review of these models was presented in our previous publication.60Although these mod-els provide valuable information on the structure and dynam-ics of DNA, they have not, to our knowledge, been used to study hybridization of multiple probes and targets in DNA microarrays.
The goal of our work is to use computer simulations to develop a comprehensive general understanding of the physi-cal principles that govern the hybridization of target DNA molecules to probe DNA molecules in microarrays. We use Monte Carlo simulations of coarse-grained lattice-model DNA molecules on model microarray surfaces to uncover the basic physics underlying the hybridization process. The lat-tice model and the Monte Carlo simulation method give us the advantage of high computational speed. This in turn helps us to better mimic long-time-scale phenomena such as
probe-target hybridization 共approximately minutes兲61 and
makes the study of large system sizes feasible within current computational capabilities. Hopefully our work will lead to a better molecular-level description of the hybridization pro-cess and a set of general guidelines for maximizing microar-ray sensitivity and specificity.
In previous work60 we simulated the hybridization of a
single target molecule with a single complementary probe molecule immobilized on a microarray surface. The target molecule in our system contained 48 statistical segments and the probes tethered on a hard surface contained 8–24 seg-ments. The segments on the probe and target were distinct and each segment represented a sequence of nucleotides. Each probe segment interacted exclusively with its unique complementary target segment with a single hybridization energy; all other interactions were zero. Lattice Monte Carlo simulations were used to examine how the probe length, the hybridization energy 共or equivalently temperature兲, and the stretch along the target that the probe segments are comple-mentary to affect the extent of hybridization. For systems containing single probe and single target molecules, we ob-served that as the probe length increased, the probability of binding all probe segments to the target 共specificity兲 de-creased, and the probability of binding the target by at least one segment 共sensitivity兲 increased. Our result that shorter probes have higher specificity than longer probes is in quali-tative agreement with the experimental work done by
Relo-gio et al.10 and Chou et al.5 As the hybridization energy
increased 共temperature decreased兲, the longer probes were better able to bind all their segments to the target, thus im-proving their specificity. Results on the hybridization kinetics revealed that the segments at the ends of the probe are most likely to start the hybridization and that the segments to-wards the center of the probe remain bound to the target for a longer time than the segments at the ends of the probe. The latter result suggested that the specificity of the probes would be high if the mismatches in the target were in the region complementary to the center portion of the probe, in quali-tative agreement with the experimental results obtained by Letowskiet al.7
study systems containing multiple target molecules in solu-tion and multiple probe molecules tethered to a hard surface. Our model of the target and probe molecules is the same as our previous work.60The target molecule in our system con-tains 48 statistical segments and the probes tethered on a hard surface contains 8–24 segments. We examine how the hybridization of the probe and the target is affected by in-creasing the surface density of probes共number of probes per
unit surface area兲 and increasing the target concentration
共number of target molecules in solution兲. In our simulations we study systems containing 1–256 probes on the
sur-face which corresponds to surface densities of
0.000 0174– 0.0044 molecules/ nm2, and systems containing
1–20 target molecules which correspond to target
concentra-tions of 0.12– 2.40M.
Highlights of our results are the following. As the sur-face density increases, there is a lack of space in the lateral
共x-y兲 direction which makes the probes stretch out and ex-tend in thez direction, due to the crowding on the surface. For longer probes 共16, 20, and 24 segments兲as the surface density increases, the probability of binding long stretches of target segments共specificity兲decreases and the probability of binding short stretches increases. For shorter probes 共8 and 12 segments兲there is an optimum surface density which pro-vides the highest probability of binding all probe segments to the target共specificity兲. The optimum surface density lies
be-tween 0.000 069 4 and 0.000 278 molecules/ nm2while
typi-cal surface densities in microarrays lie in the range 0.000 12– 0.4 probe molecules per nm2 surface area.62,63 Our optimal density is towards the lower end of this range. For all probe lengths, as the surface density increases, the target is less likely to bind completely to one probe, and instead binds simultaneously to more than one probe. This will adversely affect the specificity because when the target simultaneously binds short contiguous stretches of segments to many probes it is harder to detect a mismatch. At the
optimum surface density of 0.000 278 molecules/ nm2 at
short probe lengths, as the target concentration increases the fraction of targets binding completely to the probes 共 speci-ficity兲 decreases. At long probe lengths, varying the target concentration does not affect the specificity. At all target con-centrations, as the probe length increases, the fraction of tar-get molecules bound to the probe by at least one segment
共sensitivity兲increases, while the fraction of target molecules bound to the probe completely共specificity兲decreases.
The remainder of this paper is organized as follows: Sec-tion II describes the molecular model and the simulaSec-tion method. Section III describes our simulation results. A brief summary of our findings is provided in Sec. IV.
II. MODEL AND METHOD
We use lattice Monte Carlo simulation for our study since it is extremely fast and provides a good mimic for large scale conformations of polymer chains. Our system consists of target molecules in an implicit solvent interacting with probe molecules tethered to a hard surface through a spacer. The probe and target are modeled as self-avoiding chains placed on a cubic lattice. The segments on the probe and
target are distinct, i.e., instead of having four types of seg-ments: A, T, G, and C, we have as many types of segments as there are segments along the probe. Each of the segments on
the probe represents a sequence of nucleotides 共⬃11
nucle-otides兲 along the DNA single strand. Each probe segment
recognizes 共preferentially attracts兲its uniquely complemen-tary segment on the target with an attractive interaction po-tential in order to mimic binding of complementary
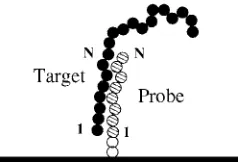
nucle-otide pairs 共A-T and G-C兲 on DNA. A model of the target
and its complementary “end-type” probe is given in Fig. 1.
The first segment on the probe is complementary only to the first segment on the target, the second segment on the probe is complementary only to the second segment on the target, and so on. Our model is similar to the Poland-Scheraga
model for DNA hybridization64,65 where the hybridization
between two complementary strands of DNA of equal length could occur only when bases with the same index along the strands bind. We refer to the attractive interaction potential between the complementary segments as the hybridization
energy, ⑀. The interactions are only between segments that
are nonbonded nearest neighbors on the lattice. All other interactions in the system are zero. The dimensions of the simulation box in the x,y, andz directions are 48, 48, and 80, respectively. There are periodic boundary conditions in the xandy directions; in thezdirection there are hard sur-faces atz= 81 andz= 0. The target contains 48 segments. The probes contain 8–24 segments and are tethered to the surface atz= 0.
The initial configuration of the target is obtained by first placing the “head” segment of the chain on a random loca-tion in the lattice. The second segment is placed on one of the six sites adjacent to the “head” segment. The third seg-ment is placed on a site next to the second segseg-ment, and this is repeated until the target chain is grown to the desired length. During this initialization process, if there is no vacant site for adding a segment onto one end of the chain, the segment is added to the other end of the chain. If adding the segment to either end fails due to the absence of a vacant site, the chain is moved in the box using reptation, kink
jump, end moves, and crankshaft moves66until a vacancy is
created. In the case of the probe, the head segments of the multiple probe molecules are placed equidistant from each other on the surface atz= 1 and the rest of the chain is grown in the same way as the target chain. We do not allow move-ment of the probe along the surface so the position of the
head probe segment is fixed. The other probe segments are moved in the box using a combination of kink jump, end
moves, and crankshaft moves.66
The simulation proceeds in three stages: initialization, equilibration, and production. In the initialization stage the
system runs through 100 000 Monte Carlo 共MC兲 steps. In
each MC step on average each segment along the target and probe is picked randomly and moved using a random com-bination of reptation, end moves, kink jump moves, and
crankshaft moves.66 The moves are accepted or rejected
based on the Metropolis algorithm.67The initialization stage helps us avoid any bias that might arise due to the nature of the initial configuration of the chains. In the equilibration
stage, the system goes through 8⫻106 MC steps, during
which the standard chain moves are made to let the system equilibrate. In the production stage 共an additional 5⫻106
MC steps兲 we obtain data on the property of interest after
each 100 MC steps and calculate the block averages for ev-ery 100 000 MC steps. The equilibrium average for the de-sired property is the mean of all the block averages. We obtain equilibrium averages from 20 simulation trials; error bars are determined from the standard deviations.
To quantify the extent of hybridization, we calculate the probability that a contiguous stretch of target segments binds to the complementary probe segments. When we calculate the probability of binding a contiguous stretch of target seg-ments, we do not break this stretch into smaller stretches and hence overcount the probability of having smaller stretches. For example, for probe length 8, when all eight segments on the probe are bound, we only count that as one occurrence for an eight segment long contiguous stretch being bound, and not as eight occurrences of one segment being bound or as four occurrences of two segment stretches, etc. We count the number of occurrences of the longest stretch of contigu-ous bound segments at every time step during each simula-tion trial. Then, we divide the total number of occurrences of each stretch of contiguous bound segments by the total time steps in the simulation to obtain the probability. We repeat this calculation for ten simulation trials to obtain the average probability that a contiguous stretch of target segments of a given length binds to the complementary probe segments.
To obtain the conformation of the probe molecules, we calculate the average radius of gyration squared parallel
具Rgxy2典 and perpendicular 具Rgz2典 to the surface68,69 which is defined as
具Rgxy
2典 =兺m=1
Nprobes兺 n=1
N 共
xm,n−xm,c.m.兲2+共ym,n−ym,c.m.兲2 共NNprobes兲
,
共1兲
具Rgz
2典 =兺m=1
Nprobes兺 n=1
N 共
zm,n−zm,c.m.兲2 共NNprobes兲
, 共2兲
wherexm,n,ym,n, and zm,n are the coordinates of thenth
seg-ment on the mth probe; xm,c.m., ym,c.m., and zm,c.m. are the coordinates of the center of mass for themth probe;Nprobesis the total number of probes tethered on the surface; andNis the length of each probe.
A. Calculation of surface density
The surface density is a measure of the number of probe molecules tethered per unit surface area. The surface in our simulation is 48 lattice units by 48 lattice units. Each lattice unit,a, is equal to the diameter of a segment. We assume the dimension of each segment to be of the order of magnitude of the persistence length of a single-stranded DNA. The per-sistence length of a single stranded DNA ranges from 0.8 to 5 nm depending on the ionic strength of the solvent
共0.1– 1 mM兲.70,71 We assume the size of the segment to be 5 nm. By using this length we assume that each segment is a stiff section of the DNA and that in turn justifies modeling
the DNA as a self-avoiding walk.72 Since the rise per base
pair for single-stranded DNA is 0.43 nm,71,73 each segment along the probe or target corresponds to approximately 11 nucleotides in a single-stranded DNA molecule.
The area of the surface,A, in our simulation is
A= 48a⫻48a= 48⫻48⫻25 nm2= 57 600 nm2. 共3兲
When one probe molecule is tethered on the surface the sur-face density,, is equal to
= 1
57 600
molecule
nm2 = 1.736⫻10
−5 molecule
nm2 . 共4兲
The approximate surface densities for the different number of probes considered in this paper are tabulated in TableI.
Since the surface area is the same共48 lattice units by 48 lattice units兲 in all our simulations, studying the effect of increasing the number of probes is equivalent to studying the effect of increasing the surface density.
B. Calculation of target concentration
The concentration of the target molecules in the system is equal to the number of moles of target per unit volume
共liters兲of solution. Since we are considering implicit solvent the volume of the solution is approximately equal to the volume of the simulation box.
Volume = 48a⫻48a⫻80a= 13 824 000 nm3. 共5兲
When there is one target molecule in the simulation box, the concentration of target molecules,C, is equal to
TABLE I. Surface density for varying number of probes on the surface.
No. of probes Surface density
共
molecule nm2兲
1 0.000 017 4
4 0.000 069 4
16 0.000 278
36 0.000 625
64 0.001 11
144 0.002 5
C= 1 13 824 000
molecule
nm3 = 7.233⫻10
19 molecule
m3
=7.233⫻10
19
6.023⫻1023 moles
m3 = 0.12M. 共6兲
The approximate target concentrations for different numbers of target molecules considered in this paper are tabulated in TableII.
The order of typical target concentrations in real
mi-croarrays range from 1 nM to 10M.
III. RESULTS AND DISCUSSION
A. Effect of surface density on conformation of probe molecules
As the number of probes increases, the space for the probes to spread in the lateral共x-y兲direction 共due to neigh-boring probes兲decreases. Lack of space in thex-ydirection
forces the probes to stand upright and stretch out in the z
direction. This can be quantified by calculatingRgxy, the
ra-dius of gyration parallel to the surface andRgz, the radius of
gyration perpendicular to the surface. The results for 具Rgxy2典
and for具Rgz2典versus probe length are shown in Figs.2and3
at varying surface density = 0.000 278, 0.000 625,
0.001 11, 0.0025, and 0.0044 probe molecules per nm2 共see
Table I for number of probes兲. It is important to point out that the typical surface density in DNA microarrays lies in
the range 0.000 12– 0.4 probe molecules per nm2 surface
area.62 To obtain a surface density on the high end of this range in our simulations we would need more than 1000 probes. This would make the system, especially near the sur-face, highly dense which in turn would increase the simula-tion time to reach equilibrium. Furthermore, based on the results shown in the next few sections, surface densities
higher than 0.000 278 probe molecules per nm2 had low
specificity and sensitivity. For these reasons, we did not study surface densities higher than 0.0044 probe molecules per nm2.
In Figs.2and3,具Rgxy2典and具Rgz2典scale linearly with the
probe length as it increases from 8 to 24. In Fig. 2 as
increases there is a decrease in具Rgxy2典 for all probe lengths
which means that the space available for each probe in the
x-ydirection共parallel to the surface兲decreases. In Fig.3the
具Rgz
2典
does not change much as increases from
0.000 278 to 0.000625 probe molecules per nm2 for all
probe lengths, but increases dramatically asincreases from
0.001 11 to 0.0025 probe molecules per nm2 for all probe
lengths. This suggests that increasing the number of probes per unit area on the surface past a certain density 共the so called overlap density74兲 forces the probes to extend away from the surface. We can get a rough estimate of the overlap density by calculating the surface area that a single probe occupies when the probes on the surface are just touching each other. The overlap density is then
*=1 molecule 具Rgxy2典a2
, 共7兲
wherea is the size of a lattice unit, which we assume to be equal to 5 nm and 具Rgxy2典is the simulation value of the av-erage radius of gyration squared at the probe length of inter-est in lattice units. The overlap surface density,*, calculated for the different probe lengths is tabulated in TableIII. For probe lengths 20 and 24, the surface density of 0.0025 is higher than the overlap density and therefore we see a big jump in the 具Rgz2典 values as the surface density increases
from 0.001 11 to 0.0025 in Fig.3.
TABLE II. Target concentration for varying number of target molecules in the system.
No. of targets Target concentration共M兲
1 0.12
4 0.48
8 0.96
12 1.44
16 1.92
20 2.40
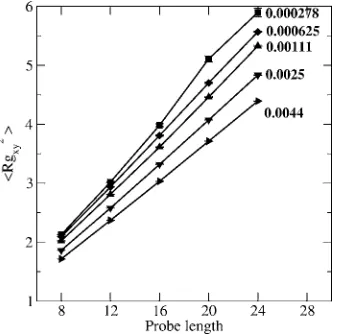
FIG. 2. Rgxy2 vs probe length for 0.000 278共square兲, 0.000 625共diamond兲, 0.00 111共upward triangle兲, 0.0025共downward triangle兲, and 0.0044共 right-sided triangle兲 probe molecules per nm2 on the surface for spacer length
four segments and⑀= 3kT.
FIG. 3. Rgz
2vs probe length for 0.000 278共square兲, 0.000 625共diamond兲,
0.00 111共upward triangle兲, 0.0025共downward triangle兲, and 0.0044共 right-sided triangle兲probe molecules per nm2on the surface for spacer length 4
B. Effect of surface density on extent of hybridization
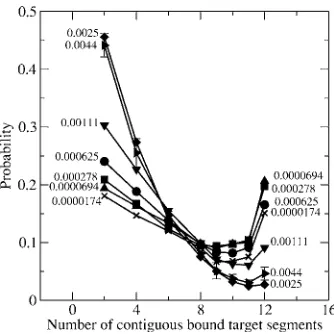
In Fig.4we plot the probability that a contiguous stretch of segments along the target binds to a single end-type probe
共y-axis兲 versus the number of contiguous bound target seg-ments 共x-axis兲 at varying surface densities. The results are
for systems containing a single target molecule 共target
concentration= 0.12M兲and probes of length 12 segments
with spacer length= 4 at ⑀= 3kT. We see that as the surface density increases from 0.000 017 4 to 0.000 069 4 probe molecules per nm2, the probability of binding the target to all the probe segments increases 共right side of Fig. 4兲. This
is because as the surface density increases from
0.000 017 4 to 0.000 069 4 probe molecules per nm2 共one
probe to four probes兲, there are more probes on the surface for the target to bind to, yet there is no crowding due to a low surface density, thus the probability of binding the target to all the probe segments increases. As the surface density
in-creases from 0.000 069 4 to 0.0025 probe molecules per
nm2共4 probes to 144 probes兲, the probability of binding the target to all the probe segments decreases共right side of Fig.
4兲. This is because as the surface density increases the
crowding effect on the surface increases because of the dense brush of probes; the target cannot penetrate the brush of probes on the surface and therefore cannot bind to all seg-ments along any single probe. The only option left for the target is to bind to smaller stretches of probe segments. This is one reason why as the surface density increases, the
prob-ability of binding short stretches of the probe increases 共left side of Fig.4兲. Having a higher surface density共higher num-ber of probes兲by itself also increases the probability of bind-ing short stretches of segments along the target. As the
sur-face density increases from 0.0025 to 0.0044 probe
molecules per nm2the probability of binding the target to all the probe segments remains the same. This is because for surface densities higher than 0.00111 probe molecules per nm2the crowding effects on the hybridization reach a plateau and do not change.
Increasing the surface density also increases the prob-ability that the target simultaneously binds to more than one probe. For example, during the simulation there are times
when the target bindsmsegments to one probe,n segments
to a second probe,p segments to a third probe, and so on. If
m⬎n we call the first probe probe 1 and the second probe
probe 2. If the target simultaneously binds to three probes, then we mark probe 1 as the probe which has the highest number of segments bound to the target, probe 2 as the probe that has the second highest number of segments bound to the target, probe 3 as the probe that has the third highest number of segments bound to the target, etc. We record this through-out the simulation and display the average probability of these events in a contour plot. Thex-axis of the contour plot represents the number of probes the target is bound to
simul-taneously. The y-axis represents the number of contiguous
target segments bound to probe 1 共x= 1兲, probe 2 共x= 2兲, probe 3共x= 3兲, etc. Thez-axis represents the probability of a probe binding to a contiguous stretch of segments along the target.
A contour plot for a system with single target molecule
48 segments long and 0.0025 probe molecules per nm2共144
end-type probes兲 of length 12 with spacer of length 4 and
⑀= 3kT is shown in Fig.5. The abscissax= 1 corresponds to the probe that the target has the highest number of segments bound to 共probe 1兲when the target simultaneously binds to multiple probes. The abscissax= 2 corresponds to the probe
TABLE III. Overlap surface density for varying probe lengths.
Probe length Overlap surface density
共
molecule nm2兲
8 0.005 92
12 0.004
16 0.003 04
20 0.002 24
24 0.001 6
FIG. 4. Probability of a contiguous stretch of segments along target binding to segments along end-type probes of length 12 segments with spacer length= 4 at ⑀= 3kT for 0.000 017 4 共cross兲, 0.000 069 4 共triangle兲, 0.000 278共square兲, 0.000 625共circle兲, 0.001 11共inverted triangle兲, 0.0025 共diamond兲, and 0.0044 共right triangle兲 probe molecules per nm2 surface
area.
FIG. 5. Probability 共contours兲of a contiguous stretch of segments along target 共y-axis兲simultaneously binding to probe 1 共x= 1兲, probe 2 共x= 2兲, probe 3共x= 3兲, and so on, at surface density= 0.0025 molecules/ nm2, probe
that the target has the second highest number of segments bound to 共probe 2兲when the target simultaneously binds to multiple probes. The abscissax= 3 corresponds to the probe that the target has the third highest number of segments bound to, when the target simultaneously binds to multiple probes. Atx= 1, there is a high probability共contour lines 0.3 and 0.4兲 for binding short stretches along the target 共2⬍y
⬍4兲and low probability共contour line 0.1兲for binding long stretches along the target 共6⬍y⬍12兲. At x= 2, there a low, yet nonzero, probability共contour lines 0.1 and 0.2兲for bind-ing short stretches along the target共2⬍y⬍4兲and zero prob-ability for binding long stretches along the target. At x= 3, there is a zero probability共contour line 0.1兲for binding short stretches along the target共2⬍y⬍4兲and zero probability for binding long stretches along the target. Thus, there are times when the target simultaneously binds to approximately two probes. This reduces the specificity of the probes, as simul-taneously binding of the target to more than one probe can easily accommodate a mismatch in the target and give a false positive result.
The data in Fig.4suggest that for a probe of length 12 segments, there is an optimum surface density between
0.000 069 4 probe molecules per nm2 共4 probes兲 and
0.000 278 probe molecules per nm2 共16 probes兲, which
gives high specificity 共high probability of binding all the segments兲. Furthermore, at the optimum surface density si-multaneous binding of the target to more than one probe is also reduced 共specificity is increased兲.
So far, we have presented the results for the effect of surface density on the extent of hybridization for probes of length 12 segments. In the following section we show how probe length affects the dependence of hybridization on sur-face density.
C. How probe length affects the dependence of hybridization on surface density
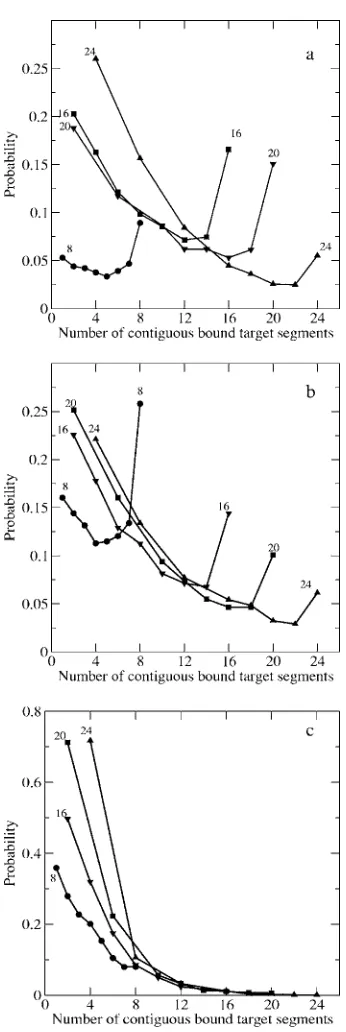
We study how the length of the probe affects the depen-dence of probe-target hybridization on surface density. In Fig.6we plot the probability of a contiguous stretch of seg-ments along the target binding to segseg-ments along end-type probes of length 8, 16, 20, and 24 and spacer length= 4 at ⑀= 3kTat共a兲low surface density共0.000 017 4兲,共b兲 interme-diate surface density共0.000 278兲, and 共c兲 high surface den-sity共0.0025兲 when the system contains a single target mol-ecule.
At low surface density关Fig.6共a兲兴, for probe length 8 the probability of binding all probe segments is higher than the probability of binding shorter stretches. As the probe length increases from 16 segments to 24 segments, the probability of binding all probe segments to complementary segments on the target decreases and the probability of binding shorter stretches along the target increases. At intermediate surface density关Fig.6共b兲兴, as the probe length increases from 8 seg-ments to 24 segseg-ments, the probability of binding all probe segments to complementary segments on the target decreases and the probability of binding shorter stretches along the target increases. At high surface density 关Fig. 6共c兲兴, for all probe lengths the probability of binding all probe segments
to complementary segments on the target is negligible, while the probability of binding shorter stretches along the target increases as the probe length increases.
The effect of increasing surface density is more promi-nent for probe length 8 than for probe lengths 16, 20, and 24. For probe length 8 as the surface density increases from low to intermediate surface density, the probability of binding all lengths of contiguous bound target segments increases. This is because at 0.000 278 probe molecules per nm2共16 probes
on the surface兲 there are more chances for the target
seg-ments to find their complementary probe segseg-ments than
when there is only one probe on the surface. But as the surface density increases from intermediate to high surface density, the probability of binding all lengths of contiguous target segments decreases. This is because at high surface
density, 0.0025 probe molecules per nm2 共number of probes
increases to 144兲, the surface is too crowded with probes and the target is not able to penetrate the brush of probes to bind to all the probe segments.
D. Effect of concentration of target molecules on extent of hybridization
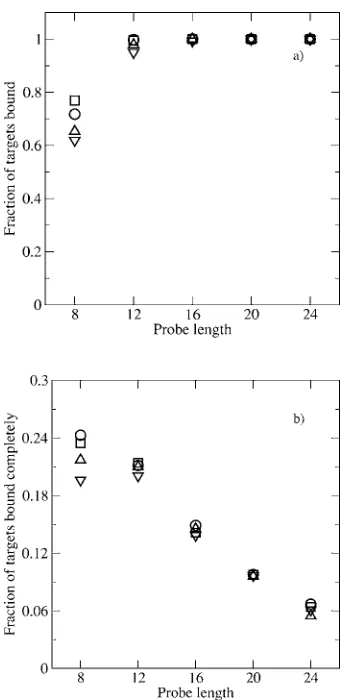
In Fig. 7共a兲 we plot the fraction of target molecules bound to the probes by at least one segment versus probe
length 共8–24 segments兲 at varying concentration of target
molecules 共0.12– 2.40M兲 at probe surface density
0.000 278 probe molecules per nm2共16 probes兲. In Fig.7共b兲 we plot the fraction of target molecules completely bound to
the probes versus probe length 共8–24 segments兲 at varying
concentration of target molecules共0.12– 2.40M兲. The frac-tion of target molecules bound to the probes by at least one segment关Fig.7共a兲兴is a good estimate of sensitivity because sensitivity is measured as the ratio of the number of targets detected to the total number of targets in solution. The
frac-tion of target molecules completely bound to the probe关Fig. 7共b兲兴is a good estimate of the specificity because when the target molecules bind completely to the probes, it is easier to detect mismatches.
The results in Fig.7共a兲show that for all target concen-trations as probe length increases, the fraction of target mol-ecules bound by at least one segment increases and saturates at 1 for probe lengths greater than 12. This implies that at all target concentrations we have considered, longer probe lengths have high sensitivity. This agrees qualitatively with experimental results of Ramdaset al.9who have found signal intensity to increase with length of oligonucleotide probes. The results in Fig. 7共b兲 show that as the probe length in-creases, the fraction of target molecules completely bound
共specificity兲decreases for all target concentrations. The data
in Fig. 7 agree with the results from Relogio et al.10 who
found that 60-mer oligonucleotides have ten times the sensi-tivity of 25-mer oligonucleotides while the specificity of the 60-mer oligonucleotides is much lower than that of the 25-mer oligonucleotides.
At probe lengths 艌12 segments the fraction of targets
bound completely 共specificity兲 is not affected by the target concentration 关Fig.7共b兲兴. Since the number of targets con-sidered here is always less than or equal to the number of complementary probes, each and every target molecule will
bind completely to its complementary probe molecule共
frac-tion of target bound completely= 1兲 if the enthalpic gain
upon probe-target binding can overcome the entropic loss upon binding. At short probe lengths共eight segments兲as the target concentration increases, the fraction of targets bound completely共specificity兲decreases关Fig.7共b兲兴. This could be because at low target concentration共0.12M corresponding to 4 target molecules兲, the total entropic loss upon binding all the targets is overcome by the enthalpic gain upon binding,
while at high target concentration 共2.40M corresponding
to 16 target molecules兲, the enthalpic gain upon binding is not high enough to overcome the entropic loss upon binding.
IV. CONCLUSION
We have used lattice Monte Carlo simulation to study the hybridization of 48 segment targets with end-type probes tethered to the surface. We have examined the effect of in-creasing surface density and inin-creasing target concentration on probe-target hybridization and thus on microarray
perfor-mance. As the number of probes per unit surface area 共or
surface density兲increases, the space between probes in the
x-ydirection decreases due to crowding on the surface; this in turn causes the probes to stretch out and extend in the z
direction. For probes of length 8 and 12 segments, as the surface density increases, the specificity increases at first, reaches a maximum for intermediate surface density, and then decreases for higher surface density. Therefore for probes of length 8 and 12 segments, there is an optimum
surface density between 0.000 069 4 and 0.00 0278
molecules per nm2, which provides the highest specificity. For probes of length 16–24 segments, as the surface density increases, the probability of binding long stretches of target segments共specificity兲decreases and the probability of
ing short stretches increases. Furthermore, as the surface density increases, the target is less likely to bind completely to one probe, instead, it binds simultaneously to multiple probes. This will adversely affect the specificity because when the target simultaneously binds short contiguous stretches of segments to many probes it is harder to detect a mismatch. At short probe lengths, as the target concentration increases the fraction of targets binding completely to the probes共specificity兲decreases. At long probe lengths, varying the target concentration did not affect the specificity. At all target concentrations, as the probe length increases, the frac-tion of target molecules bound to the probes by at least one segment共sensitivity兲increases but the fraction of target
mol-ecules bound completely to the probes 共specificity兲
de-creases. This agrees with the experimental results obtained by Relogioet al.10and Ramdaset al.9
Finally, it is important to point out the model’s limitations—it does not explicitly consider solvent-mediated interactions, electrostatic interactions, or atomistic details such as the bond angles, and torsion angles, stacking inter-actions of DNA molecules. The behavior of the DNA probes and targets has been predicted based mainly on the chainlike nature of target and probe molecules and the interactions between the complementary segments of the probe and the target molecule. With this minimalistic model, this study and our previous study60 provide a fairly broad physical picture of molecular recognition in DNA microarrays and a set of general guidelines for maximizing microarray sensitivity and specificity. The sensitivity and specificity are maximized if microarrays are made of probes 130–180 nucleotides
long60 at a surface density in the range of 0.000 069 4
and 0.000 278 probe molecules per nm2. In real
micro-arrays typical surface densities are in the range
0.000 12– 0.4 probe molecules per nm2 surface area.62 At
surface densities higher than 0.000 278 probe molecules
per nm2 surface area we predict the specificity to be low
because the probes are more likely to bind to short stretches of the target molecule.
ACKNOWLEDGMENTS
We gratefully acknowledge useful discussions with Dr. Nancy Klauber-DeMore, Dr. B. Montgomery Pettitt, Dr. Er-dogan Gulari, and Dr. Matthew Johnson. This work was sup-ported by the Office of Energy Research, Basic Sciences, Chemical Science Division of the U. S. Department of
En-ergy 共DE-FG05-91ER14181兲 and National Science
Founda-tion共CTS-0625888兲.
1U. Alon, N. Barkai, D. A. Notterman, K. Gish, S. Ybarra, D. Mack, and
A. J. Levine, Proc. Natl. Acad. Sci. U.S.A. 96, 9212共1999兲.
2D. Amaratunga and J. Cabrera,Exploration and Analysis of DNA
Mi-croarray and Protein Array Data, Wiley Series in Probability and Statis-tics共Wiley-Interscience, New York, 2004兲.
3J. C. Barrett and E. S. Kawasaki, Drug Discovery Today 8, 134共2003兲. 4C. A. Cummings and D. A. Relman, Emerg. Infect. Dis. 6, 513共2000兲. 5C. C. Chou, C. H. Chen, T. T. Lee, and K. Peck, Nucleic Acids Res. 32,
99共E兲 共2004兲.
6M. D. Kane, T. A. Jatkoe, C. R. Stumpf, J. Lu, J. D. Thomas, and S. J.
Madore, Nucleic Acids Res. 28, 4552共2000兲.
7J. Letowski, R. Brousseau, and L. Masson, J. Offshore Mech. Arct. Eng.
57, 269共2004兲.
8A. W. Peterson, R. J. Heaton, and R. Georgiadis, Nucleic Acids Res. 29,
5163共2001兲.
9L. Ramdas, D. E. Cogdell, J. Y. Jia, E. E. Taylor, V. R. Dunmire, L. Hu,
S. R. Hamilton, and W. Zhang, BMC Genomics 5, 35共2004兲.
10A. Relogio, C. Schwager, A. Richter, W. Ansorge, and J. Valcarcel,
Nucleic Acids Res. 30, 51共E兲 共2002兲.
11H. Urakawa, S. E. Fantroussi, H. Smidt, J. C. Smoot, E. H. Tribou, J. J.
Kelly, and D. A. Stahl, Appl. Environ. Microbiol. 69, 2848共2003兲.
12A. Schultze and J. Downward, Nat. Cell Biol. 3, 190共E兲 共2001兲. 13A. Vainrub and M. B. Pettitt, J. Am. Chem. Soc. 125, 7798共2003兲. 14P. Auffinger and E. Westhof, Curr. Opin. Struct. Biol. 8, 227共1998兲. 15D. L. Beveridge and K. J. McConnell, Curr. Opin. Struct. Biol. 10, 182
共2000兲.
16T. E. I. Cheatham, Curr. Opin. Struct. Biol. 14, 360共2004兲.
17T. E. I. Cheatham and P. A. Kollman, Annu. Rev. Phys. Chem. 51, 435
共2000兲.
18T. E. I. Cheatham and M. A. Young, Biopolymers 56, 232共2001兲. 19E. Giudice and R. Lavery, Acc. Chem. Res. 35, 350共2002兲. 20I. Lafontaine and R. Lavery, Curr. Opin. Struct. Biol. 9, 170共1999兲. 21J. Norberg and L. Nilsson, Acc. Chem. Res. 35, 465共2002兲. 22W. K. Olson, Curr. Opin. Struct. Biol. 6, 242共1996兲.
23M. Orozco, M. Perez, A. Noya, and F. J. Luque, Chem. Soc. Rev.32, 350
共2003兲.
24J. Isaksson, S. Acharya, J. Barman, P. Cheruku, and J. Chattopadhyaya,
Biochemistry 43, 15996共2004兲.
25S. Sen and L. Nilsson, J. Am. Chem. Soc. 123, 7414共2001兲. 26M. Feig and M. B. Pettitt, J. Phys. Chem. B 101, 7361共1997兲. 27G. L. Seibel, U. C. Singh, and P. A. Kollman, Proc. Natl. Acad. Sci.
U.S.A. 82, 6537共1985兲.
28J. Luo and T. C. Bruice, J. Am. Chem. Soc. 120, 1115共1998兲. 29K. Miaskiewicz, J. Miller, M. Cooney, and R. Osman, J. Am. Chem. Soc.
118, 9156共1996兲.
30G. C. Shields, C. A. Laughton, and M. Orozco, J. Am. Chem. Soc. 119,
7463共1997兲.
31N. Spackova, I. Berger, and J. Sponer, J. Am. Chem. Soc. 121, 5519
共1999兲.
32N. Spackova, I. Berger, and J. Sponer, J. Am. Chem. Soc. 123, 3295
共2001兲.
33T. I. Spector, T. E. I. Cheatham, and P. A. Kollman, J. Am. Chem. Soc.
119, 7095共1997兲.
34S. Weerasinghe, P. E. Smith, V. Mohan, Y. K. Cheng, and M. B. Pettitt, J.
Am. Chem. Soc. 117, 2147共1995兲.
35K.-Y. Wong and M. B. Pettitt, Theor. Chem. Acc. 106, 233共2001兲. 36K.-Y. Wong and M. B. Pettitt, Biopolymers 73, 570共2004兲.
37J. L. F. Abascal and J. C. G. Montoro, J. Chem. Phys. 114, 4277共2001兲. 38E. Allahyarov, G. Gompper, and H. Lowen, Phys. Rev. E 69, 041904
共2004兲.
39E. Allahyarov, H. Lowen, and G. Gompper, Phys. Rev. E 68, 061903
共2003兲.
40A. Balaeff, A. Mahadevan, and K. Schulten, Phys. Rev. Lett. 83, 4900
共1999兲.
41C. Bouchiat and M. Mezard, Phys. Rev. Lett. 80, 1556共1994兲. 42E. Carlon, E. Orlandini, and A. L. Stella, Phys. Rev. Lett. 88, 198101
共2002兲.
43M. S. Causo, C. Barbara, and P. Grasberger, Phys. Rev. E 62, 3958
共2000兲.
44G. Chirico and J. Langowski, Biopolymers 34, 415共1994兲. 45K. Drukker and G. C. Schatz, J. Phys. Chem. B 104, 6108共2000兲. 46K. Drukker, G. Wu, and G. C. Schatz, J. Chem. Phys. 114, 579共2001兲. 47P. Etchegoin and R. C. Maher, Physica A 323, 551共2003兲.
48M. L. Huertas, S. Navarro, M. C. L. Martinez, and J. G. de la Torre,
Biophys. J. 73, 3142共1997兲.
49A. P. Lyubartsev and L. Nordenskiold, J. Phys. Chem. 101, 4335共1997兲. 50J. F. Marko, Phys. Rev. E 57, 2134共1998兲.
51J. F. Marko and E. D. Siggia, Phys. Rev. E 52, 2912共1995兲. 52J. F. Marko and E. D. Siggia, Macromolecules 28, 8759共1995兲. 53B. Mergell, M. R. Ejtehadi, and R. Everaers, Phys. Rev. E 68, 021911
共2003兲.
54J. C. G. Montoro and J. L. F. Abascal, J. Chem. Phys. 103, 8273共1995兲. 55J. C. G. Montoro and J. L. F. Abascal, J. Chem. Phys. 109, 6200共1998兲. 56T. Schlick and W. K. Olson, J. Mol. Biol. 223, 1089共1992兲.
57H. L. Tepper and G. A. Voth, J. Chem. Phys. 122, 124906共2005兲. 58
59F. Zhang and M. A. Collins, Phys. Rev. E 52, 4217共1995兲.
60A. Jayaraman, C. K. Hall, and J. Genzer, Biophys. J. 91, 2227共2006兲. 61J. Fritz, E. B. Cooper, S. Gaudet, P. K. Sorger, and S. R. Manalis, Proc.
Natl. Acad. Sci. U.S.A. 99, 14142共2002兲.
62A. Halperin, A. Buhot, and E. B. Zhulina, J. Phys.: Condens. Matter 18,
S463共2006兲.
63A. W. Peterson, R. J. Heaton, and R. Georgiadis, J. Am. Chem. Soc.122,
7837共2000兲.
64T. Garel and H. Orland, Biopolymers 75, 453共2004兲.
65D. Poland and H. A. Scheraga, Theory of Helix-Coil Transition in
Biopolymers共Academic, New York, 1970兲.
66P. H. Verdier and W. H. Stockmayer, J. Chem. Phys. 36, 227共1962兲. 67N. Metropolis, A. W. Rosenbluth, M. N. Rosenbluth, A. H. Teller, and E.
Teller, J. Chem. Phys. 21, 1087共1953兲.
68P.-Y. Lai, J. Chem. Phys. 103, 5742共1995兲.
69Z. Z. Lin, W. Wang, C. Ebner, and Y. Nikas, Phys. Rev. E 48, 1246
共1993兲.
70B. Tinland, A. Pluen, J. Sturm, and G. Weill, Macromolecules 30, 5763
共1997兲.
71M. C. Williams, J. R. Wenner, I. Rouzina, and V. A. Bloomfield, Biophys.
J. 80, 874共2001兲.
72M. F. Hagan and A. K. Chakraborty, J. Chem. Phys. 120, 4958共2004兲. 73D. Voet and J. G. Voet,Biochemistry共Wiley, Canada, 1995兲.
74A. Kopf, J. Baschnagel, J. Wittmer, and K. Binder, Macromolecules 29,