ABSTRACT
FINDLEY, DANIEL JONATHAN. A Comprehensive Two-Lane, Rural Road Horizontal Curve Study Procedure. (Under the direction of Joseph E. Hummer and William Rasdorf.)
Horizontal curves are relatively dangerous features, with collision rates typically three times that of comparable tangent sections on average. To help make these segments safer, this research developed a comprehensive study procedure for rural, two-lane horizontal curves. To provide the basis for a comprehensive procedure, this research includes an examination of curve crash characteristics, an investigation of study methods for geometric characteristics, and recommendations for potential countermeasures. A complete and accurate data set on a horizontal curve is important for a transportation agency to make a well-informed decision on possible improvements that could enhance the safety of the roadway. However, many agencies do not know curve radii or lengths because drawings do not exist and inventories are not available.
methods for curve safety analysis. This research developed a CMF to account for the effect of nearby curves on safety that can supplement HSM procedures.
Several contributions to the practice of transportation engineering have resulted from this research. This research presents a new horizontal curve study method procedure to ensure a systematic approach for identifying curves, studying and measuring their characteristics, and improving hazardous locations. This research quantifies the collision characteristics of horizontal curves and created a linking of common horizontal curve collision types and effective countermeasures, which provides an engineer with the necessary information to identify and correct hazardous curves. This research recommends study methods for geometric characteristics which allows an engineer to most effectively and efficiently measure, define, and analyze horizontal curves to determine their predicted safety performance. The focus of these study methods is office procedures for collecting horizontal curve data, which are generally more efficient than field methods. This research establishes a set of parameters to which safety can be related through spatial and geometrical features. Safety was related geometrically through the establishment of guidance for horizontal curves for the implementation of the nationally accepted prediction model for roadways, presented in the Highway Safety Manual. Safety was related spatially through the impact of spatial relationships on horizontal curve safety using the predictive methodology of the Highway Safety Manual as a foundation for incorporating spatial considerations into horizontal curve safety prediction.
© Copyright 2011 by Daniel Jonathan Findley
A Comprehensive Two-Lane, Rural Road Horizontal Curve Study Procedure
by
Daniel Jonathan Findley
A dissertation submitted to the Graduate Faculty of North Carolina State University
in partial fulfillment of the requirements for the Degree of
Doctor of Philosophy
Civil Engineering
Raleigh, North Carolina 2011
APPROVED BY:
________________________________ ________________________________ Dr. Joseph Hummer, Co-Chair Dr. William Rasdorf, Co-Chair
________________________________ ________________________________
ii
D
EDICATIONThis dissertation is dedicated to my family and the educators I have had the privilege of learning from throughout my life. My entire family has supported me in all of my academic aspirations, for which I am eternally grateful.
To my wife, Rachel, who provided unwavering support throughout my graduate education and the initial encouragement to start this endeavor.
To my daughter, Sophia, who provided inspiration and an often needed diversion from my studies.
To my parents, Frank and Jan, who provided immeasurable experiences and guidance that instilled a passion for learning and exploration.
To my grandmothers, Jane and Barbara, whose kindness and praise always encouraged me and my grandfathers, whose academic and professional accomplishments have inspired me.
iii
B
IOGRAPHYiv
A
CKNOWLEDGEMENTSI would like to acknowledge the help and support of numerous individuals who assisted in the completion of my research. Dr. Joseph Hummer and Dr. William Rasdorf served as co-chairs for my committee and were instrumental in supporting and guiding my research efforts. The experience through this research in the realm of highway design and highway safety have been immense and allowed for my growth as a transportation professional. Dr. Nagui Rouphail and Dr. Hugh Devine were committee members and also provided meaningful feedback on my research. I appreciate the time and effort each of my committee members have demonstrated. I’m truly grateful for my experience as a student at NC State, where I have the opportunity to work closely with some of the top transportation researchers in the United States. I would also like to express my sincere gratitude for the opportunity to work with and learn from Charles Zegeer at the UNC Highway Safety Research Center.
I am appreciative for the support I have had at the Institute of Transportation Research and Education (ITRE) from my colleagues and supervisors. My supervisor, Robert Foyle, has provided me with valuable experience which was important for my growth as an engineer and researcher. I would also like to thank Christopher Cunningham and Dr. Bastian Schroeder for their collaboration on many research projects which has enabled me to gain much appreciated experience.
v
TABLE OF CONTENTS
List of Tables ... xi
List of Figures ... xiii
1.0 Introduction ... 1
1.1 Step 1: Site Identification ... 2
1.2 Step 2: Office Data Acquisition ... 3
1.3 Step 3: Collision Data Analysis ... 3
1.4 Step 4: Curve Characteristics Analysis ... 4
1.5 Step 5: Collision Data and Curve Characteristics Findings ... 5
1.6 Step 6: Field Data Acquisition and Confirmation ... 5
1.7 Step 7: Recommendations ... 5
1.8 Research Objectives ... 6
1.9 Significance of the Research ... 7
1.10 Research Scope and Limitations ... 8
1.11 Dissertation Organization... 9
2.0 Literature Review ... 10
2.1 Introduction ... 10
2.2 Collision Characteristics and Geometric Design Features ... 11
2.3 Horizontal Curve Study Methods ... 14
2.3.1 Ball-Bank Indicator Method ... 14
2.3.2 Compass Method ... 15
2.3.3 Direct Method ... 15
vi
2.3.5 Yaw Rate Transducer Method ... 16
2.3.6 GPS Method ... 16
2.3.7 Mobile Vehicle Method ... 17
2.3.8 Study Method Comparison ... 20
2.4 Highway Safety Manual Analysis ... 20
2.5 Crash Modification Factor Clearinghouse ... 23
2.6 GIS and Remote-Sensing Procedures ... 25
2.7 General Guides for TCDs for Horizontal Curves ... 28
2.8 TCDs Effects on Horizontal Curves ... 29
2.8.1 TCD Application and Safety Effects for Horizontal Curves ... 30
2.8.2 Modeling for Determining Hazardous Curve Category ... 33
2.9 Spatial Relationships ... 34
2.10 Summary ... 40
3.0 Curve Crash Characteristics ... 42
3.1 Introduction ... 42
3.2 Methodology ... 43
3.3 Collision Data Analysis ... 45
3.3.1 Road Characteristics ... 45
3.3.2 Collision Characteristics ... 47
3.4 Results ... 60
3.5 Conclusions ... 63
4.0 Manual Field Investigation Procedure ... 64
vii
5.1 Introduction ... 65
5.1.1 Scope ... 66
5.1.2 Objective ... 66
5.2 Methodology ... 67
5.2.1 Field Method ... 69
5.2.2 Curve Calculator ... 71
5.2.3 Curvature Extension... 72
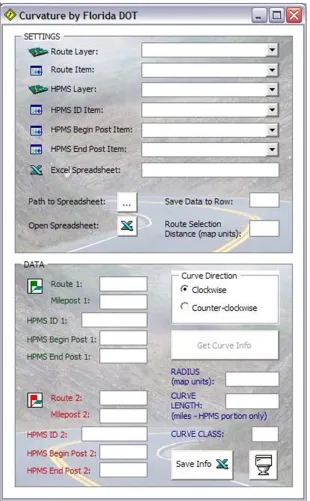
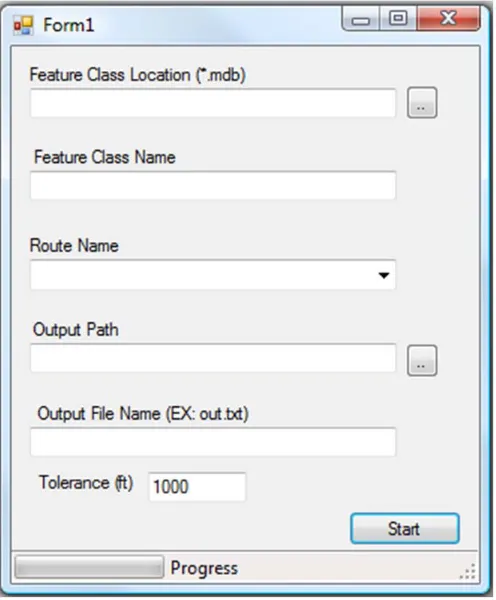
5.2.4 Curve Finder ... 73
5.3 Analysis ... 75
5.3.1 GIS-Derived Curve Analysis ... 76
5.3.2 Field Measured Curve Analysis ... 78
5.3.3 Safety Analysis ... 85
5.4 Results ... 87
5.5 Conclusions ... 88
6.0 Network Curve Analysis GIS Process ... 92
6.1 Introduction ... 92
6.2 Methodology ... 93
6.2.1 Curve Identification ... 94
6.2.2 Geometric Characterization ... 95
6.2.3 Collision Data ... 95
6.3 Analysis ... 96
6.3.1 Curve Finder Tolerance Sensitivity Analysis ... 96
viii
6.3.3 Hazardous Curve Analysis ... 104
6.3.4 Safety Analysis ... 105
6.4 Results ... 108
6.5 Conclusions ... 109
7.0 Mobile Vehicle Comparison ... 112
7.1 Introduction ... 112
7.2 Methodology ... 113
7.2.1 Chord Method ... 116
7.2.2 GIS Method ... 117
7.2.3 Vendor Data ... 120
7.2.4 Survey Data ... 120
7.2.5 Design Data ... 122
7.2.6 Comparison ... 122
7.3 Results ... 124
7.4 Conclusions ... 132
8.0 Highway Safety Manual Analysis ... 135
8.1 Introduction ... 135
8.2 Methodology ... 138
8.2.1 HSM predictive method calibration ... 138
8.2.2 Step 9: Select and apply SPF ... 139
8.2.3 Step 10: Apply the appropriate CMFs to SPF to account for the difference in base and site specific conditions ... 139
8.2.4 Step 11: Apply a calibration factor to the result of Step 10 ... 140
ix
8.3 Analysis ... 143
8.3.1 Calibration Factor Analysis ... 143
8.3.2 Sensitivity Analysis ... 146
8.3.3 Calibration Factor Validation ... 151
8.4 Conclusions ... 152
9.0 Spatial Relationships ... 153
9.1 Introduction ... 153
9.2 Methodology ... 154
9.2.1 Horizontal Curve Data Collection ... 155
9.2.2 HSM Safety Prediction ... 156
9.2.3 Spatial Relationship Analysis ... 158
9.3 Results ... 162
9.3.1 Model Selection ... 163
9.3.2 Model Validation ... 167
9.4 Conclusions ... 168
10.0 Comprehenisve Process ... 171
10.1 Introduction ... 171
10.2 Methodology ... 173
10.2.1 Step 1: Site Identification ... 175
10.2.2 Step 2: Office Data Acquisition ... 175
10.2.3 Step 3: Collision Data Analysis ... 178
10.2.4 Step 4: Curve Characteristics Analysis ... 180
x
10.2.6 Step 6: Field Data Acquisition and Confirmation ... 181
10.2.7 Step 7: Develop Recommendations ... 182
10.3 Case Studies ... 184
10.3.1 Case Study Site # 1 – Agency Safety Improvement Program Curve ... 184
10.3.2 Case Study Site # 2 – Collision History and Geometric Deficiencies ... 187
10.3.3 Case Study Site # 3 – Not A High Priority Site for Improvements ... 189
11.0 Recommendations ... 192
11.1 Curve Crash Characteristics ... 193
11.2 Highway Safety Manual Analysis ... 193
11.3 Spatial Relationships ... 194
11.4 Individual Curve Analysis GIS Process ... 195
11.5 Network Curve Analysis GIS Process ... 196
11.6 Mobile Vehicle Horizontal Curve Data Collection ... 197
11.7 Horizontal Curve Procedure ... 198
12.0 References ... 200
Appendix ... 217
xi
LIST OF TABLES
Table 1. Horizontal Curve Collision Geometric Roadway Characteristics ... 46
Table 2. Horizontal Curve Collision Urban vs Rural Characteristics ... 46
Table 3. Horizontal Curve Collision Severity Characteristics ... 48
Table 4. Rural Horizontal Curve Collision Frequency Characteristics ... 50
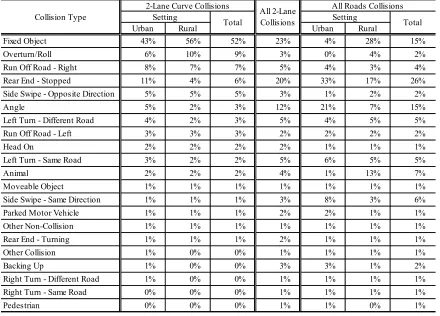
Table 5. Horizontal Curve Collision Type Characteristics (Most Harmful Event) ... 52
Table 6. Horizontal Curve Collision Most Harmful Event Characteristics ... 54
Table 7. Horizontal Curve Collision Roadway Surface Characteristics ... 60
Table 8. Potential Countermeasures to Reduce the Frequency and/or Severity of Horizontal Curve Collisions... 62
Table 9. Radius in Meters (feet) Comparison of GIS Methods ... 77
Table 10. Sensitivity Analysis for 304.8 Meter (1,000’) Radius and 152.4 Meter (500’) Length Curve ... 78
Table 11. Curve Radius: Field Measured vs GIS Calculated ... 80
Table 12. Curve Radius Differences from Field Measured Values ... 81
Table 13. Correlation Coefficients and P-values for Radius Values ... 82
Table 14. Curve Length: Field Measured vs GIS Calculated ... 83
Table 15. Curve Length Differences from Field Measured Length Values ... 84
Table 16. Correlation Coefficients and P-values for Length Values ... 84
Table 17. Safety Ranking of Top 10 Most Hazardous Field Measured vs GIS Calculated Curves ... 86
Table 18. Spearman Correlation Coefficients for Safety Rankings ... 87
Table 19. Radius Differences with Descriptive Parameters ... 101
Table 20. Length Differences with Descriptive Parameters ... 103
Table 21. Radius Differences with Descriptive Parameters ... 105
Table 22. Length Differences with Descriptive Parameters ... 105
xii
Table 24. Radius Inaccuracies from Locational Errors at Horizontal Curves ... 115
Table 25. Radius Comparison of All Techniques ... 126
Table 26. Length Comparison of All Techniques ... 129
Table 27. Comparison of Radius and Length Values for Vendor and Chord Method Data . 131 Table 28. Comparison of Range of Radius and Length Values ... 132
Table 29. Field Data Collection Elements ... 142
Table 30. HSM Calibration Factors Calculated ... 145
Table 31. Annual Calibration Factors (All Segments, Random Segments, Non-Random Segments) ... 146
Table 32. Input Values for HSM (Minimum, Maximum, Average, and Median) ... 147
Table 33. Output Values from HSM (Predicted Collisions Per Year) ... 148
Table 34. Predicted Collisions (over 5 years) for Two-Lane Road Horizontal Curves ... 150
Table 35. Variables of the Model ... 165
Table 36. Model Predicted Collisions (collisions per year) by Adjacent Curve Distance ... 167
Table 37. Case Study Site # 1 Comprehensive Study Procedure Summary ... 187
Table 38. Case Study Site # 2 Comprehensive Study Procedure Summary ... 189
xiii
LIST OF FIGURES
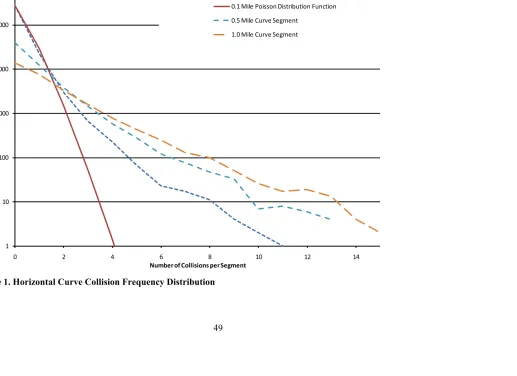
Figure 1. Horizontal Curve Collision Frequency Distribution ... 49
Figure 2. Horizontal Curve Collision Time of Day Characteristics ... 57
Figure 3. Horizontal Curve Collision Day of Week Characteristics ... 58
Figure 4. Horizontal Curve Collision Month of Year Characteristics ... 59
Figure 5. GIS Line Work – Horizontal Curve with 7 Points [ESRI 2009] ... 68
Figure 6. GIS Line Work – Horizontal Curve with 3 Points [ESRI 2009] ... 69
Figure 7. Horizontal Curve Layout [Findley and Foyle 2009] ... 70
Figure 8. Curve Calculator User Input Screen ... 71
Figure 9. Curvature Extension User Input Screen ... 73
Figure 10. Curve Finder User Input Screen ... 74
Figure 11. Tolerance Example ... 75
Figure 12. Example of Manual Horizontal Curve Identification ... 94
Figure 13. Percentage of Curves Reported and Matched by Curve Finder Tolerance – NC96 & NC42 ... 97
Figure 14. Percentage of Curves Reported and Matched by Curve Finder Tolerance – I40 .. 98
Figure 15. Curve Finder Error Quotient Diagram ... 100
Figure 16. Radii Differences Between Curve Finder and Curvature Extension ... 102
Figure 17. Length Differences Between Curve Finder and Curvature Extension ... 104
Figure 18. Curve Influence Area (0.1, 0.2, and 0.5 miles) ... 108
Figure 19. Horizontal Curve Layout with PT Offset Error ... 116
Figure 20. Curve Radius (Macroscopic and Microscopic) Using Curvature Extension ... 118
Figure 21. Roadway Curvature Data (Chord, GIS, Vendor, and Survey) ... 123
Figure 22. Aerial Visualization of Roadway Curvature from Various Methods (Geofiny 2007) ... 124
Figure 23. Radius Comparison of Vendor Data... 127
Figure 24. Length Comparison of Vendor Data ... 130
xiv
Figure 26. Spatial Curve Example Layout ... 161
Figure 27. Validation of Model with Difference in Collisions from Reported Collisions ... 168
Figure 28. Comprehensive Curve Safety Study Procedure ... 174
Figure 29. Case Study Site #1 ... 186
Figure 30. Case Study Site #2 ... 188
1 1.0 INTRODUCTION
Horizontal curves, providing the transition between straight roadway segments, are particularly hazardous locations which deserve attention from researchers and transportation agencies. The collision rate for horizontal curves is approximately three times greater than straight (also known as tangent) section collision rates (Torbic 2004). Fatal collisions on horizontal curves comprise approximately 25% of all fatal collisions. The majority (76%) of fatal horizontal curve collisions occur from a single vehicle leaving the roadway and either striking a fixed object or overturning. In a study of collisions in North Carolina, Hummer et al (2011) found that 1.9% of two-lane road curve collisions are fatal, which was more than three times the fatal rate of collisions on all roads statewide (0.6%). The prevalence of collisions involving vehicles leaving the roadway makes horizontal curves a key focus for transportation agency improvements because these types of collisions have numerous countermeasures, or types of improvements, for collision reduction.
A complete understanding of horizontal curves is critical to enable an agency to systematically and efficiently improve the safety performance of its roads. A comprehensive safety study procedure for horizontal curves on rural, two-lane roadways was developed through this research as an improvement to existing safety procedures. Current agency practices for identifying hazardous locations focus on collision history, which could lead to inefficiently selecting and funding sites for improvements. Many collisions occur at random locations that are unlikely to be improved by engineering practices, such as those primarily caused by driver inattention or intoxication (although other broader practices in education, enforcement, or emergency response could reduce the occurrence or severity of collisions).
2
providing an opportunity to review rural sites that might not otherwise be considered for improvements. This research will show that a comprehensive, proactive safety process for rural, two-lane curves is feasible and furthermore, that it is possible to conduct a significant amount of work before a field visit is necessary, if a field visit is even necessary to complete the process.
For a complete understanding of horizontal curves and their potential for improvement, the proposed curve study procedure consists of the following seven steps, as detailed in the following sections:
1. Site identification 2. Office data acquisition 3. Collision data analysis
4. Curve characteristics analysis
5. Collision data and curve characteristics findings 6. Field data acquisition and confirmation
7. Recommendations 1.1 Step 1: Site Identification
3 1.2 Step 2: Office Data Acquisition
Office techniques for data acquisition (Step 2) can involve collecting information by examining plans, collision history, GIS data, lidar data, satellite photographs, online mapping programs, video or photo logs, or asset inventories. Important elements to collect during this step include curve geometric features, spatial relationships with other roadway elements, the number, type, and location of signs, markings, and driveways, and other relevant factors. New techniques and technologies allow horizontal curves to be studied, at least preliminary investigations, remotely from an office. The use of office study techniques can greatly increase the efficiency of a transportation agency by avoiding resource intensive data collection visits to sites, thereby saving time, preserving equipment, and avoiding staff exposure to traffic. Many states maintain GIS data of their roadway system, which can allow office study techniques to leverage this existing resource to provide horizontal curve data while avoiding the pitfalls of field data collection.
1.3 Step 3: Collision Data Analysis
Police reports supply the necessary information to conduct a collision analysis (Step 3) of the curve. The objective of the collision data analysis is to determine if there is an overrepresentation of collisions at the curve. The Highway Safety Manual (HSM) is an invaluable tool with which to conduct a collision data analysis on a curve (AASHTO 2010). The HSM presents a model to predict the safety of a two-lane horizontal curve based on its characteristics, including: traffic volume, lane width, shoulder width, length, radius, superelevation, grade, driveway density, roadside hazard rating, spiral transition, passing lanes, roadway lighting, centerline rumble strips, two-way left-turn lanes, and automated speed enforcement. An overrepresentation of collisions at a curve signifies a potential curve of interest for improvements, particularly if the collisions appear to be correctable with available countermeasures.
4
collision data is thought to be unreliable, agencies should analyze the roadway section with the HSM to generate a collision prediction and compare the result to other sites or to a standard collision frequency (that could vary by geographic location, site type, etc.), 2) when reliable reported collision data are available, a comparison can be made to the number of collisions predicted by the HSM model for the specific location, and 3) when reliable reported collision data are available, it is possible to employ a Bayesian process which combines the predictive capabilities of the HSM with observed collisions, where the resulting value can then be compared to a standardized value for similar locations. A safety analysis which found an over-representation of collisions on a curve could signify a potential deficiency (geometric, signage, pavement condition, truck restrictions, drainage, etc.) that could be addressed by an appropriate countermeasure.
1.4 Step 4: Curve Characteristics Analysis
The analysis of a horizontal curve (Step 4) should include an examination of both its characteristics and its geometric features. An analysis and evaluation of a horizontal curve’s characteristics could focus on identifying potential deficiencies through an examination of HSM crash modification factors (CMFs) for lane width, shoulder width and type, curve length, curve radius, spiral transition presence, superelevation, grade, and driveway density (AASHTO 2010). CMFs are multiplicative factors that estimate the change in collisions after a countermeasure is implemented under specific conditions. Other relevant CMFs that are not currently incorporated into the HSM can be found through the CMF Clearinghouse (www.cmfclearinghouse.org) established by the Federal Highway Administration (FHWA) as a centralized location for CMFs. A Policy on Geometric Design of Highways and Streets
5
1.5 Step 5: Collision Data and Curve Characteristics Findings
Step 5 is intended to identify if the curve is of interest for improvement, based on the results of Steps 3 and 4. If Steps 3 and 4 show that there are no serious physical deficiencies and no overrepresentation of reported collisions, the site should not be considered a high priority for safety improvements. If deficiencies were found, collisions were overrepresented, or if both collision overrepresentation and physical deficiencies are identified, the process should be continued to explore the possibility of improvement through countermeasures.
1.6 Step 6: Field Data Acquisition and Confirmation
A field investigation (Step 6) can be used to acquire additional data or confirm assumptions made during prior steps. Field investigations include the direct measurement of attributes at the curve in question and inventorying of relevant roadway features not typically available with office methods during Step 2, such as the grade, superelevation, shoulder conditions (high or low points), and other condition related aspects that change over time. If the elements of concern in the HSM analysis correspond to the types of collisions examined in the collision data analysis, this should provide analysts with a high level of confidence that the source of the safety concern has been identified, and a site visit might not be necessary (users could progress directly to Step 7). An example of the value and importance of a field visit is a crash analysis which shows crashes in wet pavement conditions, followed by a site visit which reveals high shoulders which could cause hydroplaning. If significant deviations exist between the field observations and the office data collection methods or assumed values used in Steps 2-4, the process should be restarted at the curve criteria decision in Step 2. 1.7 Step 7: Recommendations
6
collision characteristics and potential countermeasures is essential to provide transportation agencies with effective improvements for curve collisions. Each potentially appropriate countermeasure should be evaluated for its potential effectiveness from a collision reduction (fatal, injury, and property damage only collisions) and cost effectiveness standpoint. Transportation agencies have a variety of funding mechanisms to complete safety improvement projects, such as spot safety funding; large construction projects; resurfacing, rehabilitation, and reconstruction projects; and routine maintenance. The variety of possible funding sources for safety improvements should be considered to save costs when possible by combining safety enhancements with other projects. A final recommendation of an appropriate countermeasure(s) can be made at the conclusion of this step.
1.8 Research Objectives
This research provides an engineer or agency with the ability to more efficiently and effectively study and improve the safety of horizontal curves. A comprehensive horizontal curve study procedure was developed with the following objectives in mind. These objectives supplement existing literature on horizontal curve studies and form the foundation of the comprehensive procedure.
1. This research will develop and utilize a new horizontal curve study method procedure to ensure a systematic approach for identifying curves, studying and measuring their characteristics, and improving hazardous locations.
a. This research will quantify the collision characteristics of horizontal curves, which will provide an engineer with the necessary information to identify and correct hazardous curves.
b. This research will recommend potential countermeasures for horizontal curves based on a linking of common horizontal curve collision types and effective countermeasures.
7
define, and analyze horizontal curves to determine their predicted safety performance.
d. This research will establish a set of parameters to which safety can be related through spatial and geometrical features.
i. Safety will be related geometrically through the establishment of guidance for horizontal curves for the implementation of the nationally accepted prediction model for roadways, presented in the Highway Safety Manual.
ii. Safety will be related spatially through the impact of spatial relationships on horizontal curve safety using the predictive methodology of the Highway Safety Manual as a foundation for incorporating spatial considerations into horizontal curve safety prediction.
1.9 Significance of the Research
8
The proposed consistent and repeatable procedure furthers the transition away from opinion or intuition and towards fact-based decision making for highway safety. Below is a relevant quote from Ezra Hauer (2007) about the importance of factual knowledge in highway safety, which is promoted by this procedure:
“A change from a system of road-safety delivery rooted in opinion, intuition, and folklore to one that is founded in science and based on factual knowledge is underway. Change, as always, faces obstacles. The main obstacle is the near absence of professionals who can be the carriers and providers of factual road-safety knowledge. The second important obstacle is the weakness of the knowledge in which these professionals would have to be trained. Both obstacles stem from the same source; in a society in which it is acceptable to deliver road safety on the basis of opinion, intuition, and folklore, there is little demand for factual knowledge and for carriers thereof. Therefore, the most urgently needed change of road-safety culture is to make intuition-based road-road-safety delivery socially unacceptable.”
1.10 Research Scope and Limitations
9
Many of the recommendations made are likely to be applicable for many years, while other recommendations might need periodic updates as better techniques or more data become available for analysis. The framework provided in this research allows for periodic updates to be accomplished in a consistent and accurate manner.
1.11 Dissertation Organization
10 2.0 LITERATURE REVIEW
2.1 Introduction
In North Carolina, there exist a great number of highway horizontal curves. As of 2006, the State of North Carolina had about 74,000 miles of two lane roads of a total of approximately 79,000 miles of roads (NCDOT 2007). The main function of horizontal curves is to provide a smooth transition between two tangent sections of roadway. Unfortunately, horizontal curves are relatively dangerous features, with collision rates about 3 times that of comparable tangent sections on average (Lyles and Taylor 2006). According to the statistics in the Fatality Analysis Reporting System (FARS) in 2002, about 42,800 people were killed in 38,300 fatal crashes on U.S. highways and 25 percent of the fatal crashes occurred on horizontal curves on two-lane rural highways.
The North Carolina Department of Transportation (NCDOT) has used several guidelines and handbooks for dealing with horizontal curve safety, including the Manual on Uniform Traffic Control Devices (USDOT 2003), AASHTO Green Book (AASHTO 2004), North Carolina Supplement to the Manual on Uniform Traffic Control Devices (NCDOT 2005), 3R Guide (NCDOT 2004), Traffic Control Devices Handbook (ITE 2001), and Traffic Engineering Policies, Practices and Legal Authority Resources (TEPPL) (NCDOT 2010) for designing safe horizontal curves. These guidelines deal with various important horizontal design
elements, such as selecting the adequate advisory speed, designing shoulder widths, and placing traffic control devices (TCDs).
11
including NC’s own version of the MUTCD and the TEPPL. The guidance for traffic control devices on curves is quite general, however. Much discretion is left to transportation engineers and technicians in the field, as the factors that matter in optimum device choices are too complex to distill into simple formulas or tables.
2.2 Collision Characteristics and Geometric Design Features
There are many studies identifying collision characteristics and geometric design features that have an impact on collisions. The following studies all address horizontal curve collisions. They also identify horizontal curves as causal factors in highway collisions and indicate that curves have a significantly higher collision rate than tangent sections. The purpose here is to see what curve characteristics and agency countermeasures have been identified and are most prevalent. The literature review encompassed crash rates, roadway characteristics at curves, causal factors, and numerous potential treatments.
Garber and Kassebaum (2008) studied nearly 10,000 collisions on urban and rural two-lane highways in Virginia finding the predominate type of collision to be run-off-the-road collisions. The significant causal factors of these run-off-the-road collisions included roadway curvature and traffic volume as determined through a fault tree analysis. The countermeasures identified to mitigate run-off-the-road collisions include widening the roadway, adding advisory signs or chevrons to sharp curves, and adding or improving shoulders. However, this study did not specifically address curve collisions nor did it indicate how many of the collisions were on curves.
12
design elements, its effectiveness, cost, and maintenance, and additional sources of information.
In Volume 7 of NCHRP Report 500, Torbic et al. (2004) provided strategies to improve the safety of horizontal curves. The study had two primary purposes. The first was to reduce the likelihood of a vehicle leaving its lane and either crossing the roadway centerline or leaving the roadway at a horizontal curve. The other purpose was to minimize the adverse consequences of leaving the roadway at a horizontal curve. To accomplish these research objectives, twenty detailed strategies were described as countermeasures for reducing curve-related collisions. Each strategy included a general description, an estimate of the effectiveness of each countermeasure, and special issues pertaining to horizontal curves. These countermeasures addressed traffic control devices, markings, sight distances, and horizontal alignments.
Another study that investigated the relationship between roadway design attributes and collision activity was performed by Strathman et al (2001). This study investigated the statistical relationship between collision activity and roadway design attributes on Oregon highways. Using collision data from a two-year period (1997-1998), the highways were divided into variable length homogenous highway segments, yielding a set of over 11,000 segments. For non-freeway segments, maximum curve length and right shoulder width were found to be among the design attributes related to curves that were statistically related to collision activity. Maximum curve angle (a surrogate for degree of curvature) was not found to be related to collision activity in this study.
13
change in azimuth between tangents. The analysis of high collision locations on horizontal curves found that the degree of curvature had a direct impact on the collision rate. The model also indicated that the collision rate on shorter curve lengths was significantly higher than on longer curves. In addition, this study produced a curve database for Iowa with radii and length attributes and a procedure for identifying horizontal curves with high collision occurrences statewide.
Zegeer et al. (1991) analyzed over 13,000 horizontal curves, primarily in Washington, to evaluate the relationship between curve features and collisions. To meet the study objective, the horizontal curve features which affected traffic safety and operation were first identified. A collision prediction model (consisting of variables relating to collisions and curve features) was developed through a variety of statistical methods. These variables were: curve length, volume of vehicles, degree of curve, presence of spiral transitions, and roadway width. From these identified variables, existing countermeasures for enhancing safety and operations at particular curve sections were determined and the model developed an effectiveness of collision reduction for each of these countermeasures. This study also provided general safety guidelines for curve design including signing, marking, and delineation as recommended cost-effective countermeasures.
14 2.3 Horizontal Curve Study Methods
This section summarizes study methods used to estimate advisory speeds and curve radii for horizontal curves. Six methods were reviewed from the several references. The criteria for the evaluation of each method included precision, cost, utility (ease to use), and safety. 2.3.1 Ball-Bank Indicator Method
Normally, advisory speeds for horizontal curve are determined through several direct runs of a test vehicle in the field. In general, the ball-bank indicator is the most commonly used method to select an advisory speed on horizontal curves (18). This method is initially based
on experiments conducted in 1930s. Although the MUTCD provides general guidelines for several TCDs, there still exist a variety of difficulties in practical field implementation due to the subjectivity and variability in traffic engineer’s opinions. Although there have been a lot of mechanical improvements in vehicle characteristics for the last 50 years, the criteria for setting advisory speeds on curves still use the old method.
Chowdhury et. al. (1998) assessed the validity in ball-bank indicator criteria for determining advisory speeds on horizontal curves. To accomplish the study objective, the authors collected the data on curve geometry, spot speeds, and ball-bank readings on 28 two-lane highways in Virginia, Maryland, and West Virginia. Data were analyzed to consider various factors including posted advisory speed, driver’s compliance, and friction factors. The authors compared the existing posted speed with the speed recommended by ball-bank indicator, a standard formula, and the 85th percentile. The authors suggested that the existing criteria of ball-bank indicator reading (10°, 12°, and 14°) should be revised upward to 12°, 16°, and 20° to better reflect average curve speeds.
15 2.3.2 Compass Method
The compass method is based on an advisory speed equation for a curve of specified radius and superelevation rate. Basically, this method needs curve radius and superelevation rate information.
Bonneson et. al. (2007a, 2007b) provided traffic engineers with technical guidelines of TCDs application and procedure for rural horizontal curves in the “Horizontal Curve Signing Handbook” using a compass method. This reference described detailed processes and methods for establishing advisory speed on horizontal curves.
Currently, the ball-bank indicator method is a widely used method to establish various TCDs. As an alternative method for determining the advisory speed, compass method was developed in this project which is based on measurement of curve geometry. To evaluate the developed compass method, it was compared with traditional ball-bank indicator method with respect to speed variability. The result indicated that the compass method is more stable than the ball-bank indicator method for curves having similar geometries. This means that the compass method provides more uniform and consistent advisory speeds for horizontal curves. In addition, it was found that ball-bank indicator method does not consider tangent section speed although the speed affects the advisory speed. However, the compass method has safety problems since the field personnel leave their test vehicle to collect data on the roadside (Carlson et al., 2005).
2.3.3 Direct Method
16
curve. However, this method also has the disadvantage of taking more resources to determine adequate advisory speed comparing to ball-bank indicator method and compass method.
2.3.4 Lateral Acceleration Method
The lateral acceleration method is similar to the ball-bank indicator method except that the unbiased lateral acceleration rate is substituted in the point-mass equation of BBI to determine the curve radius. The data measured by a lateral acceleration device are stored with traveled distance and vehicle speed. The error of this method is relatively low compared to ball-bank indicator method and compass method (Carlson et al., 2005). Also, just one field technician is required to collect needed data. However, the measuring device is expensive and, like the ball-bank indicator method, it is essential to drive the curve several times to obtain a good lateral acceleration.
2.3.5 Yaw Rate Transducer Method
The yaw rate transducer method uses a lateral acceleration device. Additionally, it provides not only traveled curve distance and vehicle speed but also the deflection angle of the curve. Therefore, this method can calculate the final curve radius using a simple equation like the following:
Curve Radius ft . (Equation 1)
However, this method is sometimes ignored in different study methods since significant noise exists in the collected yaw rate data.
2.3.6 GPS Method
17
vehicle running at particular speed allowing the measuring vehicle to travel with the normal traffic flow. The travel distance of the test vehicle is derived from GPS speed.
Carlson, et al. (2004) utilized a GPS method for determining delineator and chevron spacing, and a curve radius, on horizontal curves. The researchers performed surveys of a total of 34 states and visited 58 curve sites throughout the state of Texas to evaluate the current practices. During these visits, they obtained delineator and chevron spacing, curve radius, superelevation, driving speed, and other related curve characteristics. The results of the study show that a GPS provided a high level accuracy and cost-effectiveness. As a result, the authors suggested a simplified delineator and chevron spacing table using the GPS method. 2.3.7 Mobile Vehicle Method
Highway asset inventories can be rapidly obtained from vehicles traveling at highway speeds (Findley et al. 2011). Depending on the type and quantity of data elements being studied, the vendors that operate the vehicles utilize a variety of technologies to collect and analyze asset data, including high resolution still and video cameras, laser scanners, inertial navigation systems, global positioning systems, distance measurement instruments, and retroreflectometers. The advantages of mobile data collection over conventional techniques--including time savings, resource savings, and data collector safety--make a compelling case for data collection for a variety of highway assets, including horizontal curve data. A significant effort is required after the field data collection to post-process the data and generate the inventory. This literature review summarizes the use of mobile vehicles for highway asset data collection and roadway alignment measurements.
Technology used in the management of highway assets was the focus of the National Workshop on Highway Asset Inventory and Data Collection held in Durham, North Carolina
18
and drainage (Kim et al. 2009). The roadside appurtenances category was comprised of eighteen elements, including horizontal curves. The objective of the research was to compare roadway data collected by manual methods to data collected by data collection vehicles moving with the flow of traffic (Findley et al. 2011). The research team collected samples of data along a 90 mile test course in central North Carolina in 2008 with typical manual methods for comparison with the vendor supplied data. Six vendors completed the test course and submitted data on at least some of the elements. Overall, the mobile data were comparable to the manual data, with higher accuracy for elements closer to the travelway. Three vendors submitted measurements for four horizontal curves that could be compared to manual surveys. The curve radii reported by vendors varied from an average of 26% difference from the manual survey results to a 99% difference. The curve lengths reported by the vendors had a similar deviation from the survey results with a range of 60% to 97% average difference from the manual survey. However, due to the limited sample size, Findley et al. recommended further research into the abilities of mobile vehicle vendors to accurately and reliably report horizontal curve radii. The new study presented here utilized 24 miles of data from the effort undertaken by Findley et al. and applies other radius measuring techniques to generate more comparisons and discusses other important considerations for estimating the radii of horizontal curves.
19
Drakopoulos and Ornek (2000) used geometric information collected from mobile vehicles on 4.6 km of a two-lane road in Wisconsin to generate horizontal segment data defining horizontal curves and tangents. The data generated from the mobile vehicle was compared to as-built plans for nine horizontal curves on the test course. The comparison found a range of differences between the mobile vehicle data and the as-built plans that varied from 0% to 58% for degree of curvature and 0% to 55% for the curve length. The authors concluded that mobile vehicles are a potential source for horizontal alignment data.
Harkey et al. (2004) studied 18 miles of curvature along ten two-lane roadway segments in Connecticut with an automatic road analyzer (ARAN) van. The objective of the study was to evaluate an algorithm developed by the Connecticut Department of Transportation (CDOT) to process the horizontal alignment data and define the curvature of the roadway. Two analyses were performed, one to assess the consistency of the data and one to assess the accuracy of the data. The vehicle was driven along the roadway five times in each direction for use in the consistency analysis. The CDOT collected survey data at each of the curves as the field comparison for the accuracy analysis. In the consistency analysis, the study found the location of the curve among multiple runs was consistent, but unresolved issues were found for the length and radii measurements. The accuracy analysis results were poor with only half of the runs considered to be in good agreement with the survey data. The authors concluded that the results did not provide the reliability needed to acquire horizontal alignment data using mobile vehicles.
20 2.3.8 Study Method Comparison
Carlson et. al. (2005) compared the various methods for estimating curve radius including basic ball bank indicator, advanced ball-bank indicator, chord length, compass, field survey, GPS, lateral acceleration, plan sheet, speed advisory plate, and vehicle yaw rate methods. Eight of these 10 techniques were conducted to measure 18 horizontal curves in Texas. The criteria to evaluate all techniques were accuracy, cost, ease of use, and safety. The results of this study show that the GPS method ranked the highest in all of the criteria. They recommended the GPS method as the best study method to estimate curve radius.
2.4 Highway Safety Manual Analysis
The HSM safety model was utilized to predict the safety of a curve based on its characteristics (AASHTO 2010). The HSM methodology is primarily applied through three steps: selection and application of a safety performance function (SPF), application of crash modification factors (CMFs), and calibration of predicted collisions. Each step is repeated for every roadway segment. The SPF used for this analysis is appropriate for two-lane roads and is shown in Equation 2. The SPF relies on the Average Annual Daily Traffic (AADT) volume, in vehicles per day, and the length of the segment, in miles, to determine the predicted crash frequency with default base conditions.
Two lane SPF AADT ∗ Length ∗ 365 ∗ 10 ∗ e . (Equation 2)
21
reduced, while a CMF greater than one means that the feature is less than ideal and makes the road more hazardous.
Due to the recent release of the HSM, few studies have been completed on calibrating the crash prediction models in the HSM. However, two studies were reviewed that did evaluate the application of the HSM. The first study, by Sun et al. (2006), evaluated the applicability of the HSM safety prediction model to states from which crash data was not used in the original model development. The prediction model evaluated in this study was the model for two-lane rural roads in the draft HSM (which is very similar to the final HSM). Data from state routes in Louisiana were used. The authors did not follow the recommended HSM procedure for calibrating the predictive model due to the unavailability of data. However, the research team was able to create a database with the most important highway variables of average daily traffic (ADT), segment length, lane width, shoulder width and type, and driveway density. Since the average prediction model values were smaller than the observed values, a calibration parameter was computed as a function of ADT. The results of their analysis were presented in two groups: the first group consisted of 26 randomly selected control sections and the second group consisted of 16 control sections in the top 30 in the state for crash frequencies for three years. The analysis indicated that the HSM model successfully predicted crash frequencies, but the level of effort required to obtain the data necessary to calibrate the model was a challenge.
22
model is absolutely necessary to avoid the over prediction found in the base model. The authors also note that a primary issue with calibration exists because the high segmentation of the HSM procedures leads to low or zero crash segments which are not predicted accurately by the HSM.
The accuracy of models using baseline data default settings is also of interest for this research. A recent study by Lord et al. (2010) compared crash prediction models for rural four-lane highways in Texas. Two full models with several covariates and the product of baseline models and accident modification factors (AMFs) were compared using predicted mean values and variances. The results of this analysis showed that the full models have much smaller variances than the product of baseline models and AMFs. Thus, the authors concluded that when a study objective includes variance as part of the decision making process, a full model should be used.
Further details on which elements are critical to the outcome of a crash prediction model is also of interest for determining which elements will have the least affect if they remain as default settings. A study by Nowakowska (2010) developed logistic models for crash severity based on road characteristics of rural highways in Poland. This study found that shoulder presence and type, area type, sidewalk presence, and interactions had a statistically significant influence on crash severity. Easa et al. (2009) evaluated crash prediction models for three-dimensional alignments of rural two-lane highways in Washington State. The authors found that the most significant predictors of crashes were degree of curvature, roadway width, access density, grades, section length, and average annual daily traffic (AADT).
23
for site types which do not meet the recommended 100 collisions per year among 30 to 50 locations. To overcome the under-represented collision locations, the authors applied sample size estimation procedures based on average Oregon crash history for that site type to modify the expected total yearly collisions. Another study also examined the calibration of the HSM, as well as the development of new heuristic models (2011). The author found that a calibrated HSM model performs as well the newly developed models; therefore, a calibrated HSM model is the preferred safety model. The author also recommended a total of 150 collisions per year for the total yearly collisions of sites employed for the calibration process. 2.5 Crash Modification Factor Clearinghouse
The Federal Highway Administration (FHWA) has established a Crash Modification Factors (CMF) Clearinghouse (located at www.cmfclearinghouse.org) as a centralized location for CMFs. This tool allows for transportation professionals to search, identify, and evaluate which CMFs provide the most cost-effective roadway safety improvements given specific conditions. It is designed to be a user-friendly resource that presents and compares CMFs in a way that specific safety and research experience is not necessary. The clearinghouse is maintained by the UNC Highway Safety Research Center which will apply periodic content updates.
A CMF is a multiplicative factor used to estimate the change in the number of crashes after a given countermeasure is implemented under specific conditions. For example, a CMF for an intersection countermeasure of 0.80 indicates that if this countermeasure is implemented at an intersection experiencing 100 crashes, the expected number of crashes after implementation is 80 (100 x 0.80) for a crash reduction of 20%.
24 Keyword
Countermeasure Crash type Crash severity Roadway type Intersection type Intersection geometry Traffic control
Area type
The search creates a results list that provides a summary of each applicable CMF. This summary list allows users to compare applicable CMFs to determine which CMF may be best used for their specific situation. Included in the summary and details of each CMF is a star quality rating from 1-5 (with 5 indicating the highest quality). These star ratings are provided for the user to assess the quality of the CMF presented. Star ratings are developed through a review process that evaluates each study based on study design, sample size, standard error, potential bias, and data sources. The summary of each CMF also includes information on when and where these studies were done. This information is helpful for users to determine which studies were done recently and whether the locations are similar and applicable to their jurisdiction.
In an effort to keep the data current, the CMF Clearinghouse will be regularly updated with new research. This new research will be added through staff regularly examining published and presented material and through studies that are submitted through the website by users.
25
roadside, roadway, roadway delineation, roadway signs and traffic control. Comparing two CMFs for rural conditions found a CMF of 0.741 for installing edgelines on curves and a CMF of 0.94 for installing raised pavement markers and transverse rumble strips on approaches to horizontal curves. These CMFs can then be evaluated for application at specific conditions in North Carolina based on further study details provided in the summary of each CMF.
2.6 GIS and Remote-Sensing Procedures
GIS systems are commonly utilized in the field of transportation for planning, design, construction management, operations, safety, maintenance, and other purposes (ESRI 2010). In addition to the studies discussed below, the Methodology section presents further details of currently available applications that can be used with GIS software for the purpose of determining the radius of horizontal curves.
A current research need identified by the Transportation Research Board's Statewide Transportation Data and Information Systems Committee involves the desire for quantifiable benefits of GIS capabilities (TRB 2010). GIS applications are logical tools transportation departments could use as spatial analysis to gain operational efficiency improvements. However, the money available to invest in GIS applications is limited and their development should be examined by the need, importance, and benefits of these applications. This research details the application of a set of GIS applications for horizontal curves and validates the ability of that application to identify and characterize curves. Doing so responds to the identified research need and contributes to more well founded GIS use, particularly for transportation applications.
26
process involved recognizing sight obstructions by exaggerating vertical factors. Doing so resulted in the isolation of ten problem spots which were then verified with contemporary design standards and a sight line analysis in a GIS. The field visit validated all ten locations which demonstrates the ability of a GIS to utilize and analyze data for sophisticated highway analysis conducted without a field visit.
Castro et al (2008) combined the mapping power of a GIS with horizontal and vertical alignment data to perform a safety evaluation of the highway alignment design based on estimated speeds. Using map information and alignment data, routes were generated to calculate speed profiles along the roadway. Finally, the consistency of the designs were evaluated and represented graphically. The methodology was applied to three two-lane rural highways in Spain with different radii, shoulder widths, lane widths, and design speeds. The methodology resulted in the identification of more problems areas than other contemporary methodologies.
Imran et al. (2006) studied vehicle paths on horizontal curve alignments in Ontario, Canada. The process involved the development of a method of incorporating global positioning system (GPS) information into a GIS for the calculation of the radius, length, spiral length, and vehicle position for nine curves. Each of the nine curves were investigated in both directions at three different speeds (80, 90, and 100 kilometers/hour). Curve radii ranged from 349 meters to 873.2 meters (1,145 to 2,865 feet) and the length of the curves ranged from 162.4 meters to 783.6 meters (532 to 2,571 feet). The method resulted in an average difference of 1.55% between observed and designed radius values, using an observation interval of 0.1 seconds of the GPS data. The length of each curve (arc length) was overestimated by approximately 4%, while the entry and exit spiral transition lengths were overestimated by 24% and 32%, respectively.
27
data were needed to conduct a safety analysis of the road network. The procedure identified curves based on the average angle between line segments. The automatic procedure is not publicly available and no other information is presented regarding how well the curves were identified or characterized.
Hans et al. (2009) used GPS data to develop a statewide curve database for crash analysis in Iowa. The data were manipulated in a GIS to identify sites with possible curvature by creating continuous linear features, simplifying the routes, and grouping consecutive points. The focus of this work was to detect the presence of a curve and not the specific values of curve characteristics. No other information is available regarding how well the curves were identified.
Another method of building and calculating curve radius values was developed by Price (2010). The GIS methodology includes 5 tasks (and 30 sub-tasks) which involve constructing chords, modeling the middle ordinate, separating the curves, and calculating the curve radius. The curve radius calculation is based on Equation 3. This methodology is similar to Curve Calculator by ESRI which can generate a curve radius based on its arc length and chord length. The methodology was presented along with a detailed exercise involving a 3.5 mile long, 16 feet wide roadway that climbs steeply up a mountain in Washington through many sharp curves. No other information is available regarding how well the curves were identified or characterized.
(Equation 3)
28
utilized to detect the curves and tangents. Twelve simple curves at a highway interchange were identified and characterized as part of the study ranging from 22 to 501 meters. The authors reported that each curve was accurately identified, but no quantitative measures were presented and the results were not compared to other methods or techniques.
Three of the four efforts discussed above have led to the development of programs or methods to extract horizontal curve data for a specific purpose (Imran 2006, Martinelli 2009, Price 2010). Several other similar programs, the focus of this research, are publicly available (ESRI 2009, FDOT 2010, Harpring 2010). However, to this point, no study has characterized the quality or optimal uses of the available programs. These previous efforts developed programs or methods specifically for the intended use of the study or for a specific locality, but with further analysis they might have the potential to be utilized by others. The focus of this research is to assess, compare, and benchmark the publicly available GIS methods for horizontal curve spatial data collection.
2.7 General Guides for TCDs for Horizontal Curves
Traffic control devices (TCDs) including signs, signals, pavement markings and other devices play a role in moving vehicles safely and efficiently as providing important information on geometric design and traffic operation to drivers. The USDOT and ITE (USDOT and ITE 2004) briefly describe the function and characteristics of uniform TCDs. They provide resources to select proper TCDs and deal with several issues related to their installation and placement. As required resources for determining adequate TCDs on subject roads, they recommended the MUTCD, the Traffic Engineering Handbook, and the Traffic Control Devices Handbook. They also mentioned general issues relevant to TCD placement and installation. The reference provides general direction and information to correctly apply TCDs with consistency.
29
two-way rural roads) to drivers. This study included focus group exercises of practitioners and drivers, surveys of practitioners and drivers, and a limited field study of a drivers’ behavior. The different types of TCDs available included signs, advisory speeds, chevrons, edgelines, centerlines, delineators, and pavement markers. In addition, some problems were identified regarding communicating changes, such as changes in speeds and geometric design elements. Perceptions of drivers and practitioners were determined for TCDs used for horizontal curves through focus group exercises. Perceptions were determined to evaluate adequacy of devices, consistency of devices, and necessity to change devices. From these exercises, the authors concluded that there was inconsistency in use curve-related TCDs by different drivers and that the combinations of curves and TCD interpretation inconsistency can result in dangerous scenarios. A survey was conducted to obtain a wider point of view and assess responses to different curve-related issues. The survey provided similar results to the focus groups. Particularly, signing and marking were identified as issues for horizontal curves.
Finally, driver performance monitoring (DPM) techniques were used to observe randomly selected drivers’ behaviors. DPM is a technique in which trained observers evaluate a driver’s behavior including the driver’s visual search, speed, and direction control on the curve. The authors suggested some changes such as the addition of winding road signs, advisory speed signs, and horizontal alignment signs in the MUTCD guidelines (Lyles and Taylor, 2006).
2.8 TCDs Effects on Horizontal Curves
30
2.8.1 TCD Application and Safety Effects for Horizontal Curves
In a 1991 study for FHWA, Zegeer et al. developed relationships between crashes and various geometric features of horizontal curves such as degree of curve, curve length, roadway width, spiral curve, superelevation, roadside condition, and average daily traffic. In the researchers’ work, to meet the study objective, the horizontal curve features which affect traffic safety and operation were first identified. From the determined features, currently used countermeasures for enhancing safety and operations were determined. Finally, cost-effective countermeasure guidelines and a methodology were developed to apply to particular curve sections. Analyses of a 10,900 horizontal curve data set from Washington State and a 3,277 curve data set from FHWA were performed with respect to curve features and crashes to estimate their relationships and to develop accident reduction factors.
Through a variety of statistical methods, the Zegeer et. al. study developed a crash prediction model consisting of variables related to crashes and curve features. The variables found to be significantly related to the number of curve crashes included the degree of curve, roadway width, curve length, ADT, presence of a spiral, superelevation, and roadside condition. Based on the model, geometric improvements which were determined to reduce curve crashes included curve flattening, widening lanes and shoulders, adding spiral transitions, improving deficient superelevation, and making certain types of roadside improvements. Although that study did not specifically evaluate TCD’s in terms of crash effects, the authors did discuss the relevance of such measures in the study recommendations:
31
Even if construction or reconstruction of a poorly designed curve is not feasible, substandard signing, marking, and delineation should still be improved on hazardous curves.”
In 2001, Hammond and Wegmann (2001) evaluated the effect of raised pavement markers (RPMs) on motorists on horizontal curves. The RPMs are traffic control devices used to increase the visibility of changing roadway alignment. The authors derived relationships between RPM applications and driver behavior (the level of opposing-lane encroachment). Under dry weather and daylight conditions, a total of 600 data points of vehicle speed and encroachment were obtained from two horizontal curve segments located in Knoxville, TN. To quantify the effects of RPMs and verify the significance of the collected data, three types of statistical methods were utilized including F-test, Tukey test, and Chi-square test. From the statistical analysis, the results indicated that the level of encroachment decreased after installation of RPMs but the RPMs did not affect average operating speeds on horizontal curves. From this study, the authors recommended a 40 ft spacing of RPMs to prevent encroachment into the opposing lane. However, a shorter spacing than 40 ft is not cost-effective in daylight conditions.
32
improve on the road. Also, it is cost-effective compared to a normal yellow warning sign or especially to a flashing beacon. The research identified the safety and economic effectiveness of fluorescent yellow warning signs which can be applied to horizontal curves.
Torbic et. al. (2004) suggested ways to improve the safety of horizontal curves. There were two primary purposes for their study. One was to reduce the possibility of a vehicle leaving its lane and either crossing the roadway centerline or leaving the roadway. The other was to minimize the adverse consequences of leaving the roadway at a horizontal curve. To accomplish these objectives, twenty detailed strategies were described as countermeasures for reducing curve-related crashes. Each strategy includes a general description, an estimate of the effectiveness of the treatment, and special issues pertaining to horizontal curves. Some of the strategies that cover signs, markings, sight distance, and horizontal alignment are related to this research.
33
Motor vehicle crashes are a significant and costly problem for two-lane horizontal curves. Various factors including driver factors, vehicle factors, and roadway factors contribute to vehicle collisions on curves. From previous studies, the vehicle speeds approaching a curve is related to curve-related crashes, especially on two-lane roadway with sharp horizontal curvatures. Retting and Farmer (1998) examined the effectiveness of pavement markings reducing curve speed based on rural and suburban two-lane horizontal curves. In their work, they compared vehicle speeds before and after installation of the pavement marking. For the comparison, speed measurement was conducted using TimeMark™ Delta Traffic Counters connected to pneumatic road tubes on a two-lane sharply curved road (approximately 90 degrees) in Northern Virginia. The speed measurement data were collected for two weeks after the marking installation. The equipment produced vehicle classification, gap, and speed data. Statistical analysis was performed using logistic regression models to measure the effect of the pavement marking. The results from this research have shown that the pavement marking in this study is associated with a decrease in vehicle speed of about 6 percent overall and 7 percent during daytime and late night periods.
2.8.2 Modeling for Determining Hazardous Curve Category
34
Nielsen and Herrsted (1999) developed a systematic and uniform framework for signing and marking for substandard horizontal curves that have similar geographic design characteristics on rural roads. The objective of this study provides drivers on curves involved in a particular danger category with the same information from signing and marking. This study consisted of three sections: models to define substandard horizontal curves and classify danger categories; basic signing and marking concepts depending on the danger categories; and detailed methods to apply in practice. The key point of the model is the approach speed and curve design speed. The larger the difference between speeds, the more serious the danger category.
Bonneson et. al. (2007b) developed a horizontal curve signing handbook to guide traffic engineers and technicians in the United States responsible for designing the traffic control devices for rural horizontal curves. The objective of the handbook is to identify when warning signs and advisory speed plaques should be installed for safe traffic operation on curves. Another important purpose was to determine the advisory speed for uniform and consistent driver expectations. In the guidelines, they first determined the curve’s danger category based on tangent section speed and curve speed and applied combinations of several TCDs to the curve. They limited the number of TCDs used at a subject curve to improve the uniformity and consistency.
2.9 Spatial Relationships
![Figure 6. GIS Line Work – Horizontal Curve with 3 Points [ESRI 2009]](https://thumb-us.123doks.com/thumbv2/123dok_us/1292686.1161810/86.612.114.271.89.290/figure-gis-line-work-horizontal-curve-points-esri.webp)