BENCHLEAK: “An Innovative Water Balance Software
for Non-Revenue Water Calculation from Urban Water
Supply Network”
Dr. Reena D Popawala
Asso. Prof. in Civil Engineering Department C.K.Pithawalla College of Engg. & Tech., Surat Surat-Dumas road-395007 Surat, Gujarat, India
e-mail: reena.popawala@ckpcet.ac.in
Abstract: There is an increasing awareness around the world regarding sustainability of water resources as it is limited. The active water loss management is one of the primary interests of water utilities in the world. In the last decade a comprehensive set of analytical tools and water loss reduction strategies has been developed. The IWA methodology of determining and comparing leakage in water distribution system is now accepted as best practice in many countries of world. In this research paper, BENCHLEAK software developed by WRC is used and effort is put forwarded to evaluate Infrastructure leakage Index (ILI) as well as non- revenue water generated from the water distribution system of Surat city.
KEY WORDS: IWA, BENCHLEAK, WRC, NRW, ILI
1. INTRODUCTION
Within the last few years there has been growing realization that the rapidly increasing water demands throughout the world are not sustainable [McKENZIE R.S et al,(2002)]. Hence significant advances have been made in the understanding and modeling of water loss components and on defining the economic level of leakage for individual systems. Yet, despite some encouraging success stories, most water supply system worldwide continues to have high level of water losses. The problem is the lack of a meaningful standard approach to benchmarking and reporting of leakage management performance. Surprisingly, few countries have a national standard terminology and standard water balance calculation and even then, they all differ from each other. Being aware of the problem of different water balance formats, methods and leakage performance indicators, the IWA has developed a standard international water balance structure and terminology [Alegre et al, (2000)]. This standard format has meanwhile been adopted (with or without modifications) by national associations in a number of countries and most recently the American Water Works Association (AWWA). The aim of this paper is to convince managers of water utilities regarding high levels of water losses. The introduction of these new concepts will be an important first step towards more efficiency and sustainability of water resource.
Several recent studies have shown that major proposed augmentation schemes can be postponed by many years if the growth in demand can be trimmed by only a few percent – a target that is certainly achievable in most systems. The savings associated with delaying a new water transfer scheme are so large that the measures needed to achieve the delay are not only environmentally attractive but also very cost effective.
2. STATE OF KNOWLEDGE
The BABE approach was first introduced to South Africa in 1994 through a series of courses and seminars presented countrywide by Ronnie McKenzie and Allan Lambert (founder of BABE) at the request of the Water Research Commission. The methodology and concepts have since been widely accepted by most water suppliers throughout the country and have been incorporated to a large degree in the Code of Practice for the management of potable water in distribution systems [SABS, (1999)]
In order to address following four key components of the BABE methodology, four models were developed over a period of approximately four years. Each model is a small self-contained program that addresses one specific issue. This simple and straightforward approach is adopted in order to avoid confusion and allow water suppliers to use one or all of the models as it is considered appropriate rather than develop a single application covering all aspects. All four models are available through the Water Research commission. The various manuals accompanying the software can be obtained directly from the WRC website on www.wrc.org.za [McKENZIE R.S et al,(2000 )].
Logging and analysis of Minimum Night Flows; Economics of leakage and leakage control; Pressure Management;
Benchmarking of Leakage and Auditing of Non-Revenue Water
3. BENCHLEAK: CALCULATION AND RELIABLE BENCHMARKING OF LEAKAGE
The water suppliers tend to use their own definitions of real losses and unaccounted-for water; it has been very difficult to compare leakage levels and levels of non-revenue water from one system to another system. By adopting a standard approach to the water balance, it is now possible to compare results from different systems in a meaningful manner.
.
A project was initiated by the WRC to look into the problem of comparing leakage levels in the various supply systems throughout South Africa. A standardised approach to leakage benchmarking was developed through the project and incorporated in the BENCHLEAK Model. The approach adopted in the benchmarking project was based upon the work done by the IWA Task Force on Water Losses [Lambert et
al, (1999)]. The approach developed through the
WRC has been very successful and has already been adapted for use in many other parts of the world. Numerous organizations have now developed their
own versions of BENCHLEAK which they are using to provide first order estimates of the real losses and non-revenue water in their water supply systems. However, the basic approach includes the use of the relatively new Performance Indicator called the Infrastructure Leakage Index [Lambert, et.al, (1999)] (ILI) which is a simple ratio of the current annual real losses (CARL) divided by the unavoidable annual real losses (UARL).
ILI = CARL / UARL
The unavoidable annual real losses (UARL) can be easily assessed for most systems as long as the number of connections, length of mains, location of customer meters and average operating pressure are known. Details of all the calculations are provided in the BENCHLEAK User Guide which is available from the WRC together with the model. The BENCHLEAK Model the IWA standardised ‘best practice’ terminology to describe the basic elements making up the water balance for a water supply system.
The methodologies mentioned above address certain key issues regarding the management of leakage and non-revenue water, they do not address the many social and environmental issues which are also very important. Water suppliers should therefore ensure that they consider both the social and environmental issues as well as the technical issues since the success of a project will depend on both sets of issues being addressed properly.
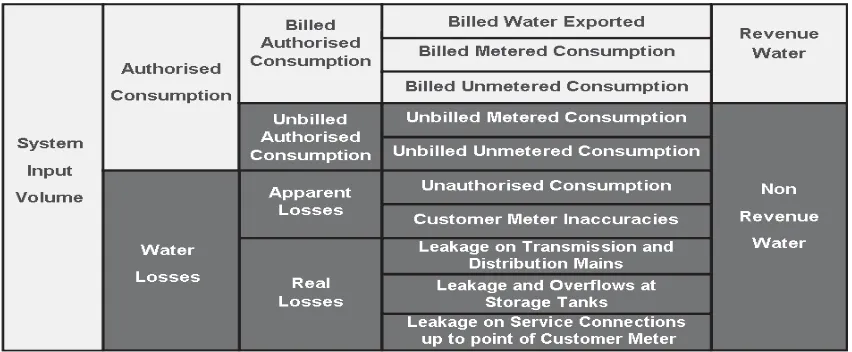
4. STANDARDSED WATER BALANCE
Fig. 1 Standard IWA water balance (source: R.S Mckenzie, 2007)
5. METHODOLOGY FOR INFRASTRUCTURE LEAKAGE INDEX
Following steps were followed for calculation of Infrastructure leakage Index of the Surat city.
Preparation of simple data form as per IWA water balance performance indicator Data form sent to the hydraulic engineer at SMC
Collection of data form after 4-5 weeks Verification of data
Data entered into BENCHLEAK data sheet Result obtained
The standard IWA water balance was first introduced in the late 1990’s and due to the efforts of members of various IWA task teams it has gained considerable momentum all over the world. As a part of the process of undertaking a standard water balance, various performance indicators have also been produced, the most recent of which is the Infrastructure Leakage Index or ILI. For research work, performance indicators were taken from BENCHLEAK and primary data sheet were prepared and sent to hydraulic engineer. The data were received then it is fed into Leakage Benchmarking sheet of BENCHLEAK Software and Infrastructure Leakage Index was obtained and compared with standard ILI values in a meaningful and realistic manner.
6. PERFORMANCE INDICATOR USED FOR INFRASTRUCTURE LEAKAGE INDEX:
The following performance indicator are used for calculation of ILI using BENCHLEAK software is mention below.
6.1 SYSTEM DATA DETAIL:
These details include basic information related to water supply network like length of main, number of service connection, density of service connection, average operating pressure, % of time when system is pressurised and population served by supply system. All the data except % of time when system is pressurised were readily available. % of time when system is pressurised was calculated on the basis of
Table 1 system data for ILI Input description Vari
able
Actual Data
Unit s Length of mains
(Transmission+ distribution)
Lm 2750 Km
Number of service connections
Ns 376000 Num ber Density of service
connection /km of mains
Ns / Lm
137 Per
km
Percentage of time system is pressurised during year
T 15 %
Average operating pressure when system pressurised
P 30 mete
r
Population served by the supply system
Popu latio
n
Water supply hours as study area supplies water intermittently (two-three hrs) daily.
The frequency at which new leaks occur and the rate of flow of leaks are related to operating pressure. The exact relationship between operating pressure and leakage has not been established, but simplified assumption adopted that leakage varies linearly with pressure which yields realistic results. Operating pressure is constrained by local topography and minimum levels of service and will vary significantly between different water supply systems. The average operating pressure varies from about 15m to about 45 m of head for the reference set with an average value of 30 m. Density of connections (number of connections per km of mains) is an important indicator and can vary significantly from one system to another. The density of connections can also be used as a quick check in the verification of data. For example, a low value of 5 connections per km of mains suggests that on average there is one connection for every 200 m of mains. It is possible where the supply system consists mainly of large plots and smallholdings. On the other hand, high density of connections can be expected in some of the large urban centers due to the existence of high-density low-income areas where erf sizes are relatively small. It should be noted that care should be taken in cases where the person providing the information estimates the number of connections as being equal to the number of properties. It is not always the case that the number of connections is equal to the number of properties, since it is common practice to have one saddle connection branching to two or more erf connections. It is also often found that undeveloped properties are often not connected. For comparison purposes the number of service connections can usually be considered to be equal to the number of serviced erven.
6.2 OPERATIONAL PERFORMANCE INDICATORS
The apparent losses are simply considered to be a percentage of the total losses. A value to the order of 20% is normally considered to be appropriate, although it can vary from system to system. The apparent losses represent a component of the water that escapes the revenue system and any reduction in apparent losses will result in a greater income to the water supplier at the effective selling price of the water. In some situations the apparent losses can be very high and can even exceed the physical losses (or
real losses), especially in cases where levels of payment are low and the payment is based on a flat tariff rather than measured consumption.
The expressing real losses per connection shows no definite trends with regard to grouping, which proves that it is not biased in terms of system size, system input, unit consumption, etc. As in the case of CARL per connection/day, expressing real losses per kilometer of mains or per connection per meter of pressure also shows no definite trends or distribution patterns.
6.2.1 ESTIMATION OF UNAVOIDABLE ANNUAL REAL LOSSES (UARL)
The procedure to estimate the unavoidable annual real losses (UARL) was developed by Lambert (1999). Basically UARL involves estimating the unavoidable leakage for three components; namely, mains, connections at street edge and service connections after street edge. The formula given in BENCHLEAK software was used for calculation of UARL. The data and formula used were,
• Length of mains (Lm)
• Number of service connection (Ns)
• Average operating pressure when system is pressurised (P)
• Percentage of time when system is pressurised (T)
On mains = 18*Lm*P*365*T/108
On Service connection= 0.8*Ns*P*365*T/108
Table 2 Unavoidable annual real losses for Surat city
Details Actual
data
units
On mains 81 103 m3/yr
On service connections 494 103 m3/yr Total volume of UARL 575 103 m3/yr
UARL in
lit/connection/day when system is pressurised
28 Lit/conn/day
6.3 ANNUAL WATER BALANCE DATA
The annual water balance was calculated based on system input volume as shown in table .3.
The system input comprises the water supplied from the municipal corporation own source as well as water purchased from other sources. The 2% correction is allowed for the source bulk meter as well as any input from unmetered sources which would usually be relatively small.
Table 3. Water Input volume
6.3.2 COMPONENTS OF AUTHORISED CONSUMPTION
According to BENCHLEAK software the total authorized consumption is split into several
Table 4 Volume of authorised consumption of water
Compone Total 24820 19272
0
components including exports, households, non-households, standpipes, firefighting, mains flushing, building water and the option for adding another two user-defined categories. In most instances, the categories included are sufficient to allow the supplier to provide a reasonable breakdown of the water use in the area of supply. Some of the items listed may be excluded or estimated since they may not be recorded directly. The various headings (billed metered, billed unmetered etc) are self-explanatory terms.
6.3.3 ESTIMATION OF WATER LOSSES:
In BENCHLEAK model basically three elements of water losses are considered. These are as under.
Total Losses;
Water losses = system input – authorised consumption
Apparent losses 12235 103 m3/yr Annual real losses= water
losses- apparent losses
48939 103 m3/yr
details are not available with water supplier. Hence, the Apparent Losses are simply considered to be a percentage of the Total Losses mentioned above. A value to the order of 20% is normally considered appropriate, although it can vary from system to system. The Apparent Losses represent the water that scapes the revenue system and any reduction in Apparent Losses will result in a greater income to the water supplier at the effective selling price of the water. As per [R S McKenzie, ( 2002)] In some situations the Apparent Losses are very high and can even exceed the physical losses, especially in cases where levels of payment are low and the payment is based on a flat tariff rather than measured consumption.
The real losses are then calculated directly as the difference between the total losses and the estimated apparent losses. The real losses represent the physical water lost from the system and any reduction in Real Losses will result in lower purchases of water by the water supplier.
6.3.4 CURRENT ANNUAL REAL LOSSES PER CONNECTION:
The “Current Annual Real Losses per connection per day helps to remove the influence of the size of the system, and allows a more direct comparison between different systems and can be calculated using following formula.
CARL = ARL*106/ (Ns * T/100 * 365) = 2377 (lit/service connection/day)
Consumption = 1585 lit/Conn/day
Different systems operate under different average operating pressures. It is also known that leakage is influenced directly by pressure and in order to remove this influence the previous indicators of Real Losses can be divided by the average operating pressure.
6.4 INFRASTRUCTURE LEAKAGE INDEX
The Infrastructure Leakage Index (ILI) is the most recent and preferred performance indicator for comparing leakage from one system to another. It is a non-dimensional index representing the ratio of the current real leakage and the “Unavoidable Annual Real Losses” (UARL). A high ILI value indicates poor performance with large potential for improvement while a small ILI value indicates a
well-managed system with less scope for improvement.
The detailed Operational Performance Indicators for Real Losses deals with both UARL and CARL. The ratio of the Current Annual Real Losses (CARL, calculated from the standard Water Balance) to the UARL, is the Infrastructure Leakage Index (ILI). The ILI for study area is 85.06. The result reveals the water system falls in D category (Liemberger, 2005) and needs immediate attention to reduce water losses.
6.5 NON-REVENUE WATER
The below table represents 21.95% of total input volume is non revenue water in study area which is considered high amount and same water can be utilized to serve more people in the city.
Table 6. Non revenue water as a % system input
Description of unbilled items
Volume 103 m3/yr
System Input 103 m3/yr
% of system Input 103 m3/yr Unbilled
consumption
--- 278714 ---
Apparent losses 12235 278714 4.39 Real losses 48939 278714 17.56 Total Unbilled 61174 278714 21.95
REFERENCES:
1. Alegre et al (2000),”Losses from water supply systems: Standard Terminology and performance measures”, IWA Manual of best practice
2. Lambert et. al 1994. The ‘Managing Leakage’ Series of Reports Report A : Summary Report. ISBN: 1 898920 06 0 3. Lambart A., Brown T.G. Takizawa M.
Weimer D,(1999) “A review of performance indicators for real losses from water supply systems”, AQUA, Dec 1999, ISSN 0003-7214
4. Liemberger R.(2005) , “Real losses and apparent losses and the new W392 guidelines from Germany” International water association specialist workshop, Redisson resort, Gold coast, Queensland Austrelia
―Leakage Managementǁ, pp.280-290, Lemesos, Cyprus
6. R.S.Mekenzie, C Seago and R. Liemberger (2007), “ Benchmarking of losses from potable water reticulation system – Results from IWA task team, Journal of IWWA, July-Dec 2008 , Vol.XXXX No. 3-4 7. SABS, (1999),. South African Code of