54
Multi-class protein Structure Prediction Using
Machine Learning Techniques
Mayuri Patel
Information Technology Department A.D Patel College Institute ofTechnology
Vallabh Vidyanagar – 388 120
Abstract- Protein structure prediction is the major problem in the field of bioinformatics or Computation
biology. Recently many researchers used various data mining and machine learning tool for protein structure prediction. My intention is to use model based (i.e., supervised learning) approach for protein secondary structure prediction and our objective is to enhance the prediction of 1D and 2D protein structure problem using advance machine learning techniques like, Neural Network ,linear _ non-linear support vector machine with different kernel functions and also used different algorithms (GOR,SOMPA etc..) . The datasets used for this problem are Protein Data Bank (PDB) sets, which is based on structural classification of protein (SCOP), RS126 and CB513..
Index Terms-
Bioinformatics, feature selection (FS), GOR algorithm, SOPMA algorithm, Scoop (Structural classification of protein), protein data bank (PDB), RS126 and CB513Neural Networks (NNs).1. INTRODUCTION
Bioinformatics is field of science in which biology, computer science and information technology merges into a single discipline [1]. Alignment and comparison of DNA, RNA, and protein sequences[4], Automatic classification of proteins[3], 3D- dimensional protein fold recognition and Promoter recognition in imbalanced DNA Sequence datasets[7], Classification of micro array gene expression data[14], Prediction of transmembrane segments[8] and Word sense disambiguation in the medical domain[9] are the open challenges in bioinformatics applications to develop methods and tools to generate hypotheses from the data obtained by variety of approaches.
The key idea of machine learning is to design the machines to learn like a human, learn from experience and discover information from the available dataset. This technique is suitable for application to bioinformatics because the subjects can be easily adapted to a new environment .This feature is more important for biological researcher because new data are generated every day and probably the newly generated data will update the initial concept or learning hypotheses. This task can accomplish easily in machine learning approaches due to their self adjustable features. These techniques operating individually or in combination can tackle the various challenges in bioinformatics.
2. PROTEIN STRUCTURE PREDICTION
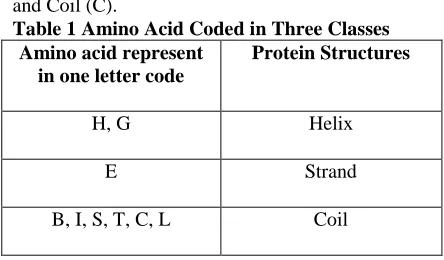
[image:1.595.311.533.455.585.2]In order to develop multi-class protein structure prediction algorithm, it is a primary need to understand protein and its datasets, protein structure, and the problem of protein structure prediction. Each protein is a polymer, specifically a poly-peptide bond, made up from 20 possible amino acids. There are mainly three classes of 20 amino acids protein structure: Helix (H), Strand (E) and Coil (C).
Table 1 Amino Acid Coded in Three Classes Amino acid represent
in one letter code
Protein Structures
H, G Helix
E Strand
B, I, S, T, C, L Coil
55
Protein Data Bank (PDB) – Protein data bank is basis of
Structural Classification of Protein (SCOP) database, which is a publicly accessible over the internet [http://ranger.uta.edu/~chqding/protein/].All the chains available from PDB are compared with each other using the Basic Local Alignment Search Tool (BLAST) algorithm as implemented in the National Centre for Biotechnology Information (NCBI) toolkit library. We used PDB database as referred by the authors Ding and Dubchak [2, 11]. Authors have used training dataset is base on PDB_select sets where two protein have no more than 35% of the sequence identity for the aligned subsequences is longer than 80 residues. This data base includes total 128-folds, in each fold belongs to four classes like: α ,β, α+β and α/β. We are considering 311 protein sequences for training and 383proteins sequences for testing, which are of 27-fold rather than 128-fold.
RS126 – a set of 126 protein sequences proposed by Rost
and Sander [13] widely known as RS126 protein dataset. The RS126 dataset are non-redundant, this mean that no two protein in the set share more than 25% sequence identity over a length of more than 80 residues.
CB513 – a dataset of 513 sequences developed by Cuff and
Barton [10], with the aim of evaluating and improving protein secondary structure prediction methods. The CB513 dataset includes the CB396 dataset and almost all proteins of RS126 except nine homologues for which the SD significance score is more than 5SD.It is one of the most used independent datasets in bioinformatics field.
Protein structure has a basically four levels of category: Primary Structure, Secondary structure, Tertiary structure and Quaternary structure [1].Protein tertiary structure prediction is of great interest to biologists because proteins are able to perform their functions by coiling their amino acid sequences into specific three-dimensional shapes (tertiary structure). This tertiary structure is of high importance in drug design and biotechnology. On the other hand, in the prediction of protein tertiary structure the prediction of protein secondary structure is an important step.
3. MACHINE LEARNING TECHNIQUES
In order to protein structure prediction in literature various well-known servers are available online. In this paper our aim is to discuss and compare protein structure prediction accuracy using the simulation results of these machine learning techniques for non-homologous protein datasets.
3.1 NEURAL NETWORK BASE PROTEIN STRUCTURE PREDICTION:
For classification and regression task the neural network (NN) has gain popularity among many existing algorithms. Normally feed-forward back-propagation neural network mapped the non-linearity between the input and output data and during training network adjust the connection weights. Kabsch and Sander [8] used neural network for secondary structure assignments on the Brookhaven databank of protein. In this Paper, we present
the use of feed-forward back-propagation neural network for secondary structure perdition for three protein datasets.
The feed forward network has three layers: input, hidden and output layer. The hidden layer aids in performing useful intermediary computations before directing the input to the output layer. The input layer neurons are linked to the hidden layer neurons and the weight on these links are referred to as a input-hidden layer weights, and again hidden layer neurons are linked to the output layer neurons and the corresponding weights are referred to as a hidden-output layer weights [9].
The state of each unit has a real value in the range between 0 and 1. The states of all the input units that form an input vector, which are determined by an amino acid residues through an input coding scheme. Starting from the input layer to the hidden layer and moving toward the output layer, the state of each unit i in the network is determined by:
The goal of this network is to carry out a desired input-output mapping. For our problem, the mapping is from amino acid sequences to secondary structures. The back-propagation learning algorithm can be used in networks with hidden layers to find a set of weights that performs the correct mapping between sequences and structures. Starting with an initial set of randomly assigned numbers, the weights are altered by gradient descent to minimize the error between the desired and the actual output vectors. Network adjusts the weights from input to hidden and hidden to output layer during training phase. This weight updation is calculate based on the error function as:
Where, T = Target output, and O = Observed output.
3.2 FEATURE VECTOR EXTRACTION FROM PROTEIN SEQUENCE:
Feature extraction is a form of pre-processing in which the original variables are transformed into new inputs for classification or regression task. This initial process is important in protein structure prediction as the primary sequences of the data are presented as single letter code. It is therefore important to transform them into numbers. Different procedures can be adopted for this purpose, however, for the purpose of the present study, orthogonal coding will be used to convert the letters into numbers.
3.3TRAINING THE NEURAL NETWORK:
56 specified by the target matrix is minimized.A neural
network training tool is available in Matlab tool.
One common problem that occurs during network training is data over fitting, where the network tends to memorize the training examples without learning how to generalize to new situations. Our method for improving generalization is called early stopping and consists in dividing the available dataset into three subsets:
(1) The training set, which is used for computing the gradient and updating the
network weights and biases.
(2) The validation set, whose error is monitored during the training process because it
tends to increase when data is over fitting.
(3) The test set, whose error can be used to assess the quality of the division of the
dataset.
I randomly assigned 60% of the samples for the training set, 20% to the validation set, and 20% to the test set. The training process stops when one of several conditions is met. For example, in the training considered, the training process stops when the validation error increases for a specified number of iterations (i.e six) or the maximum number of allowed iterations is reached (1000). We can consider moving window size between 5 to 21.
SUPPORT VECTOR MACHINE BASED PROTEIN STRUCTURE PREDICTION:
The support vector machine (SVM) is a most recent technique for data classification and non linear regression. Support vector machine (SVM) is a universal learning machine proposed by Vapnik in the framework of Structural Risk Minimization (SRM) [12].SRM has better generalization ability and is superior to the traditional Empirical Risk Minimization (ERM) principle. In SVM, the results guarantee global minima whereas ERM can only locate local minima. SVM uses a kernel function that satisfies Mercer‟s condition [14] , to map the input data into a high-dimensional feature space, and then construct a linear optimal separating hyper plane in that space. Linear, Gaussian, polynomial and RBF kernels are frequently used in SVMs. Conventional SVMs have properties of global optimization, good adaptability and complete theoretical basis. Gene Classification [5,6] and protein secondary structure prediction [11] in bioinformatics can be solving using SVM.
3.5 SUPPORT VECTOR MACHINE ARCHITECTURE
SVM represents novel learning techniques that have been introduced in the framework of structural risk minimization (SRM) inductive principle and in the theory of VC (Vapnik Chervonenkis) bounds. One of the most important steps in SVM classification systems is the construction of appropriate kernel functions. In the case of linearly separable data, linear kernel is one of the most straightforward choices. There is no need to map data instances into a high-dimensional space.For non-separable data multiclass classification such as RBF and Polynomial kernel are used.. In this context, the hyper plane can be presented as shown in supplementary material. SVM has a
number of interesting properties, including effective avoidance of over fitting, the ability to handle high-dimensional feature spaces shown in Fig.6.1and information condensing of the given data set, etc. Large feature indicate a boundary that maximize the margin between data sample into two classes, therefore give good generalization properties. The decision boundary is defined by the function:
Support Vector machine provides a linear hyper plane. This function is define in equation (6.,it is known as a binary classifier):
3.6 MULTI-CLASS SUPPORT VECTOR MACHINE
Machine learning methods like SVM, NN and kernel methods are most accurate and efficient when dealing with only two classes. For large number of classes higher level multi-class classification methods are developed. Given a set of no separable training data, it is not possible to construct a separating hyper plane without encountering classification errors. Using Multi-class SVM I are solve non-linear problem using one-against-all and all-against-all method.
ONE-AGAINST-ALL
The one-against-all method required unanimity among all SVMs: a data point would be classified under a certain class if and only if that class's SVM accepted it and all other classes' SVMs rejected it. While accurate for tightly clustered classes, this method leaves regions of the feature space undecided where more than one class accepts or all classes reject.The earliest used implementation for SVM multi-class classification is probably the one-against-all method. It constructs K SVM models where k is the number of classes.The i th SVM is trained with all of the examples in the i th class with positive labels, and all other examples with negative labels.
1 T
W X+ =b
1 T
W X+ = −b
0 T
W X+ =b
( , , ) 1
1
min
(
)
(
)
2
(
)
)
1
,
(
),
(
)
)
1
,
(
),
0,
1, 2, ...,
i i i
w b
l
i T i i
j j
i T i i
j j j
i T i i
j j j
i j
w
w
c
w
x
b
if y
i
w
x
b
if y
i
j
l
ξ
+
=ξ
φ(
+
≥ − ξ
=
φ(
+
≤ − − ξ
≠
ξ ≥
=
57
ALL-AGAINST-ALL
The second method is called the all-against-all method. This method constructs K(K-1)/2 classifiers where each one trains data from two classes. For training data from the ℎ and the ℎ classes, we solve the following binary classification problem:
And furthermore, the output class is uniquely generated. In practise, the number of votes for each protein has large variations. The most popularly voted class do not necessarily get maximum possible number of votes; the number of votes for each class tends to decrease gradually from maximum to minimum. This method is also called Max-Win strategy.
4. SIMULATION RESULT AND DISCUSSION
I simulate feed forward Neural Network for prediction of protein secondary structure prediction on three different non-redundant datasets. In implementation, the NN has as inputs the amino acid primary sequence and as output, the three classes i.e., secondary structure (H, E, C) corresponding to each pair of input. In particular, the NN configuration comprises of one hidden layer containing a set
of neurons, and output layer, which has one neuron. For the hidden layers, a sigmoid function is used as the activation function. The output layer has a linear activation function, which allows the NN to approximate any real value. The initialization of the NN weights is done randomly. We have used MATLAB (R2010a) as simulation tool.
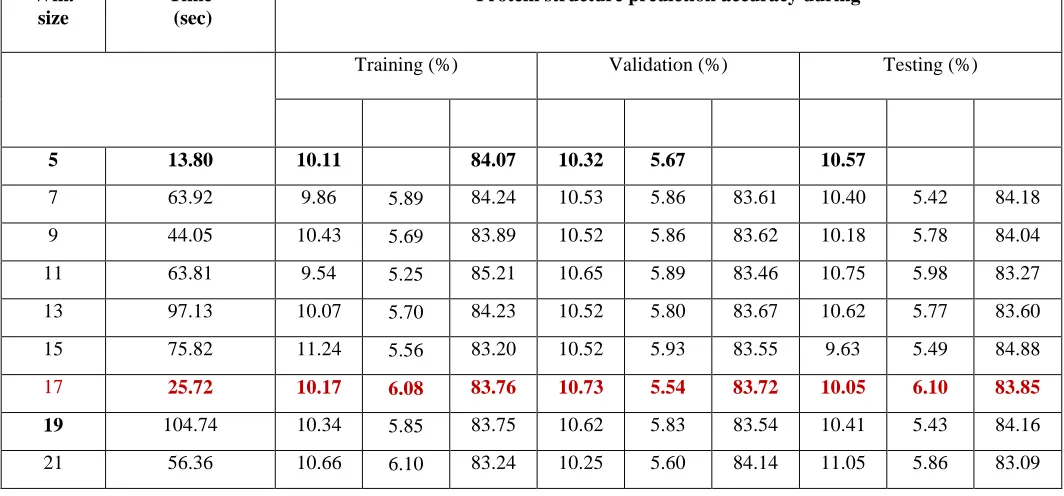
In order to study better prediction accuracy of protein structure for PDB, RS126 and CB513 datasets, we have carried out two experiments to decide optimum value of moving window size, and number of hidden neurons in the hidden layers. In first, I have carried out simulations for different window size in the input of network. The simulation results have been tabulated in Table 3.1-3.3 for window size varies from 5 to 21 on RS126. Respectively CB513 and PDB datasets are used as RS126 So I am not including here.
I simulate Support Vector Machine for prediction of protein secondary structure prediction on three different non-redundant datasets. In implementation, the SVM has as inputs the amino acid primary sequence and as output, the three classes i.e., secondary structure (H, E, C) corresponding to each pair of input. We have used osusvm as simulation tool. In order to study better prediction accuracy of protein structure for PDB, RS126 and CB513 datasets, we have carried out two kernel function RBF kernel and Polynomial kernel.
In first, I have carried out simulations for different kernel methods. The simulation results have been tabulated in Table 6.1 for different kernel function on PDB,
[image:4.595.30.562.492.740.2]RS126 and CB513 datasets, respectively.
Table 2: Simulation results of NN various window size
Win. size
Time (sec)
Protein structure prediction accuracy during
Training (%) Validation (%) Testing (%)
5 13.80 10.11 5.83 84.07 10.32 5.67 84.01 10.57 6.02 83.81
7 63.92 9.86 5.89 84.24 10.53 5.86 83.61 10.40 5.42 84.18
9 44.05 10.43 5.69 83.89 10.52 5.86 83.62 10.18 5.78 84.04
11 63.81 9.54 5.25 85.21 10.65 5.89 83.46 10.75 5.98 83.27
13 97.13 10.07 5.70 84.23 10.52 5.80 83.67 10.62 5.77 83.60
15 75.82 11.24 5.56 83.20 10.52 5.93 83.55 9.63 5.49 84.88
17 25.72 10.17 6.08 83.76 10.73 5.54 83.72 10.05 6.10 83.85
19 104.74 10.34 5.85 83.75 10.62 5.83 83.54 10.41 5.43 84.16 21 56.36 10.66 6.10 83.24 10.25 5.60 84.14 11.05 5.86 83.09
( , , ) 1
1
min
(
)
((
) )
2
(
)
)
1
,
(
),
(
)
)
1
,
(
),
ij ij ij w b
l
ij T ij ij
j t
ij T ij ij
t t t
ij T ij ij
t t j
w
w
c
w
x
b
if y
i
w
x
b
if y
j
ξ
+
=ξ
φ(
+
≥ − ξ
=
φ(
+
≤ − − ξ
=
∑
0
ij t58 Table 3: Simulation results of NN various hidden neurons
Vary hidden neurons
Time (sec)
Protein structure prediction accuracy during
Training (%) Validation (%) Testing (%)
5 24.68 10.38 5.69 83.93 10.68 6.03 83.29 10.61 5.75 83.64
7 5.07 10.32 5.60 83.08 11.70 6.12 82.71 10.30 5.91 83.79
9 36.33 10.60 5.91 83.49 9.86 5.54 84.60 10.77 5.56 83.67
11 30.19 10.39 5.72 83.89 10.98 5.96 83.06 10.28 5.70 84.02
13 20.54 10.62 5.62 83.75 10.47 5.98 83.55 10.09 5.98 83.93
15 28.28 10.93 5.77 83.30 9.42 5.47 85.12 10.24 6.05 83.71
17 31.33 10.68 6.01 83.32 10.05 5.14 84.81 10.35 5.68 83.97
Table 4: Simulation results of SVM various kernel and dataset
Dataset Classification Rate(%)
Protein structure prediction accuracy during
Linear SVM (%) Polynomial SVM (%) RBF SVM (%)
PDB 100 100 100 100 100 100 100 100 100 100
RS126 99.7 99.7 99.7 99.7 100 100 100 100 100 100
CB513 100 100 100 100 100 100 100 100 100 100
5. CONCLSION AND FUTURE WORK
There is a need to study prediction of protein structure in the field of bioinformatics.
I have understood and attempted the problem of secondary structure perdition of protein sequence. For this I consider three identical and independent datasets are PDB, RS126, and CB513. Moreover, this datasets are moderately large enough for simulation study. I perform the simulation task for protein structure prediction using on-line servers, and machine learning techniques (neural network and support vector machine).
Simulation results with neural network classifier give good prediction accuracy with lesser simulation time. With this method, I observed few limitations are good prediction accuracy with limited window size and number of hidden neurons in hidden layer.
Simulation results with support vector machine (SVM) and its linear and nonlinear kernel function gives best prediction accuracy with comparable simulation time. Also multi-class methods: one-against-all, and all-against-all improves higher prediction accuracy with manageable computational cost. When I compare neural network and SVM classification results, I observed and conclude that for all three datasets linear and nonlinear SVM classifier illustrates excellent secondary structure prediction accuracy.
As a part of future scope of work, I suggest the three-dimensional protein structure prediction using these machine learning techniques. Also one can explore more advance techniques such as, hidden markov model (HMM), unsupervised or semisupervised learning techniques,
59
REFERENCES:
[1] Mayuri Patel and Dr. Hitesh Shah,” Protein Secondary Structure Prediction Using Support Vector Machines (SVMs)”.ICMIRA-2013 [2]. Anil Kumar Mandle, Pranita Jain and
Shailendra Kumar Shrivastava, “Protein Structure Prediction Using Support Vector Machine,” International Journal on Soft Computing (IJSC), Vol. 3(1), February 2012. [3]Arthur Zimek, Fabian Buchwald, Eibe Frank,
and Stefan Kramer, “A Study of Hierarchical and Flat Classification Of Proteins,” IEEE/ACM Transactions on Computational Biology and Bioinformatics, vol. 7(3), 2010. [4]. Eghbal G. Mansoori, Mansoor J. Zolghadri and
Seraj D. Katebi, “Protein Superfamily Classification Using Fuzzy Rule-Based Classifier,” IEEE Transactions On Nanobioscience, Vol. 8(1), MARCH 2009. [5]. Jianmin Ma, Minh N. Nguyen, and Jagath C.
Rajapakse, “Gene Classification Using Codon Usage and Support Vector Machines,” IEEE/ACM Transactions on Computational Biology and Bioinformatics,Vol.6(1), JANUARY-MARCH 2009.
[6]. Boyang LI, Liangpeng MA, Jinglu HU and Kotaro HIRASAWA, “Gene Classification Using An Improved SVM Classifier with Soft Decision Boundary,”SICE,2008.
[7]. Robertas Damasevicius, “Analysis of Binary Feature Mapping Rules for Promoter Recognition in Imbalanced DNA Sequence Datasets using Support Vector Machine,” International IEEE Conference "Intelligent Systems",2008.
[8]. Jieyue He , Hae-Jin Hu , Robert Harrison, Phang C. Tai and Yi Pan , “Transmembrane segments prediction and understanding using
support vector machine and decision tree,” Expert Systems with Applications, pp 64-72,2006.
[9]. Mahesh Joshi, Ted Pedersen and Richard Maclin, “A Comparative Study of Support Vector Machines Applied to the Supervised Word Sense Disambiguation Problem in the Medical Domain,” (IICAI-05), December 20-22 2005
[10]. Jung-Ying Wang, “Application of Support Vector Machines in Bioinformatics,”2002. [11]Chries H.Q.Ding and Inna Dubchak,
“Multi-class protein fold recognition using Support Vector Machines and Neural Network,” Bioinformatics, 2001.
[12]. Vladimir N. Vapnik, “An Overview of Statistical Learning Theory,” IEEE Transactions on Neural Networks, Vol.10 (5), September 1999.
[13]. William Noble Grundy ,David Lin,Nello Cristianini,Charles Sugnet,Manuel Ares and Jr.David Haussler, “Support Vector Machine Classification of Microarray Gene Expression Data,” june 12,1989.
[14]. William Noble Grundy ,David Lin,Nello Cristianini,Charles Sugnet,Manuel Ares and Jr.David Haussler, “Support Vector Machine Classification of Microarray Gene Expression Data,” june 12,1989.
[15]. Wolfgang Kabsch And Christian Sander,
“Dictionary of Protein Secondary Structure:
Pattern Recognition of Hydrogen-Bonded and Geometrical Features,”Biopolymers, Vol. 22,pp.:2577-2637,1983.