of Compound Words
Minoru Yoshida1,2 and Hiroshi Nakagawa1,2 1
Information Technology Center, University of Tokyo, 7-3-1 Hongo, Bunkyo-ku, Tokyo 113-0033
2 JST CREST, Honcho 4-1-8, Kawaguchi-shi, Saitama 332-0012
[email protected], [email protected]
Abstract. Many methods of term extraction have been discussed in terms of their accuracy on huge corpora. However, when we try to apply various methods that derive from frequency to a small corpus, we may not be able to achieve sufficient accuracy because of the shortage of statistical information on frequency. This paper reports a new way of extracting terms that is tuned for a very small corpus. It focuses on the structure of compound terms and calculates perplexity on the term unit’s left-side and right-side. The results of our experiments revealed that the accuracy with the proposed method was not that advantageous. However, experimentation with the method combining perplexity and frequency information obtained the highest average-precision in comparison with other methods.
1
Introduction
Term extraction, which is the task of extracting terminology (or technical terms) from a set of documents, is one of major topics in natural language processing. It has a wide variety of applications including book indexing, dictionary generation, and keyword extraction for information retrieval systems.
Most automatic term extraction systems make a sorted list of candidate terms extracted from a given corpus according to the “importance” scores of the terms, so they require scores of “importance” for the terms. Existing scores include TF-IDF, C-Value [1], and FLR [9]. In this paper, we propose a new method that involves revising the definition of the FLR method in a more sophisticated way. One of the advantages of the FLR method is its size-robustness, i.e, it can be applied to small corpus with less significant drop in performance than other standard methods like TF and IDF, because it is defined using more fine-grained features called term units. Our new method, called FPP, inherit this property while exhibiting better performance than FLR.
At the same time, we also propose a new scheme for evaluating term ex-traction systems. Our idea is to use summaries1 of articles as a gold standard. This strategy is based on the assumption that summaries of documents can
1
In more detail, an article revised for display on mobile phones.
R. Dale et al. (Eds.): IJCNLP 2005, LNAI 3651, pp. 269–279, 2005. c
serve as collections of important terms because, in writing summaries, peo-ple may make an original document shorter by dropping unnecessary parts of original documents, while retaining essential fragments. Thus, we regard a term in an original document to be important if it also appears in the summary.
2
Term Extraction
Term extraction is the task of extracting important terms from a given corpus. Typically, term extraction systems first extractterm candidates, which are usu-ally the noun phrases detected by handcrafted POS sequence patterns, from the corpus. After that, term candidates are sorted according to some importance score. Important terms, (i.e., terms that appear in the summary, in our problem setting,) are desired to be ranked higher than others. In this paper we focus on the second step, i.e., term candidate sorting by importance scores. We pro-pose a new score of term importance by modifying an existing one in a more sophisticated manner.
In the remainder of this paper, a term candidate is represented byW =w1w2 · · ·wnwherewirepresents aterm unitcontained inW, andnis the number of term units contained inW. Here,a term unitis the basic element comprising term can-didates that is not further decomporsable without destruction of meaning. Term units are used to calculate of the LR score that is explained in the next section.
3
Related Work
Many methods of term scoring have been proposed in the literature [7] [3] [4]. Methods that use corpus statistics have especially emerged over the past decade due to the increasing number of machine-readable documents such as news arti-cles and WWW documents. These methods can be mainly categorized into the following three types according to what types of features are used to calculate the scores.
– Measurement by frequencies
– Measurement by internal structures of term candidates – Combination of the above
3.1 Score by Frequency: TF
Frequency is one of the most basic features of term extraction. Usually, a term that appears frequently is assumed to be important. We introduce a score of this type:tf(W).
termnaturaleven if it is merely part of another phrase such asnatural language processing.2
3.2 Score by Internal Structures in Term Candidates: LR
An LR method [9] is based on the intuition that some words are used as term units more frequently than others, and a phrase that contains such “good” term units is likely to be important. The left scorel(wi) of each term unitwiof a target term is defined as the number (or the number of types) of term units connected to the left ofwi(i.e., appearing just in the left ofwiin term candidates), and the right scorer(wi) is defined in the same manner.3An LR scorelr(wi) is defined as the geometric mean of left and right scores:
lr(wi) =
l(wi)r(wi)
The total LR score ofW is defined as a geometric mean of the scores of term units as:
LR(W) = (lr(w1)lr(w2)· · ·lr(wn)) 1 n.
An example of LR score calculation is given in the next section.
3.3 Mixed Measures
C-Value. C-Value[1] is defined by the following two expressions: t(W): frequency of terms that containW,
c(W): number of types of terms that containW.
Note thatt(W) does not countW itself. Intuitively,t(W) is the degree of being part of another term, andc(W) is the degree of being part of various types of terms.
C-Value is defined by using these two expressions in the following way. c-val(W) = (n−1)×
tf(W)−t(W) c(W)
Note that the value is zero wheren= 1. MC-Value [9] is a modified version of C-Value adapted for use in term collections that include the term of length 1 (i.e.,n= 1).
MC-val(W) =n×
tf(W)−t(W) c(W)
We used MC-Value in the experiments because our task was to extract terms regardless of whether each term is one-word term or not.
2
We can also use another frequency score F(Frequency), orf(W), that is defined as the number ofindependentoccurrences ofW in all documents. (Independentmeans that W is not included in any larger term candidate.) However, we observed that
f(W) (or the combination off(W) and another score) had no advantage overtf(W) (or the combination oftf(W) and another score) in the experiments,so in this paper we omit scores that are the combination off(W) and other scores.
3 In addition, we apply the adding-one smoothing to both of them to avoid the score
FLR. The LR method reflects the number of appearances of term units, but does not reflect that of a whole term itself. For example, even if “natural language” is more frequent than “language natural” and the former should be given a higher score than the latter, LR cannot be used to do this.
An FLR method [9] was proposed to overcome this shortcoming of LR. It reflects both the frequencies and inner structures of terms. F LR(W) is defined as the product ofLR(W) andtf(W) as:
F LR(W) =tf(W)LR(W).
4
Our Method: Combining Types and Frequencies via
Entropy
4.1 Preliminaries: Token-LR and Type-LR
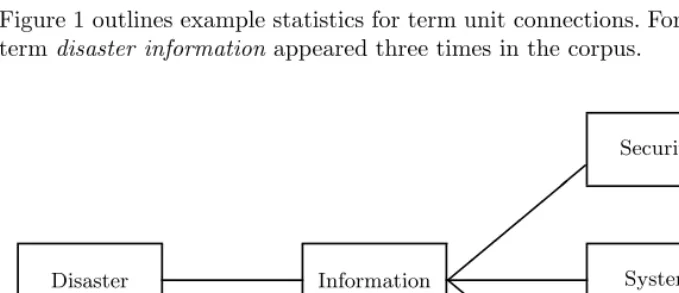
Figure 1 outlines example statistics for term unit connections. For example, the termdisaster informationappeared three times in the corpus.
Disaster
3 times
Information
Ethics 2 times System 1 times Security 3 times
,,
,,
,,
l l
l l
ll
Fig. 1.An example of statistics for term unit connections
LR scores have two versions: Token-LR and LR. Token-LR (and Type-LR) are calculated by simply counting the frequency (and the types) of terms connected to each term unit, respectively. In this case, a Type-LR score for the term unit “information” is
l(inf ormation) = 1 + 14, r(inf ormation) = 3 + 1, LR(inf ormation) =√8, and a Token-LR score is
l(inf ormation) = 3 + 1, r(inf ormation) = 6 + 1, LR(inf ormation) =√28. 4
Type-LR cannot reflect frequencies which suggest whether there are spe-cially importantconnecting terms or not. However, Token-LR cannot reflect the number of types that suggest the variety of connections. To solve these short-comings with LR measures, we propose a new kind that combines these two throughperplexity.
4.2 Term Extraction by Perplexity
Our method is based on the idea of perplexity [8]. The score of a term is defined by theleft perplexityandright perplexity of its term units. In this subsection we first give a standard definition of the perplexity of language, from which our left and right perplexity measures are derived. After that, we describe how to score terms by using these perplexities.
Perplexity of language. Assume that languageLis information source that produces word lists of length n and each word list is produced independently with probabilityP(wn
1). Then, the entropy of languageLis calculated as: H0(L) =−
wn 1
P(w1n) logP(wn1).
The entropy per word is then calculated as:
H(L) =−1 n
wn 1
P(wn1) logP(w1n).
This value indicates the number of bits needed to express each word generated fromL. Perplexity of languageLis defined usingH(L) as:
P erplexity= 2H(L).
Perplexity can be seen as the average number of types of words that follow each preceding word. The larger the perplexity of L, the less predictable the word connection inL.
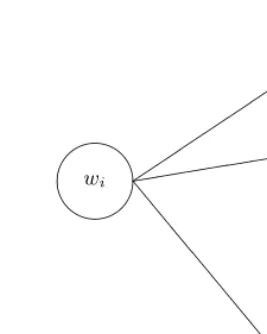
Left and right perplexity. Assume thatktypes of unit words can connect to the right ofwi (see Figure 2).
Also assume thatRiis a random variable assigned to thei-th term unit which represents its right connections and takes its value from the set{r1, r2,· · ·, rk}. Then, entropyH(Ri) is calculated as:
H(Ri) =− k
j=1
P(rj) log2P(rj)
Fig. 2.Example of term unit and term units connected to its right
This entropy value can be thought of as a variety of terms that connect to the right ofwi, or, more precisely, the number of bits needed to describe words that connect to the right ofwi.
Then right perplexityppr(wi) of term unitwi is defined as
ppr(wi) = 2H(R i)
.
This value can be seen as the number of branches, in the sense of information theory, of right-connection fromwi. It naturally reflects both the frequency and number of types of each connection between term units.
Random variableLi for the left connections is defined in the same manner. The perplexity for left connections is thus defined as:
ppl(wi) = 2H(L i)
.
Term Score by Perplexity. We define our measure by substituting l and r in the definition of LR with ppl andppr. First, a combination of left and right perplexities is defined as the geometric mean of both:
pp(wi) = (ppl(wi)·ppr(wi)) 1 2.
We used logP P(W) instead of P P(W) to make implementation easier. Notice that logxis a monotonic (increasing) function ofx.
P P(W) =
The right side means the sum of the left and right entropies of all term units.
4.3 Term Extraction by Perplexity and TF
Perplexity itself serves as a good score for terms, but combining it with TF, which is a measure from another point of view, can provide a still better score that reflects both the inner structures of term candidates and their frequencies which are regarded as global information about the whole corpus.
Our new score,F P P(W), which is a combination of PP and TF, is defined by applying the adding-one smoothing totf(W). Therefore, the above defi-nition of logF P P(W) changed as follows:
5 This situation occurs when we want to score a new term candidate from outside of
5
Experiments
5.1 Test Collection
We collected news articles and their summaries from the Mainichi Web News from April, 2001 to March, 2002. The articles were categorized into four genres: Economy, Society, World, and Politics. A shorter version of each article was provided for browsing on mobile phones. Articles for mobile phones were written manually from the original ones, which were shorter versions of the original articles adapted to small displays. We regard them as summaries of the original articles and used them to evaluate whether the extracted terms were correct or not. If a term in the original article was also in the summary, the term was correct, and incorrect if otherwise. Each article had a size of about 300 letters and each summary had a size of about 50.
Table 1 lists the number of articles in each category. Table 1.Number of articles in test collection
Economy Society World Politics
#of articles 4,177 5,952 6,153 4,428
5.2 Experimental Setup
We used test data on the various numbers of articles to investigate how the performance of each measure changed according to corpus size. A corpus of each size was generated by singly adding an article randomly selected from the corpus of each genre. We generated test data consisting of 50 different sizes (from 1 to 50) for each genre. The average number of letters in the size 50 corpus was about 19,000, and the average number of term candidates was about 1,300. We used five different seed numbers to randomly select articles. The performance of each method was evaluated in terms of recall and precision, which were averaged over the five trials.
5.3 Preprocessing: Term Candidate Extraction
Each article was preprocessed with a morphological analyzer, the Chasen 2.3.3.[2] The output of Chasen was further modified according to heuristic rules as follows. – Nouns and undefined words were extracted for further processes and other
words were discarded.
– Suffixes and prefixes were concatenated to their following and preceding words, respectively.
The result was a set of term candidates to be evaluated with the term importance scores described in the previous sections.
5.4 Evaluation Method
We used average precision [8] for the evaluation. LetD be a set of all the term candidates andDq⊆Dbe a set of the correct ones among them. The extracted term was correct if it appeared in the summary. Then, the average precision can be calculated in the following manner.
Average-Precision = 1 |Dq|
1≤k≤|D| ⎧ ⎨ ⎩rk×
⎛ ⎝1
k
1≤i≤k ri
⎞ ⎠
⎫ ⎬ ⎭
whereri= 1 if thei-th term is correct, andri = 0 if otherwise.
Note that the total number of correct answers was |Dq|. The next section presents the experimental results obtained by average precision.
Table 2. Average precision on corpus of 1, 10, and 50 articles. Each cell contains results for the Economy/World/Society/Politics genres.
Measure SIZE=1 SIZE=10 SIZE=50
F 0.275/0.274/0.246/0.406 0.337/0.350/0.325/0.378 0.401/0.415/0.393/0.425 TF 0.305/0.388/0.281/0.430 0.386/0.406/0.376/0.435 0.454/0.462/0.436/0.477 DF 0.150/0.173/0.076/0.256 0.237/0.253/0.234/0.294 0.337/0.357/0.332/0.378 LR 0.192/0.370/0.194/0.378 0.255/0.280/0.254/0.317 0.303/0.302/0.273/0.320 MC-Val 0.218/0.296/0.240/0.388 0.317/0.334/0.307/0.365 0.399/0.400/0.369/0.420 FLR 0.305/0.410/0.298/0.469 0.361/0.397/0.364/0.429 0.423/0.435/0.404/0.455 TF-IDF 0.150/0.173/0.076/0.256 0.388/0.407/0.376/0.437 0.457/0.465/0.438/0.479 PP 0.223/0.327/0.285/0.514 0.285/0.299/0.282/0.331 0.329/0.317/0.279/0.331 FPP’ 0.320/0.457/0.380/0.561 0.407/0.444/0.409/0.471 0.487/0.480/0.448/0.493
6
Results and Discussion
Table 2 shows the results on the corpus of 1, 10, and 50 articles in all the gen-res. Figure 3 plots the average precision for each corpus size (from 1 to 50) in the economy category.6 In some cases, results on one article were better than those on 10 and 50 articles. This was mainly caused by the fact that the av-erage precision is tend to be high on articles of short length, and the avav-erage length for one article was much shorter than that of ten articles in some genres. PP outperformed LR in most cases. We think the reason was that PP could provide more precious information about connections among term units. We ob-served that PP depended less on the size of the corpus than frequency-based methods like TF and MC-Val. FPP’ had the best performance of all methods in all genres.
6 We only show a graph in the economy genre, but the results in other genres were
0.1 0.2 0.3 0.4 0.5
1 11 21 31 41
Corpus size (# of articles) Av
er ag e pr ec is io n
F TF DF
LR MC-Val FLR
TF-IDF PP FPP'
Fig. 3.Results in economy genre
0.3 0.4 0.5 0.6
50 150 250 350 450 550 650 750 850 950
Corpus size (# of articles) Av
er ag e pr ec isi on
F TF DF
LR MC-Val FLR
TF-IDF PP FPP'
Figure 4 plots the results in the economy genre when the corpus size was increased to 1,000 in increments of 50 articles. We observed that the perfor-mance of PP and LR got close with the increase in corpus size, especially with 200 articles and more. FPP’ once again outperformed all the other methods in this experiment. The FPP’ method exhibited the best performance regardless of corpus size.
7
Conclusion and Future Work
We proposed a new method for extracting terms. It involved the combination of two LR methods: Token-LR and Type-LR. We showed that these two could be combined by using the idea of perplexity, and gave a definition for the combined method. This new method was then combined with TF and experimental results on the test corpus consisting of news articles and their summaries revealed that the new method (FPP’) outperformed existing methods including TF, TF-IDF, MC-Value, and FLR.
In future work, we would like to improve the performance of the method by, for example, adding preprocessing rules, such as the appropriate treatment of numerical characters, and developing more sophisticated methods for combin-ing TF and PP. We also plan to extend our experiments to include other test collections like TMREC [6].
References
1. Ananiadou, S.: A methodology for automatic term recognition. In Proceedings of the 15th InternationalConference on Computational Linguistcs (COLING) (1994), pp. 1034–1038.
2. Asahara, M., Matsumoto, Y.: Extended Models and Tools for High-performance Part-of-Speech Tagger. Proceedings of COLING 2000. (2000).
3. COMPUTERM’98 First Workshop on Computational Terminology. (1998). 4. COMPUTERM’02 Second Workshop on Computational Terminology. (2002). 5. Frantzi, K. and Ananiadou, S.: The C-value/NC-value method for ATR. Journal of
NLP, Vol. 6, No. 3, (1999). pp.145–179.
6. Kageura, K.: TMREC Task: Overview and Evaluation. Proc. of the First NTCIR Workshop on Research in Japanese Text Retrieval and Term Recognition, (1999). pp. 411–440.
7. Kageura, K and Umino, B.: Methods of automatic term recognition: A review. Terminology, Vol. 3, No. 2, (1996). pp. 259–289.
8. Manning, C.D., and Schutze, H..: Foundations of Statistical Natural Language Pro-cessing. (1999). The MIT Press.