Evaluating DUC 2004 Tasks with the QARLA Framework
Enrique Amig´o, Julio Gonzalo, Anselmo Pe˜nas, Felisa Verdejo Departamento de Lenguajes y Sistemas Inform´aticos
Universidad Nacional de Educaci´on a Distancia c/Juan del Rosal, 16 - 28040 Madrid - Spain
{enrique,julio,anselmo,felisa}@lsi.uned.es
Abstract
This papers reports the application of the QARLA evaluation framework to the DUC 2004 testbed (tasks 2 and 5). Our experiment addresses two issues: how well QARLA evaluation measures corre-late with human judgements, and what ad-ditional insights can be provided by the QARLA framework to the DUC evalua-tion exercises.
1 Introduction
QARLA (Amig´o et al., 2005) is a framework that uses similarity to models as a building block for the evaluation of automatic summarisation systems. The input of QARLA is a summarisation task, a set of test cases, a set of similarity metrics, and sets of models and automatic summaries (peers) for each test case. With such a testbed, QARLA provides:
• A measure, QUEEN, which combines assorted similarity metrics to estimate the quality of au-tomatic summarisers.
• A measure, KING, to select the best combina-tion of similarity metrics.
• An estimation, JACK, of the reliability of the testbed for evaluation purposes.
The QARLA framework does not rely on human judges. It is interesting, however, to find out how well an evaluation using QARLA correlates with hu-man judges, and whether QARLA can provide ad-ditional insights into an evaluation based on human assessments.
In this paper, we apply the QARLA framework (QUEEN, KING and JACK measures) to the out-put of two different evaluation exercises: DUC 2004 tasks 2 and 5 (Over and Yen, 2004). Task 2 re-quires short (one-hundred word) summaries for as-sorted document sets; Task 5 consists of generating a short summary in response to a “Who is” question. In Section 2, we summarise the QARLA evalua-tion framework; in Secevalua-tion 3, we describe the sim-ilarity metrics used in the experiments. Section 4 discusses the results of the QARLA framework us-ing such metrics on the DUC testbeds. Finally, Sec-tion 5 draws some conclusions.
2 The QARLA evaluation framework
QARLA uses similarity to models for the evalua-tion of automatic summarisaevalua-tion systems. Here we summarise its main features; the reader may refer to (Amig´o et al., 2005) for details.
The input of the framework is:
• A summarisation task (e.g. topic oriented, in-formative multi-document summarisation on a given domain/corpus).
• A setT of test cases (e.g. topic/document set pairs for the example above)
• A set of summaries M produced by humans (models), and a set of automatic summaries A (peers), for every test case.
• A setXof similarity metrics to compare sum-maries.
2.1 QU EEN: Estimating the quality of an automatic summary
QUEEN operates under the assumption that a sum-mary is better if it is closer to the model summaries according to all metrics; it is defined as the probabil-ity, measured onM×M×M, that for every metric inX the automatic summaryais closer to a model than two models to each other:
QUEENX,M(a)≡P(∀x∈X.x(a, m)≥x(m
0
, m00))
where a is the automatic summary being eval-uated, hm, m0, m00i are three models in M, and x(a, m)stands for the similarity ofmtoa. QUEEN is stated as a probability, and therefore its range of values is[0,1].
We can think of the QUEEN measure as using a set of tests (every similarity metric inX) to falsify the hypothesis that a given summary ais a model. Givenha, m, m0, m00i, we testx(a, m)≥x(m0, m00) for each metricx. ais accepted as a model only if it passes the test for every metric. QUEEN(a) is, then, the probability of acceptance forain the sam-ple spaceM×M×M.
This measure has some interesting properties: (i)
it is able to combine different similarity metrics into a single evaluation measure; (ii) it is not af-fected by the scale properties of individual metrics, i.e. it does not require metric normalisation and it is not affected by metric weighting. (iii) Peers which are very far from the set of models all receive QUEEN=0. In other words, QUEEN does not distin-guish between very poor summarisation strategies.
(iv) The value of QUEEN is maximised for peers that “merge” with the models under all metrics inX.
(v)The universal quantifier on the metric parameter ximplies that adding redundant metrics do not bias the result of QUEEN.
Now the question is: which similarity metrics are adequate to evaluate summaries? Imagine that we use a similarity metric based on sentence co-selection; it might happen that humans do not agree on which sentences to select, and therefore emulat-ing their sentence selection behaviour is both easy (nobody agrees with each other) and useless. We need to take into account which are the features that
human summaries do share, and evaluate according to them. This is provided by the KING measure.
2.2 KIN G: estimating the quality of similarity metrics
The measure KINGM,A(X)estimates the quality of
a set of similarity metrics X using a set of models M and a set of peers A. KING is defined as the probability that a model has higher QUEEN value than any peer in a test sample. Formally:
KINGM,A(X)≡
P(∀a∈A,QUEENM,X(m)>QUEENM,X(a))
For example, an ideal metric -that puts all models together-would give QUEEN(m) = 1for all mod-els, and QUEEN(a) = 0for all peers which are not put together with the models, obtaining KING= 1.
KING satisfies several interesting properties: (i) KING does not depend on the scale properties of the metric; (ii) Adding repeated or very similar peers do not alter the KING measure, which avoids one way of biasing the measure. (iii) the KING value of random and constant metrics is zero or close to zero.
2.3 JACK: reliability of the peer set
Once we detect a difference in quality between two summarisation systems, the question is now whether this result is reliable. Would we get the same results using a different test set (different examples, differ-ent human summarisers (models) or differdiffer-ent base-line systems)?
The first step is obviously to apply statistical sig-nificance tests to the results. But even if they give a positive result, it might be insufficient. The problem is that the estimation of the probabilities in KING assumes that the sample setsM, A are not biased. If M, A are biased, the results can be statistically significant and yet unreliable. The set of examples and the behaviour of human summarisers (models) should be somehow controlled either for homogene-ity (if the intended profile of examples and/or users is narrow) or representativity (if it is wide). But how to know whether the set of automatic summaries is representative and therefore is not penalising certain automatic summarisation strategies?
JACK(X, M, A)≡P(∃a, a0∈A| ∀x∈X.x(a, a0)≤x(a, m)∧x(a0, a)≤x(a0, m)∧
QUEEN(a)>0∧QUEEN(a0)>0)
i.e. the probability over all model summariesmof finding a couple of automatic summariesa, a0which are closer to m than to each other according to all metrics. This measure satisfies three desirable prop-erties: (i) it can be enlarged by increasing the sim-ilarity of the peers to the models (the x(m, a) fac-tor in the inequalities), i.e. enhancing the quality of the peer set; (ii) it can also be enlarged by decreas-ing the similarity between automatic summaries (the x(a, a0)factor in the inequality), i.e. augmenting the diversity of (independent) automatic summarisation strategies represented in the test bed; (iii) adding el-ements to A cannot diminish the JACK value, be-cause of the existential quantifier ona, a0.
3 Selection of similarity metrics
Each different similarity metric characterises differ-ent features of a summary. Our first objective is to select the best set of metrics, that is, the metrics which best characterise the human summaries (mod-els) as opposed to automatic summaries. The second objective is to obtain as much information as possi-ble about the behaviour of automatic summaries.
In this Section, we begin by describing a set of 59 metrics used as a starting point. Some of them provide overlapping information; the second step is then to select a subset of metrics that minimises re-dundancy and, at the same time, maximises quality (KING values). Finally, we analyse the characteris-tics of the selected metrics.
3.1 Similarity metrics
For this work, we have considered the following similarity metrics:
ROUGE based metrics (R): ROUGE (Lin and Hovy, 2003) estimates the quality of an au-tomatic summary on the basis of the n-gram coverage related to a set of human summaries (models). Although ROUGE is an evaluation metric, we can adapt it to behave as a sim-ilarity metric between pairs of summaries if
we consider only one model in the computa-tion. There are different kinds of ROUGE met-rics such as W, L, ROUGE-1, ROUGE-2, ROUGE-3, ROUGE-4, etc. (Lin, 2004b). Each of these metrics has been ap-plied over summaries with three preprocessing options: with stemming and stopword removal (type c); only with stopwords removal (type b); or without any kind of preprocessing (type a). All these combinations give 24 similarity met-rics based on ROUGE.
Inverted ROUGE based metrics (Rpre): ROUGE metrics are recall oriented. If we reverse the di-rection of the similarity computation, we obtain precision oriented metrics (i.e. Rpre(a, b) = R(b, a)). In this way, we generate another 24 metrics based on inverted ROUGE.
TruncatedVectModel (TVMn): This family of
met-rics compares the distribution of the n most relevant terms from original documents in the summaries. The process is the following: (1) obtaining thenmost frequent lemmas ignoring stopwords; (2) generating a vector with the rel-ative frequency of each term in the summary; (3) calculating the similarity between two vec-tors as the inverse of the Euclidean distance. We have used 9 variants of this measure with n= 1,4,8,16,32,64,128,256,512.
AveragedSentencelengthSim (AVLS): This is a very simple metric that compares the average length of the sentences in two summaries. It can be useful to compare the degree of abstraction of the summaries.
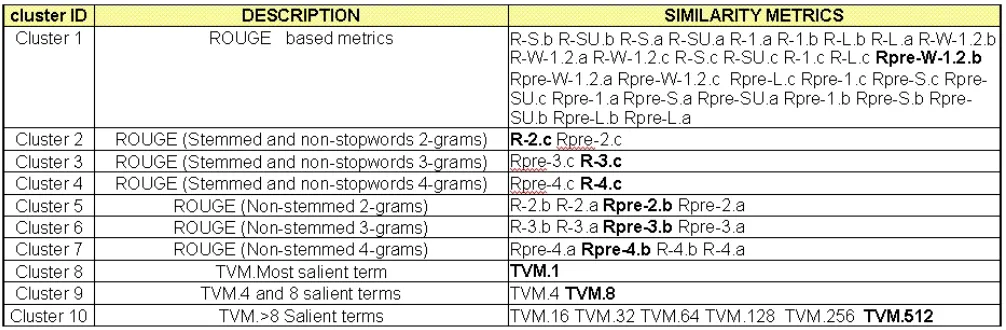
Figure 1: Similarity Metric Clusters
3.2 Clustering similarity metrics
From the set of metrics described above we have 57 (24+24+9) content oriented metrics, plus two met-rics based on stylistic features (AVLS and GRAM-SIM). However, the 57 metrics characterising sum-mary contents are highly redundant. Thus, cluster-ing similar metrics seems desirable.
We perform an automatic clustering process us-ing the followus-ing notion of proximity between two metric sets:
sim(X, X0)≡P rob[H(X)↔H(X0)]
where H(X)≡ ∀x∈X.x(a, m)≥x(m0, m00)
Two metrics sets are similar, according to the for-mula, if they behave similarly with respect to the QU EEN condition (H predicate in the formula), i.e. the probability that the two sets of metrics dis-criminate the same automatic summaries when they are compared to the same pair of models.
Figure 1 shows the clustering of similarity met-rics for the DUC 2004 Task 2. The number of clus-ters was fixed in 10. After the clustering process, the 48 ROUGE metrics are grouped in 7 sets, and the 9 TVM metrics are grouped in 3 sets. In each clus-ter, the metric with highest KING has been marked in boldface. Note that the ROUGE-c metrics (with stemming) with highest KING are those based on re-call whereas the ROUGE-a/b metrics (without stem-ming) are those based on precision. Regarding TVM clusters, the metrics with highest KING in each clus-ter are those based on a higher number of clus-terms.
Finally, we select the metric with highest KING in each group, obtaining the 10 most representative metrics.
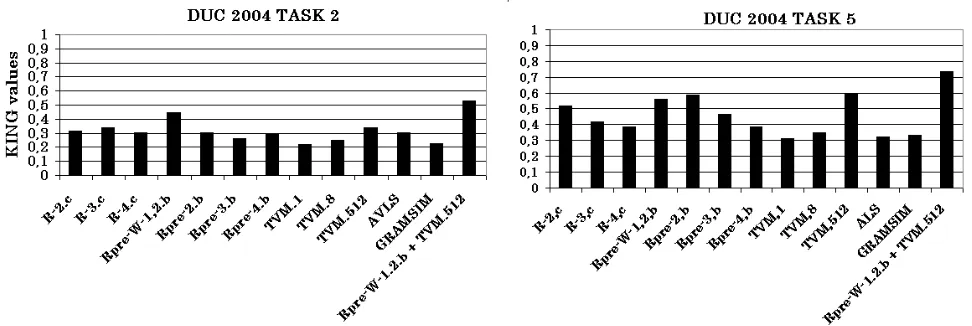
3.3 Best evaluation metric: KING values
Figure 2 shows the KING values for the selected similarity metrics, which represent how every metric characterises model summaries as opposed to auto-matic summaries. These are the main results:
• The last column shows the best metric set, considering all possible metric combinations. In both DUC tasks, the best combination is {Rpre-W-1.2.b,TVM.512. This metric set gets better KING values than any individual metric in isolation (17% better than the second best for task 2, and 23% better for task 5). This is an in-teresting result confirming that we can improve our ability to characterise human summaries just by combining standard similarity metrics in the QARLA framework. Note also that both metrics in the best set are content-oriented.
Figure 2: Similarity Metric quality
• TVM metrics get higher values when consid-ering more terms (TVM.512), confirming that comparing with just a few terms (e.g. TVM.4) is not informative enough.
• Overall, KING values are higher for task 5, suggesting that there is more agreement between human summaries in topic-oriented tasks.
3.4 Reliability of the results
The JACK measure estimates the reliability of QARLA results, and is correlated with the diversity of automatic summarisation strategies included in the testbed. In principle, the larger the number of au-tomatic summaries, the higher the JACK values we should obtain. The important point is to determine when JACK values tend to stabilise; at this point, it is not useful to add more automatic summaries with-out introducing new summarisation strategies.
Figure 3 shows how J ACKRpre-W,TVM.512 values
grow when adding automatic summaries. For more than 10 systems, JACK values grow slower in both tasks. Absolute JACK values are higher in Task 2 than in task 5, indicating that systems tend to pro-duce more similar summaries in Task 5 (perhaps be-cause it is a topic-oriented task). This result suggests that we should incorporate more diverse summarisa-tion strategies in Task 5 to enhance the reliability of the testbed for evaluation purposes with QARLA.
4 Evaluation of automatic summarisers: QUEEN values
The QUEEN measure provides two kinds of infor-mation to compare automatic summarisation sys-tems: which are the best systems -according to the best metric set-, and which are the individual fea-tures of every automatic summariser -according to individual similarity metrics-.
4.1 System ranking
The best metric combination for both tasks was {Rpre-W,TVM.512}; therefore, our global system evaluation uses this combination of content-oriented metrics. Figure 4 shows the QUEEN{Rpre-W,TVM.512} values for each participating system in DUC 2004, also including the model summaries. As expected, model summaries obtain the highest QUEEN values in both DUC tasks, with a significant distance with respect to the automatic summaries.
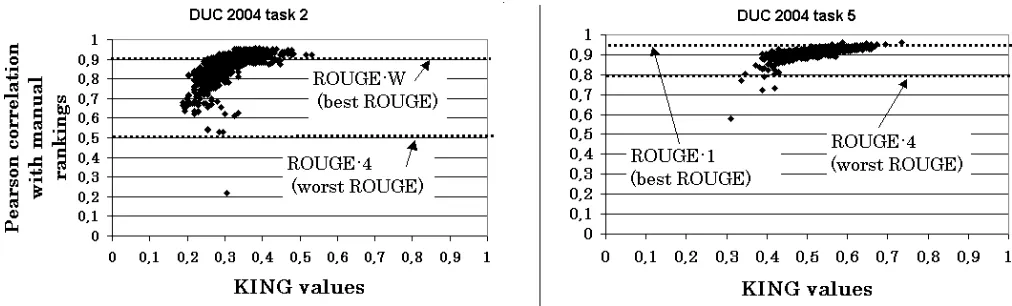
4.2 Correlation with human judgements
The manual ranking generated in DUC is based on a set of human-produced evaluation criteria, whereas the QARLA framework gives more weight to the as-pects that characterise model summaries as opposed to automatic summaries. It is interesting, however, to find out whether both evaluation methodologies are correlated. Indeed, this is the case: the Pearson correlation between manual and QUEEN rankings is 0.92 for the Task 2 and 0.96 for the Task 5.
Figure 3: JACK vs. Number of Automatic Summaries
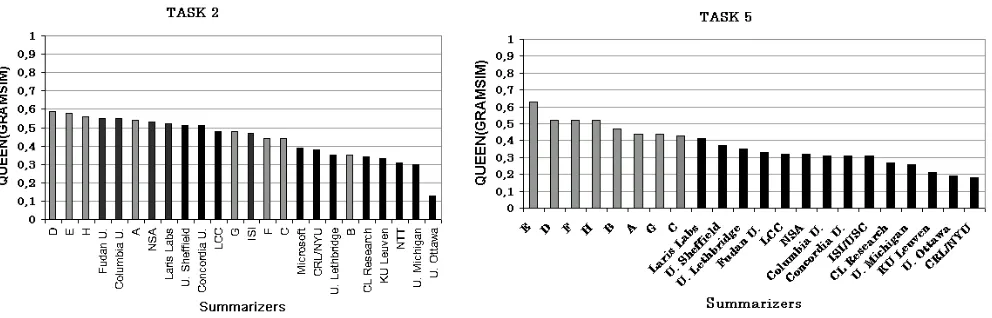
Figure 4: QUEEN system ranking for the best metric set (A-H are models)
Figure 6: QUEEN values over GRAMSIM
metrics with higher KING values lead to QUEEN rankings more similar to human judgements. Fig-ure 5 shows the Pearson correlation between man-ual and QUEEN rankings for 1024 metric combina-tions with different KING values. The figure con-firms that higher KING values are associated with rankings closer to human judgements.
4.3 Stylistic features
The best metric combination leaves out similarity metrics based on stylistic features. It is interesting, however, to see how automatic summaries behave with respect to this kind of features. Perhaps the most remarkable fact about stylistic similarities is that, in the case of the GRAMSIM metric, task 2 and task 5 exhibit a rather different behaviour (see Figure 6). In task 2, systems merge with the models, while in task 5 the QUEEN values of the systems are inferior to the models. This suggests that there is some stylistic component in models that systems are not capturing in the topic-oriented task.
5 Related work
The methodology which is closest to our frame-work is ORANGE (Lin, 2004a), which evaluates a similarity metric using the average ranks obtained by reference items within a baseline set. As in our framework, ORANGE performs an automatic meta-evaluation, there is no need for human assess-ments, and it does not depend on the scale properties of the metric being evaluated (because changes of scale preserve rankings). The ORANGE approach
is, indeed, intimately related to the original QARLA measure introduced in (Amigo et al., 2004).
There are several approaches to the automatic evaluation of summarisation and Machine Transla-tion systems (Culy and Riehemann, 2003; Coughlin, 2003). Probably the most significant improvement over ORANGE is the ability to combine automati-cally the information of different metrics. Our im-pression is that a comprehensive automatic evalua-tion of a summary must necessarily capture different aspects of the problem with different metrics, and that the results of every individual checking (metric) should not be combined in any prescribed algebraic way (such as a linear weighted combination). Our framework satisfies this condition.
ORANGE, however, has also an advantage over the QARLA framework, namely that it can be used for evaluation metrics which are not based on sim-ilarity between model/peer pairs. For instance, ROUGE can be applied directly in the ORANGE framework without any reformulation.
6 Conclusions
The application of the QARLA evaluation frame-work to the DUC testbed provides some useful in-sights into the problem of evaluating text summari-sation systems:
• The results show that a combination of simi-larity metrics behaves better than any metric in isolation. The best metric set is{Rpre-W,TVM.512},
Un-surprisingly, stylistic similarity is less useful for evaluation purposes.
• The evaluation provided by QARLA correlates well with the rankings provided by DUC hu-man judges. For both tasks, metric sets with higher KING values slightly outperforms the best ROUGE evaluation measure.
• QARLA measures show that DUC tasks 2 and 5 are quite different in nature. In Task 5, human summaries are more similar, and the automatic summarisation strategies evaluated are less di-verse.
Acknowledgements
We are indebted to Ed Hovy, Donna Harman, Paul Over, Hoa Dang and Chin-Yew Lin for their inspir-ing and generous feedback at different stages in the development of QARLA. We are also indebted to NIST for hosting Enrique Amig´o as a visitor and for providing the DUC test beds. This work has been partially supported by the Spanish government, project R2D2 (TIC-2003-7180).
References
E. Amig´o, J. Gonzalo, A. Pe˜nas, and F. Verdejo. 2005. QARLA: a Framework for the Evaluation of Text Summarization Systems. InProceedings of the 43rd Annual Meeting of the Association for Computational Linguistics (ACL 2005).
E. Amigo, V. Peinado, J. Gonzalo, A. Pe˜nas, and F. Verdejo. 2004. An Empirical Study of Information Synthesis Tasks. In Proceedings of the 42th Annual Meeting of the Association for Computational Linguis-tics (ACL), Barcelona, July.
Deborah Coughlin. 2003. Correlating Automated and Human Assessments of Machine Translation Quality. InIn Proceedings of MT Summit IX, New Orleans,LA.
Christopher Culy and Susanne Riehemann. 2003. The Limits of N-Gram Translation Evaluation Metrics. In
Proceedings of MT Summit IX, New Orleans,LA.
C. Lin and E. H. Hovy. 2003. Automatic Evaluation of Summaries Using N-gram Co-ocurrence Statistics. In
Proceeding of 2003 Language Technology Conference (HLT-NAACL 2003).
C. Lin. 2004a. Orange: a Method for Evaluating Au-tomatic Metrics for Machine Translation. In Pro-ceedings of the 36th Annual Conference on Compu-tational Linguisticsion for CompuCompu-tational Linguistics (Coling’04), Geneva, August.
Chin-Yew Lin. 2004b. Rouge: A Package for Auto-matic Evaluation of Summaries. In Marie-Francine Moens and Stan Szpakowicz, editors,Text Summariza-tion Branches Out: Proceedings of the ACL-04 Work-shop, pages 74–81, Barcelona, Spain, July. Associa-tion for ComputaAssocia-tional Linguistics.