SHIN, YONGHEE. Investigating Complexity Metrics as Indicators of Software Vulnerability. (Under the direction of Laurie Williams.)
A single exploited software vulnerability can cause severe damage to an organization legally and financially. Early detection of software vulnerabilities can prevent the damage caused by late detection. Security experts claim that complexity is the enemy of security. A complex software system is difficult to understand, maintain, and test by software engineers resulting in errors in code including vulnerabilities. As a result, finding metrics that can measure software complexity and can point toward the code locations that are likely to have vulnerabilities early in the development life cycle is beneficial.
development history as indicators of vulnerabilities.
This research improves our understanding on the relationship between software complexity and vulnerability, contributing to the body of empirical knowledge as follows:
This research provides empirical evidence that complexity metrics can indicate vulnerable code locations.
This research provides empirical evidence that vulnerable code is more complex, has large and frequent changes, and has more past faults than faulty code.
This research provides empirical evidence that fault prediction models that are trained to predict faults can predict vulnerabilities at the similar prediction performance to the vulnerability prediction models that are trained to predict vulnerabilities despite the difference in the distribution of faults and vulnerabilities.
This research provides empirical evidence that code execution frequency and duration based on software usage patterns by a normal user can indicate vulnerable code locations.
This research provides empirical evidence that process metrics are better indicators of vulnerabilities than complexity metrics when process metrics are available.
This research defines and uses simple and useful measures of code inspection cost and code inspection reduction efficiency obtained from a prediction model.
results largely depend on the distribution of faults/vulnerabilities and the distribution of faults/vulnerabilities is specific to each project.
by Yonghee Shin
A dissertation submitted to the Graduate Faculty of North Carolina State University
in partial fulfillment of the requirements for the Degree of
Doctor of Philosophy
Computer Science
Raleigh, North Carolina
2011
APPROVED BY:
___________________________ ___________________________ Dr. Dennis R. Bahler Dr. Jason A. Osborne
DEDICATION
BIOGRAPHY
ACKNOWLEDGMENTS
I have felt my mother‟s prayer far from where she was during this whole time of study in U.S.A. She consistently gave me great comfort, encouragement, and advice in every difficult situation. I thank my brother and sister-in law for their cheer for me and for caring for my mother when I could not be with her for this long time. I thank my twin nieces, Yeji and Yeun, because they were such a source of joy for me during my study. I will never forget the time we have traveled together and I wish we do that again. Sangman Lee, my uncle, was a motivator of my study as a role model who was always positive and willing to take challenges. I think my generosity toward my nieces was inherited from him who supported me from time to time at the right moment during my study.
Laurie Williams, my advisor, was the first woman boss that I worked for and the best boss that I ever worked for. She was my role model academically and in life as a woman with her positive thinking, relentless energy to pursue higher goals, and excellent time management. I cannot express my gratefulness enough with words for her great advice, encouragement, funding, all the opportunities she provided me with, and most of all, her patience for my slow progress mostly because of my weak health.
scientific rigor. I especially thank Jason Osborne who generously spent time with me to explain statistical matters and gave me great help via co-authoring a paper.
Aldo Dagnino, my mentor at ABB, during my first summer internship, gave me an opportunity that I could get more sense on research when I did not fully understand the essence of research yet.
Thomas Ostrand, Elaine Weyuker, Robert Bell, and Mary Fernandez, my mentors and supervisor at AT&T Labs during my second summer internship, gave me unforgettable research experience. Not long after I changed my research topic from software testing to software metrics, these established researchers showed me how to think logically in terms of data analysis. I greatly enjoyed the collaboration with them via brainstorming and paper co-authoring. I was really lucky and am proud of having been a part of such a gentle, smart, and pleasant collaboration team.
Graham Holmes, Rich Livingstone, John Qian, especially Erick Lee, my team members and mentor at Cisco during my third summer internship, gave me a great opportunity to learn the software security practice in an industrial company and also helped me improve knowledge in security area.
discussions and suggestions during our reading group sharpened the way I think for research.
Especially, I appreciate Andy Meenely, who was a great collaborator while we were writing
our journal paper. Thank you, Ben. Because we cleaned our office by your suggestion, my
allergy has stopped and I could study in our office and my performance improved. I did not
know that the dust in the office was the main cause of my allergy.
I thank the reviewers and editors of my IEEE Transactions on Software Engineering
journal paper. Over 7000 of words of critiques were initially daunting to me. But ironically
their passions to improve the quality of research by helping the authors gave me
encouragement and helped me improve my research and writing skills by following their
advices resulting in a publication.
Most of all I thank God who always leads my way wherever I go and whatever I do
and who made this moment that I am writing this acknowledges the best part of my
dissertation writing.
TABLE OF CONTENTS
LIST OF TABLES ... ix
LIST OF FIGURES ... xi
GLOSSARY ... 1
CHAPTER 1 Introduction ... 5
1.1 Research Questions and Hypotheses ... 6
1.2 Approach ... 11
1.3 Contributions ... 12
1.4 Organization ... 13
CHAPTER 2 Background ... 15
2.1 Software Complexity ... 15
2.2 Four Complexity Metric Types ... 17
CHAPTER 3 Related Work ... 29
3.1 Complexity Metrics as Indicators of Faults and Failures ... 29
3.2 Software Metrics as Indicators of Vulnerabilities ... 32
CHAPTER 4 Evaluation Criteria, Prediction Modeling, and Validation Method ... 35
4.1 Hypothesis Test for Discriminative Power ... 35
4.2 Predictability and Binary Classification Criteria ... 36
4.3 Hypothesis Test for Predictability ... 40
4.4 Code Inspection Cost and Inspection Reduction Efficiency Measurements ... 42
4.5 Prediction Modeling and Result Validation ... 45
CHAPTER 5 Code Complexity, Code Churn, and Developer Activity Metrics as Indicators of Software Vulnerabilities ... 50
5.2 Case Study 1: Mozilla Firefox ... 59
5.3 Case Study 2: Red Hat Enterprise Linux Kernel ... 69
5.4 Summary of Two Case Studies and Discussion ... 73
5.5 Threats to Validity ... 79
5.6 Summary ... 80
CHAPTER 6 Fault Prediction Metrics as Indicators of Software Vulnerabilities ... 83
6.1 Study Design ... 85
6.2 A Case Study: Mozilla Firefox ... 90
6.3 Prediction Results ... 97
6.4 Analysis of the “Needle Effect” ... 102
6.5 Discussion ... 105
6.6 Threats to Validity ... 107
6.7 Summary ... 108
CHAPTER 7 Code, OO Design, Network, and Execution Complexity Metrics ... 110
7.1 Case Study Projects ... 111
7.2 Execution Complexity Metrics ... 113
7.3 File Level Analysis ... 116
7.4 Component Level Analysis ... 124
7.5 Class Level Analysis ... 129
7.6 Discussion ... 133
7.7 Summary ... 138
7.8 Threats to Validity ... 140
CHAPTER 8 Conclusions ... 142
LIST OF TABLES
Table 1. Classification of complexity metrics ... 20
Table 2. Definitions of code complexity metrics ... 22
Table 3. Definitions of OO design complexity metrics ... 24
Table 4. Definitions of dependency network complexity metrics ... 26
Table 5. Definitions of execution complexity metrics ... 28
Table 6. Definitions of code churn metrics ... 54
Table 7. Meaning of developer activity metrics ... 56
Table 8. Project statistics for Mozilla Firefox ... 61
Table 9. Results of discriminative power test and univariate prediction for Mozilla Firefox 63 Table 10. Results from multiple regression prediction models for Mozilla Firefox ... 69
Table 11. Project statistics for the RHEL4 kernel ... 70
Table 12. Results of discriminative power test and univariate prediction for the RHEL4 kernel... 72
Table 13. Results from multiple regression prediction models for the RHEL4 kernel ... 73
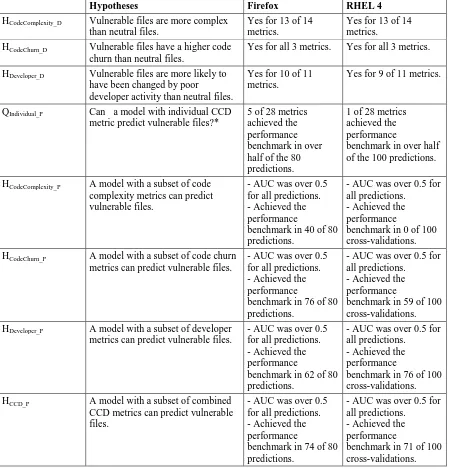
Table 14. Summary of hypothesis testing for CCD metrics ... 74
Table 15. Definitions of code complexity, code churn, and past fault history metrics ... 89
Table 16. Comparison of mean and median values of metrics for Firefox 2.0... 94
Table 17. Project statistics Firefox 3.0, RHEL4, Wireshark 1.2.0, and Tomcat 6.0 ... 112
Table 18. Correlations at file level ... 118
Table 19. Discriminative power at file level ... 120
Table 20. Predictability at file level ... 122
Table 22. Top three most frequently selected metrics at file level ... 124
Table 23. Correlations at component level ... 125
Table 24. Discriminative power at component level ... 126
Table 25. Predictability at component level ... 128
Table 26. Top three most frequently selected metrics at component level ... 129
Table 27. Correlations at class level ... 130
Table 28. Discriminative power at class level ... 131
Table 29. Predictability at class level ... 132
Table 30. Pairwise comparison of AUC between metric types at class level ... 133
Table 31. Top three most frequently selected metrics at class level ... 133
LIST OF FIGURES
Figure 1. Binary classification results ... 38
Figure 2. ROC curve ... 40
Figure 3. Pseudo code for next-release-validation ... 49
Figure 4. Pseudo code for 10x10 cross-validation ... 49
Figure 5. Boxplots for metric values for vulnerable and neutral files ... 64
Figure 6. Prediction results for Mozilla Firefox across releases ... 67
Figure 7. Fault prediction using a fault prediction model (FF prediction) ... 86
Figure 8. Vulnerability prediction using a fault prediction model (VF prediction) ... 87
Figure 9. Vulnerability prediction using a vulnerability prediction model (VV prediction) .. 88
Figure 10. Distribution of faulty files and vulnerable files in Firefox 2.0 ... 93
Figure 11. Fault prediction results using fault prediction models (FF prediction) ... 98
Figure 12. Vulnerability prediction results using fault prediction models (VF prediction) ... 99
Figure 13. Comparison of the results of VF prediction and VV prediction ... 100
Figure 14. Comparison of the results of VF prediction and VV prediction with adjusted classification threshold... 101
Figure 15. Comparison of the results of FF prediction and VV prediction ... 102
Figure 16. Effects of the number of faulty files and vulnerable files ... 104
Figure 17. Screen shot of Wireshark 1.2.0... 115
GLOSSARY
AUC –Area under the ROC curve.
discriminative power – the ability to discriminate between high-quality software components
and low-quality software components [34].
entity – a unit of code analysis. An entity can bea file, a class, or a component depending on studies.
error – “human action that results in software containing a fault” [33].
failure – “the termination of the ability of a functional unit to perform its required function” [33]. “A failure may be produced when a fault is encountered” [33] during code execution.
failure proneness – the probability that an entity contains one or more failures.
failure-prone entity – an entity that is likely to fail due to the execution of code that has faults.
fault – “1) an accidental condition that causes a functional unit to fail to perform its required function. 2) a manifestation of an error in software” [33].
fault prediction model – a model that is trained to predict the probability that a file will have at least one fault. A binary value of whether a file has a fault or not is used as the value of the dependent variable to train a fault prediction model.
fault-proneness– the probability that an entity contains one or more faults [17]. fault-prone entity – an entity that is likely to have one or more faults.
file inspection ratio – the ratio of entities predicted as vulnerable (that is, the number of
entities to be inspected) to the total number of entities.
file inspection reduction – the ratio of the reduced number of entities to be inspected by using a prediction model compared to a random classification.
LOC inspection ratio – the ratio of lines of code to be inspected to the total lines of code. LOC inspection reduction – the ratio of reduced lines of code to be inspected by using a
prediction model compared to a random classification.
module – a smallest unit of functionality such as a function or a method [51].
neutral entity – an entity that has no discovered vulnerabilities or faults. In Chapter 5 where both faults and vulnerabilities are investigated, a neutral entity means an entity that has neither a discovered fault nor a discovered vulnerability. In other chapters that discusses only vulnerabilities, a neutral entity has the same meaning as non-vulnerable entity.
non-faulty entity – an entity that has no discovered faults.
operational profile – “a quantitative characterization of how a system will be used” [54]. ROC curve – Receiver Operating Characteristic curve. A graph of recall versus probability of
false alarm at various classification thresholds.
precision – the ratio of correctly predicted vulnerable entities to all predicted vulnerable entities.
predictability – the ability to predict a quality factor value with the required accuracy [34]. process metrics – metrics that are collected from software-related activities such as time,
effort, number of requirement changes [21].
product metrics – metrics that are collected from software artifacts, deliverables or
documents [21].
recall –the ratio of correctly predicted vulnerable entities to actual vulnerable entities.
vulnerable entity –an entity that has at least one reported vulnerability.
vulnerability – an instance of a [fault] in the specification, development, or configuration of software such that its execution can violate an [implicit or explicit] security policy [43]. A software vulnerability provides functionality beyond required functionality, such as enabling an elevation of privilege or providing more information about an internal implementation of a system than necessary in an error message. Attackers can exploit this additional functionality.
vulnerable entity – an entity that is likely to have one or more vulnerabilities.
CHAPTER 1
Introduction
A single exploited software vulnerability can cause severe damage to an organization. Annual worldwide losses caused from cyber attacks have been reported to be as high as $226 billion [11]. Loss in stock market value in the days after an attack is estimated at $50 million to $200 million per organization [11]. The importance of detecting and mitigating software vulnerabilities early in the software development life cycle is paramount to prevent such damage and to reduce costs that are caused by late fixes [6]. With limited time and budget in development teams, efficient allocation of inspection and testing effort is also critical. Hence, finding software characteristics that can indicate the code locations that are likely to have vulnerabilities and to prioritize inspection and testing effort with the information that can be obtained early in the development life cycle is beneficial.
cybersecurity in a hearing at the Subcommittee of Homeland Security on Emerging Threats, Cybersecurity, and Science and Technology on 23rd, April, 2007. McGraw [46] also points out complexity as one of three major causes of software security problems (the “Trinity of Trouble”); the other causes together are connectivity and extensibility. The wisdom of these experts, though, has not been substantiated by empirical evidence using quantifiable metrics in terms of software security in depth.
The experts‟ claims are intuitive because complex software systems are difficult to understand, test, and maintain [15, 45, 76]. Therefore, the more complex a software system is, the more chance that software engineers cannot fathom the security problems in the system and the more chance for software engineers to ignore security concerns. Hence, finding complexity metrics that can indicate software complexity and examining whether those complexity metrics can indicate vulnerable code locations may help organizations to find software vulnerabilities before software release and to efficiently allocate security inspection and testing effort. The goal of this research is to investigate complexity metrics that can indicate vulnerable code locations to improve the efficiency of security inspection and testing.
1.1
Research Questions and Hypotheses
fault-prone code locations in a software system based on the hypothesis that software engineers can produce more errors in complex code than in simple code. While the same hypothesis applies to vulnerabilities, whether those static complexity metrics are also effective to find vulnerable code locations has not been investigated in depth. From this lack of evidence, our first research question arises:
Research Question 1. Can static complexity metrics that reflect difficulty in program understanding and maintenance indicate vulnerable code locations?
To answer this question, this research examines whether static complexity metrics can discriminate vulnerable code locations and neutral code locations and whether static complexity metrics can predict vulnerable code locations using three types of static complexity metrics; code complexity; Object Oriented (OO) design complexity; and dependency network complexity metrics. Here neutral code means the code whose vulnerabilities have not been discovered yet. The associated hypothesis is:
Initial testing results on Hypothesis 1 using code complexity metrics are provided in Chapter 4 together with a comparison of discriminative power and predictive power with two process metrics. The two process metrics are code churn metrics that quantify code change history [29, 41, 55, 56] and developer activity metrics that quantify developer collaboration history [48]. These process metrics also have been effective for fault prediction. Chapter 6 tests Hypothesis 1 with three static complexity metrics including code complexity, OO design complexity, and dependency network complexity metrics and a dynamic complexity metric that will be discussed in Hypothesis 3.
detection. Therefore, the characteristics of discovered vulnerabilities and faults may be different. Therefore, our second research question is:
Research Question 2. Can fault prediction models be used to predict vulnerabilities with equal to or better prediction performance than vulnerability prediction models?
To answer this question, this research builds a fault prediction model that is trained to predict faults and a vulnerability prediction model that is trained to predict vulnerabilities using traditional fault prediction metrics including code complexity, code change history, and past fault history metrics. Then, the vulnerable files included in the predicted files by both models are compared. The associated hypothesis is:
Hypothesis 2. Despite the similar characteristics between faulty code and vulnerable code, different intentions and usage patterns between normal users and attackers/security researchers may result in different distribution of software metric values between faulty code and vulnerable code. Therefore, vulnerability prediction models trained to predict vulnerabilities can provide better performance than fault prediction models trained to predict faults in the ability to predict vulnerable code locations.
Hypothesis 2 is tested in Chapter 5 by comparing the predictability between fault prediction models and vulnerable prediction models.
45, 76] seem to be promising, some complex code may be rarely executed by attackers. Instead, metrics that are collected during software execution to reflect usage patterns of software by attackers may be more effective to identify vulnerable code locations. However, considering the difficulty in obtaining usage patterns of software by attackers, collecting execution metrics that reflect usage patterns of software by normal users first and examining the relationships between execution metrics and vulnerabilities can still provide benefits; if the execution metrics obtained from the normal user‟s usage patterns can indicate vulnerable code locations, organizations need to focus their security inspection and testing effort to the most frequently used code areas; otherwise, the software usage patterns by attackers may be different from the usage patterns by normal users and operational profile based on attacker‟s behavior should be sought. Hence the third question in this research is:
Research Question 3. Can the software execution metrics obtained from usage patterns by normal users indicate vulnerable code locations?
As a way to measure common usage patterns by normal users, runtime complexity metrics that measure the frequency and the duration of code execution can be used. Since this research question is not substantiated well by previous observations, this research pursues to answer this question without setting up a hypothesis. The modified research question is:
Question 3' is answered in Chapter 6 by examining discriminative power and predictability of execution complexity metrics.
1.2
Approach
This research utilizes empirical case studies using four open source projects; the Mozilla Firefox web browser1; the Red Hat Enterprise Linux kernel2; the Wireshark network protocol analysis tool3; and the Apache Tomcat servlet container4 to answer the proposed research questions. The metrics and vulnerability information are collected automatically using commercial code analysis tools detailed in Section 2.2 and the tools that are developed for this research. For the hypothesis testing, discriminative power is tested by comparing the mean difference in metric values from vulnerable code and neutral code at 0.05 significance level. Predictability is tested on the prediction results from a logistic regression model. The prediction results are validated using n-fold stratified cross-validation. The significance of predictability is tested against the predictability of a random classification model. Additionally, the significance of predictability is tested against performance benchmarks found from fault prediction literature.
1 http://www.mozilla.com/firefox/
2
http://www.redhat.com/rhel/ 3 http://www.wireshark.org/
1.3
Contributions
The contributions of this dissertation work are as follows5:
This research provides empirical evidence that complexity metrics can indicate vulnerable code locations.
This research provides empirical evidence that vulnerable code is more complex, has large and frequent changes, and has more past faults than faulty code.
This research provides empirical evidence that fault prediction models that are trained to predict faults can predict vulnerabilities at the similar prediction performance to the vulnerability prediction models that are trained to predict vulnerabilities despite the difference in the distribution of faults and vulnerabilities.
This research provides empirical evidence that code execution frequency and duration based on a normal user‟s software usage patterns can be used to identify vulnerable code locations.
This research provides empirical evidence that process metrics are better indicators of vulnerabilities than complexity metrics when process metrics are available.
This research defines and uses simple and useful measures of code inspection cost and code inspection reduction efficiency obtained from a prediction model.
This research demonstrated that automated text classification is feasible and useful to classify bug reports for faults and functional enhancements.
This research reveals that a careful analysis of the relationship between faults/vulnerabilities and software metrics is required because the analysis results largely depend on the distribution of faults/vulnerabilities and the distribution of faults/vulnerabilities is specific to each project.
1.4
Organization
CHAPTER 2
Background
This chapter provides the concept of complexity and discusses the complexity metrics that this research is interested in, the reason why those metrics matter in terms of software security and the method of complexity metrics collection.
2.1
Software Complexity
Complex is defined as “1. composed of many interconnected parts; compound; composite, 2. characterized by a very complicated or involved arrangement of parts, units, etc. 3. so complicated or intricate as to be hard to understand or deal with” [13]. This definition tells that complexity arises from the amount of entities and the degree of interaction between entities and those complexity results in difficulty in understanding when the amount of entities and the degree of interaction reach a certain level.
lines of code; a function with many parameters is more complex than a function without a parameter; a function with many decision statements is more complex than a function with a few decision statements. The second definition of complexity tells us that an entity with high interaction with other entities is more complex than an entity with low interaction. Software entities can have a dependency relationship via data flow, control flow, function calls, or class inheritance. The third definition of complexity tells us that these compositions of entities and interactions between entities result in complex software and make software engineers difficult to understand code.
complexity, execution complexity depends on input, but is measured on specific code with specific input.
2.2
Four Complexity Metric Types
This research investigates the following four types of complexity metrics as potential indicators of vulnerabilities:
Code complexity metrics measure complexity of an entity at code level.
OO design complexity metrics measure complexity that can be obtained at OO design level.
Dependency network complexity metrics measure the complexity of interaction between entities from a dependency network constructed from data dependency and call dependency between entities.
Execution complexity metrics measure complexity at runtime.
In this research, an entity can be a file, a class, or a component depending on studies in the following chapters.
Categorizing complexity types depending on the dimensions of metrics can help us conceptualize similarities and differences between different complexity metric types and also help us find other possible metrics. This research categorizes the complexity metrics used in this research in four dimensions depending on the stages in the software development lifecycle that metrics can be obtained, data collection method, relationships between entities, and programming language dependency. Investigating metrics from as many categories as possible is beneficial because metrics from the same category can provide similar information each other [40]. Instead, complexity metrics from diverse categories can give more complete understanding on the relationship between complexity and vulnerabilities than complexity metrics that provide only a narrow view of the total complexity.
The second dimension of metrics classification is the data collection methods. Static metrics can be obtained from software artifacts such as code or design documents without code execution, while dynamic metrics are collected during code execution. Static metrics measure the complexity in the structure of entities such as the number of sub-entities in an entity and the interaction between entities without code execution. The benefit of using static metrics is that static metrics do not require execution environments for a software system including hardware, third-party libraries, and input data specification. As mentioned earlier, however, static metrics do not show how those statically complex or simple entities behave at runtime. On the other hand, dynamic metrics can provide more precise information on the behavior of a software system, but the information can be collected only from the execution paths that have been actually executed. Therefore, depending on the operational profile that has been used for the execution, the values of execution metrics collected can change.
Finally, metrics can be classified by the dependency on programming languages. While code, network, and execution complexity metrics can be obtained from the software projects that use any programming languages, OO design metrics can be obtained only from the software projects that use OO languages such as C++ or Java.
Table 1 shows the categories of complexity metrics according to the four dimensions. As seen in Table 1, each complexity type represents different combination of categories from the four dimensions.
Table 1. Classification of complexity metrics
Complexity Type Stage in
Development Life Cycle
Data Collection Method
Entity Relationship
Language-Dependency
Code complexity Coding Static Intra-entity (+Inter-entity) None
OO design complexity Design Static Inter-entity (+ Intra-entity) OO languages
Dependency network complexity
Design Static Inter-entity None
Execution complexity Integration Testing
Dynamic Intra-entity / Inter-entity None
Each individual metric is explained in the following subsections in detail.
2.2.1. Code complexity metrics
lines, many variables, many function definitions, and many preprocessing declaratives is more difficult to understand, maintain, and test than simple code. In Table 2, LOC, LOCVarDecl, NumFunctions, and NumLinePreprocessor measure these aspects, respectively.
EssentialComplexity, CyclomaticStrictComplexity, and MaxNesting measure complexity from control flow. Structured code is easier to understand and maintain than unstructured code [45]. EssentialComplexity measures the structuredness of a function. Code with many branches requires more test cases than code with a few branches. CyclomaticStrictComplexity measures the upper bound of required test cases by counting the number of conditional branches in a function. Code with deep levels of control blocks with
if or while statements is more complex than the code with shallow levels of control
blocks. MaxNesting measures the depth of control blocks.
Communication by comments between developers is important especially in open source projects for which many developers can contribute on the same code segment without central control. Novice developers who do not understand security concerns and do not follow secure coding practice might comment less often. Furthermore, code developed in a
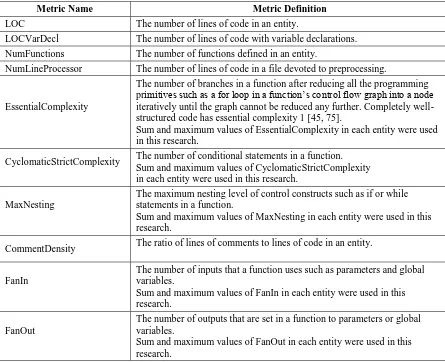
Table 2. Definitions of code complexity metrics
Metric Name Metric Definition
LOC The number of lines of code in an entity.
LOCVarDecl The number of lines of code with variable declarations.
NumFunctions The number of functions defined in an entity.
NumLineProcessor The number of lines of code in a file devoted to preprocessing.
EssentialComplexity
The number of branches in a function after reducing all the programming primitives such as a for loop in a function‟s control flow graph into a node iteratively until the graph cannot be reduced any further. Completely well-structured code has essential complexity 1 [45, 75].
Sum and maximum values of EssentialComplexity in each entity were used in this research.
CyclomaticStrictComplexity The number of conditional statements in a function. Sum and maximum values of CyclomaticStrictComplexity in each entity were used in this research.
MaxNesting
The maximum nesting level of control constructs such as if or while statements in a function.
Sum and maximum values of MaxNesting in each entity were used in this research.
CommentDensity The ratio of lines of comments to lines of code in an entity.
FanIn
The number of inputs that a function uses such as parameters and global variables.
Sum and maximum values of FanIn in each entity were used in this research.
FanOut
The number of outputs that are set in a function to parameters or global variables.
hurry (perhaps directly prior to release) might have fewer comments and be more vulnerable. Therefore code with a few comments may be more vulnerable than code with many comments. In Table 2, CommentDensity measures this aspect.
Code complexity metrics were collected using a commercial code analysis tool, Understand C++6 .
2.2.2. OO design complexity metrics
This research uses the six OO design complexity metrics proposed by Chidamber and Kemerer [12]. Table 3 provides the definitions of OO design complexity metrics. For the same reason mentioned in Section 2.2.1, highly coupled code may have more chance to introduce vulnerabilities than less coupled code because of difficulty in tracing input sources, change propagation, and possible misunderstanding of security concerns in a third party component. In Table 3, Coupling Between Objects (CBO) measures the degree of coupling between classes.
Number Of Children (NOC) and the Depth of Inheritance Tree (DIT) measure the complexity incurred from the hierarchical design of classes. The Weighted Methods per Class (WMC) and the Lack of Cohesion of Methods (LCOM) measure the intra-entity complexity within a class. Lacking cohesiveness indicates the irrelevant code co-exists in the same class. Lack of cohesion can make code difficult to understand and increases the
likelihood of errors during development. Excessively high values of NOC, DIT, WMC, and LCOM indicate the necessity of refactoring to make code easier to understand, maintain, and test. Response for a Class (RFC) counts the number of methods that can potentially be executed by an event received by an object of a class.
Even though OO design metrics were obtained from source code in many studies including ours, OO design metrics can be obtained just from OO design documents without actual implementation, which enables earlier estimation of vulnerabilities than code level metrics. Table 3 provides the definitions for the OO design complexity metrics.
OO design complexity metrics were collected using a commercial code analysis tool, Understand C++.
Table 3. Definitions of OO design complexity metrics
Metric Name Metric Definition
CBO (Coupling Between Objects) The number of other classes that use methods or instance variables in a class.
DIT (Depth of Inheritance Tree) The depth of inheritance in the class inheritance tree.
NOC (Number of Children) The number of immediate children nodes (subclasses) in the class inheritance tree.
LCOM
(Lack of Cohesion of Methods) The degree of lack of similarities between methods in a class measured by 100% minus the average of the percentage of the methods that access the same instance variable in a class.
WMC (Weighted Methods per Class) The number of methods defined in a class excluding inherited methods.
2.2.3. Dependency network complexity metrics
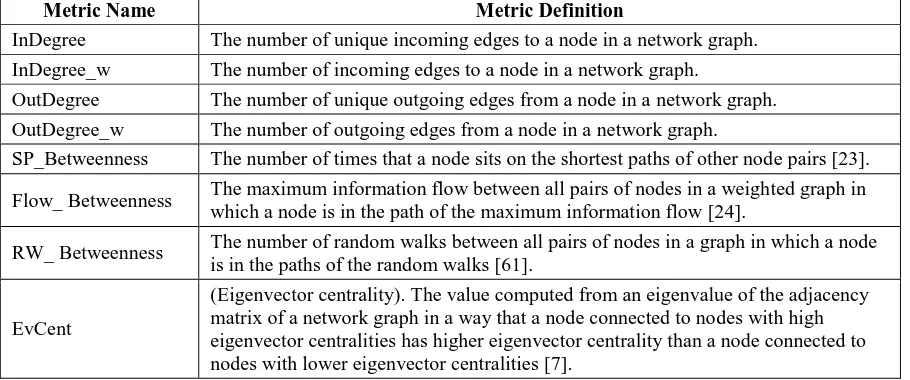
Table 4 provides the definitions of dependency network metrics that this research uses. In Table 4, InDegree and InDegree_w measure how many and how frequently other entities depend on an entity directly. OutDegree and OutDegree_w measure how many and how frequently an entity depends on other entities directly. SP_Betweenness measures how many times an entity sits in the middle of information flow via the geodesic path (shortest paths) between pairs of nodes in the dependency network [22]. Although SP_Betweenness is the most well-known and frequently used metric as a mediator of information, information does not necessarily flow via a shortest path. Alternatively, Flow_Betweenness considers maximum information flows between all possible paths that pass a node [24]. Different from
Table 4. Definitions of dependency network complexity metrics
Metric Name Metric Definition
InDegree The number of unique incoming edges to a node in a network graph.
InDegree_w The number of incoming edges to a node in a network graph.
OutDegree The number of unique outgoing edges from a node in a network graph.
OutDegree_w The number of outgoing edges from a node in a network graph.
SP_Betweenness The number of times that a node sits on the shortest paths of other node pairs [23].
Flow_ Betweenness The maximum information flow between all pairs of nodes in a weighted graph in which a node is in the path of the maximum information flow [24].
RW_ Betweenness The number of random walks between all pairs of nodes in a graph in which a node is in the paths of the random walks [61].
EvCent
SP_Betweenness that considers only geodesic paths in a simple graph, Flow_Betweenness considers a weighted graph. In our research, the number of dependencies between two entities is the weight of an edge in the network graph. However, Flow_Betweenness also has a limitation because information does not necessary flow in a way that the flow is maximized in a graph. Alternatively, RW_Betweenness measures how often information passes a node via a random walk between pairs of nodes in the dependency network [61]. EvCent measures the importance of a node by assigning higher value to a node that is connected to other high valued nodes than a node connected to other low valued nodes [7].
Dependency network complexity metrics were collected using multiple tools including a commercial network analysis tool, UCINET7, an open source network analysis library, Jung8, and the igraph9 package in R based on the dependency information obtained using Understand C++.
2.2.4. Execution complexity metrics
Execution complexity metrics measure the frequency of function calls and the duration of execution of functions. This research is interested in whether execution complexity metrics collected from common usage patterns can indicate vulnerable code locations. Specific use cases used in this research to represent common usage patterns are
7
http://www.analytictech.com/ucinet/
8 http://jung.sourceforge.net/
explained in Chapter 7 where execution complexity metrics were collected for two open source projects, Firefox and Wireshark. NumCalls measures the frequency of function calls by counting the number of function calls to the functions (or methods) in a file, a component, or a class. Both InclusiveExeTime and ExclusiveExeTime measure the duration of execution. While InclusiveExeTime measures the total execution time that is spent by a function and all the functions called by the function, ExclusiveExeTime measures the time spent within a function excluding the execution time spent by the called functions. Table 5 provides the definitions of execution complexity metrics.
Execution complexity metrics were collected from the execution profile obtained by an open source profiling tool, Callgrind, which is a component of an instrumentation framework for building dynamic analysis tools, Valgrind10.
10 http://valgrind.org/
Table 5. Definitions of execution complexity metrics
Metric Name Metric Definition
NumCalls The number of calls to the functions defined in an entity.
InclusiveExeTime
Execution time for the set of functions, S, defined in an entity including all the execution time spent by the functions called directly or indirectly by the functions in S.
CHAPTER 3
Related Work
Extensive studies, including [5, 10, 36, 38, 51, 53, 57, 58, 70, 81], have investigated the relationship between faults/failures and software metrics including complexity metrics. Some studies [26, 27, 59, 60, 68, 69, 71, 74, 82] have investigated the relationship between vulnerabilities and software metrics. This chapter provides the related work that utilized complexity metrics as predictors of software faults and failures. Compared to the vast amount of studies on the relationship between faults/failures and software metrics, vulnerabilities have been investigated by only a few groups of researchers. This chapter also discusses the studies that investigated the relationship between vulnerabilities and software metrics in general in Section 3.2.
3.1
Complexity Metrics as Indicators of Faults and Failures
investigated the relationships between complexity metrics and software failures with larger sizes of Microsoft projects between 37 thousand lines of code (KLOC) and 511 KLOC. In their study, the complexity metrics include both code complexity metrics and OO design complexity metrics. Their multiple linear regression model using principle components of complexity metrics resulted in statistically significant positive correlations between predicted failures and actual failures, but the set of effective code complexity and OO design complexity metrics varied depending on projects. Menzies et al. [51] also built models to predict fault-prone modules using multiple machine learning techniques on eight projects from NASA MDP data repository [1]. Their Naïve Bayes model predicted 71% of fault-prone modules with 25% false positive rate on average. However, as Nagappan et al‟s finding [57], the set of effective code complexity metrics varied depending on projects. Additionally they found that a prediction model with only three metrics provided as good prediction performance as a prediction model with 38 metrics.
and Krishnan [72] confirmed that a subset of OO design complexity metrics are effective for fault prediction even after controlling for size of code, but the effects of the metrics varied depending on programming languages. Briand et al. [10] also confirmed that OO design complexity metrics are effective for fault prediction with a large set of OO design complexity metrics including the variants of Chidamber and Kemerer‟s six OO design complexity metrics. Zhou and Leung performed a similar study with OO design metrics, but for faults with different severity levels [80]. Their study also showed that OO design complexity metrics are effective indicators of faults, but the effective set of metrics varied depending on the severity of faults.
More recently software dependency network complexity metrics have been studied as indicators of failures. Nagappan and Ball [58] showed that software dependencies are good indicators together with code churn metrics. However, this study does not provide the effectiveness of software dependency separately. Zimmermann and Nagappan [81] used dependency network complexity metrics to predict faults on Windows Server 2003. The fault prediction model with dependency network complexity metrics predicted failure-prone entities 10% better than the prediction model with code complexity and OO design complexity metrics.
telecommunications system together with code complexity and process metrics. Their classification tree model predicted fault-prone modules with less than 30% fault positive rate. In all the three types of metrics, there were subsets of metrics that were chosen by the classification model.
All these positive relationships between faults and complexity metrics suggest the possibility of using complexity metrics as indicators of vulnerabilities if vulnerabilities and faults have similar characteristics.
3.2
Software Metrics as Indicators of Vulnerabilities
predicted 65% of the total vulnerable packages and among the predicted vulnerable packages, 83% were correctly predicted.
Gegick et al. modeled vulnerabilities using the regression tree model technique with source lines of code, alert density from a static analysis tool, and code churn information [26]. They performed a case study on 25 components in a commercial telecommunications software system with 1.2 million lines of code. Their model identified 100% of the vulnerable components with an 8% false positive rate at best.
Walden et al. [74] measured the correlations between vulnerabilities and three complexity metrics together with other process metrics from 14 open source web applications written in PHP. The correlations were very different depending on the projects. For example, average cyclomatic complexity was between -0.96 and 0.88. Although Nagappan et al. [57] also found that there is no single metric that is correlated with failures across projects, the variance of correlations in Walen et al.‟s study is much larger than the variance of correlations from Nagappan et al.‟s study and also from the results from this research. This fact indicates that complexity in the programs written in script languages such as PHP may differ from the complexity in the programs written in programming languages such as C/C++ and Java.
Linux kernel showed that files changed by nine or more developers are more likely to have a vulnerability than files changed by fewer developers.
Zimmermann et al. [82] investigated the relationships between vulnerabilities and a set of metrics including code churn, dependency, code complexity, and organizational structure on Windows Vista. Compared to their failure prediction study using Windows Server 2003 [58, 81], the correlations between vulnerabilities and the metrics were very low only up to 0.3 because of the rarity of vulnerabilities. The models with each type of metrics and with the combined set of the metrics correctly predicted around 40% to 70% (median of 100 runs random splits for three fold cross-validation) of the total vulnerable binaries (such as Windows DLL files) depending on the types of metrics. Among the predicted binaries, around 10% to 40% were correctly predicted. However, the variance of each run of cross-validation was very large indicating the prediction is not reliable enough.
CHAPTER 4
Evaluation Criteria, Prediction Modeling, and Validation Method
This chapter provides the evaluation criteria for the hypotheses provided in Chapter 1 and explains the validation methods of prediction results.
4.1
Hypothesis Test for Discriminative Power
This research investigates the discriminative power of complexity metrics in the context of software security. Discriminative power [34] is defined as the ability to “discriminate between high-quality software components and low-quality software components”. In this research, discriminative power is the ability to discriminate the vulnerable entities from neutral entities.
statistically significant at the p<0.05 level. When multiple hypotheses are tested simultaneously, the probability of falsely rejecting at least one of the null hypothesis increases [64]. To deal with this problem, Bonferroni correction [64] is performed . That is, the number of the hypotheses that have been tested is multiplied to the p-value of a Welch‟s t-test before it is compared with 0.05. The t statistic for Welch‟s t-test is defined in Equation (1). 2 2 2 1 2 1 2 1 N s N s X X t (1)
where Xi, si2, and Ni are the sample mean, the sample variance, and the sample size of the two comparing groups i=1 and 2.
4.2
Predictability and Binary Classification Criteria
metrics together to predict the vulnerable entities in the future and mainly to allocate inspection and testing effort appropriately.
To predict code locations with vulnerabilities, this research performs binary classification using logistic regression. In binary classification, an entity is classified as vulnerable when the estimated probability of an entity having a vulnerability is over a certain classification threshold. Otherwise, an entity is classified as neutral. The default classification threshold is 0.5 in this research unless noted otherwise. In the projects used in this research, over 94% of files with vulnerabilities have less than three vulnerabilities across the four projects. Therefore, rather than ranking the files based on the number of predicted vulnerabilities, binary classification based on the predicted probability is more appropriate.
Among the many classification performance measures that can be derived from these four classification results, recall, precision, and probability of false alarm are most widely used to measure the performance of fault prediction or vulnerability prediction.
Recall, also known as probability of detection, or true positive rate, is the ratio of correctly predicted vulnerable entities to actual vulnerable entities as defined in Equation (2) : FN TP TP recall (2)
Precision is the ratio of correctly predicted vulnerable entities to all predicted vulnerable entities as defined in Equation (3) :
FP TP
TP p recisio n
(3)
Probability of False alarm (PF), also known as false positive rate is the ratio of entities incorrectly predicted as vulnerable to actual neutral entities as defined in Equation (4) : TN FP FP PF (4)
Predicted vuln. Predicted non-vuln.
Actual vuln. TP FN
Actual non-vuln. FP TN
The desired result is to have a high recall, high precision, and a low PF to find as many vulnerabilities as possible without wasting inspection or testing effort. Having a high recall is especially important in software security considering the potentially high impact of a single exploited vulnerability.
curve by a random classification model. When the ideal prediction performance is achieved with recall of 1 and PF of 0, AUC is 1. AUC over 0.5 (ROC B) indicates the prediction model can predict better than a random classification model.
4.3
Hypothesis Test for Predictability
To statistically support a hypothesis for predictability, a prediction model using complexity metrics should be able to predict vulnerable code location better than a random classification model. This research tests the null hypothesis that the AUC from a prediction model using complexity metrics is equal to or less than 0.5. If this hypothesis is rejected, the model has predictability.
Because the criterion of just being better than a random classification models seems to be too loose, this study also seeks a way to compare the prediction results with a more
stringent threshold. Since there is no universally applicable standard for the threshold of desired vulnerability prediction performance, this study uses the average prediction performance found from literature [44, 51, 52] as a performance benchmark. By comparing the results from this research with results from other recent studies, we can roughly judge whether the prediction performance in this research is at least comparable to the current state of the art fault prediction performance.
average of 11%, while the projects used in Chapter 7 in this research had vulnerabilities in 1.4% to 7.8% of the files and 14% to 69% of the components.
Note that although performance benchmark is useful for comparison purpose, desirable levels of recall and PF depend on varying domains and business goals.
4.4
Code Inspection Cost and Inspection Reduction Efficiency
Measurements
File Inspection (FI) ratio is the ratio of entities predicted as vulnerable (that is, the number of entities to be inspected) to the total number of entities for the reported recall as defined in Equation (5):
F N T N F P T P F P T P F I (5)
For example, recall=0.8 and FI=0.2 mean that within the 20% of files inspected based on the prediction results, 80% of vulnerable files can be found.
LOC Inspection (LI) ratio is the ratio of lines of code to inspect to the total lines of code for the predicted vulnerabilities as defined in Equation (6). First, we define lines of code in the entities that were true positives, as TPLOC, similarly with TNLOC, FPLOC, and FNLOC. Then LI is defined below:
L OC L OC L OC L OC L OC L OC FN TN FP TP FP TP LI (6)
While FI and LI estimate how much effort is involved, we need measures to provide how much effort is reduced. We define two cost-reduction measurements.
File Inspection Reduction (FIR) is the ratio of the reduced number of entities to be inspected by using the model with CCD metrics compared to a random selection to achieve the same recall as defined in Equation (7):
recall FI recall
LOC Inspection Reduction (LIR) is the ratio of reduced lines of code to be inspected by using a prediction model compared to a random selection to achieve the same PV as defined in Equation (8):
PV LI PV
LIR (8)
where PV is defined as below.
Predicted Vulnerability (PV) ratio is the ratio of the number of vulnerabilities in the entities predicted as vulnerable to the total number of vulnerabilities. First, we define the number of vulnerabilities in the entities that were true positives, as TPVuln, similarly with TNVuln, FPVuln, and FNVuln. Then PV is defined in Equation (9):
l n l n
l n
Vu Vu
Vu TN TP
TP PV
(9)
4.5
Prediction Modeling and Result Validation
This study used logistic regression to predict vulnerable entities in Chapters 5, 6, and 7. Logistic regression models the probability of occurrence of an outcome event from given independent variables by mapping the linear combination of independent variables to the probability of outcome using the log of odds ratio (logit). An entity is classified as vulnerable when the estimated outcome probability is greater than 0.5. As a preliminary study, other classification techniques including J48 decision tree [79], Random forest [9], Naïve Bayes [79], and Bayesian network [79] also have been used. For the study in Chapter 5, the J48, Random forest, and Bayesian network models provided similar results to the logistic regression model, while the Naïve Bayes model provided a higher recall with a lower precision than other techniques. Lessmann et al. also reported that no significant difference in prediction performance was found between the 17 classification techniques they investigated [44]. Therefore, this dissertation presents the results from only logistic regression.
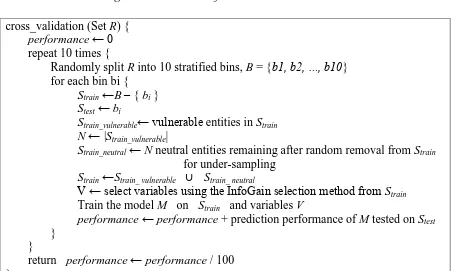
next-release validation in Chapter 5, data from the most recent three previous releases were used to train against the next release (i.e. train on releases R-3 to R-1 to test against release R). Using only recent releases was to accommodate for process change, technology change, and developer turnovers. For 10x10 cross-validation, we randomly split the data set into 10 folds and used one fold for testing and the remaining folds for training, rotating each fold as the test fold. Each fold was stratified to properly distribute vulnerable files to both the training data set and the test data set. The entire process was then repeated ten times to account for possible sampling bias in random splits. Overall, 100 predictions were performed for 10x10 cross-validation and 9 predictions for 3x3 cross-validation.
Using many metrics in a model does not always improve the prediction performance since metrics can provide redundant information [51]. Therefore, each study in this research selected only a small set of variables using the information gain ranking method [79]. As a preliminary study, the correlation-based greedy feature selection method [79] was also investigated. While both methods provided similar prediction performance, the set of chosen variables by the two selection methods were different. This dissertation presents the results from the models using the information gain ranking method.
The data used in this research is heavily unbalanced between majority class (neutral entities) and minority class (vulnerable entities), when an entity is at the file level or at the class level. Prior studies have shown that the performance is improved (or at least not degraded) by “balancing” the data [37, 52]. Balancing the data can be achieved by duplicating the minority class data (over-sampling) or removing randomly chosen majority class data (under-sampling) until the numbers of data instances in the majority class and the minority class become equal [52]. This research used under-sampling since under-sampling provided better results than using the unbalanced data and reduced the time for evaluation.
Prediction models were built using Weka 3.711 with default options except for limiting the number of variables to be selected.
cross_validation (Set R) { performance ← 0 repeat 10 times {
Randomly split R into 10 stratified bins, B = {b1, b2, …, b10} for each bin bi {
Strain ←B – { bi } Stest ← bi
Strain_vulnerable← vulnerable entities in Strain N ← |Strain_vulnerable|
Strain_neutral ← N neutral entities remaining after random removal from Strain for under-sampling
Strain ←Strain_ vulnerable ∪ Strain_ neutral
V ← select variables using the InfoGain selection method from Strain Train the model M on Strain and variables V
performance ← performance + prediction performance of M tested on Stest }
}
return performance ← performance / 100 }
Figure 3. Pseudo code for 10x10 cross-validation next_release_validation (Set R1, Set R2, Set R3, Set R4) {
Strain← R1∪ R2 ∪ R3 Stest← R4
performance ← 0 repeat 10 times {
Strain _ vulnerable ← vulnerable entities in Strain N ← |Strain_ vulnerable|
Strain_ neutral ← N neutral entities remaining after random removal from Strain for under-sampling
Strain ← Strain_ vulnerable∪ Strain_ neutral
V ← select variables using the InfoGain variable selection method from Strain Train the model M on Strain and variables V
performance ← performance + prediction performance of M tested on Stest }
return performance ← performance / 10 }
CHAPTER 5
Code Complexity, Code Churn, and Developer Activity Metrics
as Indicators of Software Vulnerabilities
Complexity can make code difficult to understand and to test. Therefore, software developers can introduce more errors in complex code than in simple code and the errors in complex code are more likely to remain undetected during testing [15, 45, 76]. For this reason, complexity metrics has been used to predict faults [5, 10, 36, 38, 51, 53, 57, 58, 70, 81]. While complexity metrics has been investigated as indicators of faults in general, applicability of complexity metrics as indicators of vulnerabilities has not been investigated in depth yet.
arming the security expert with all the modules likely to contain faults, a security prediction model can point toward the set of modules likely to contain what a security expert is looking for: security vulnerabilities. Establishing predictability in a security prediction model is challenging because security vulnerabilities and non-security-related faults have similar symptoms. Differentiating a vulnerability from a fault can be nebulous even to a human, much less a statistical model. Additionally, the number of reported security vulnerabilities with which to train a model are few compared to non-security-related faults. Colloquially, security prediction models are “searching for a needle in a haystack.”
The goal of this chapter is to investigate whether code complexity metrics can be used to discriminate between vulnerable and neutral files, and to predict vulnerable code locations.
As an initial study to investigate the relationship between software complexity and vulnerabilities, this study focuses on code complexity metrics. Other types of complexity metrics including OO design complexity, dependency network complexity, and execution complexity metrics are examined in Chapter 7.
activity metrics [48], as indicators of vulnerabilities together with code complexity metrics. Code churn and developer activity metrics have been known to be effective for fault prediction [29, 48, 55, 56]. These metrics are also interesting as indicators of vulnerabilities because frequent or large amount of code change can introduce errors including vulnerabilities. Poor developer collaboration can diminish project-wide secure coding practices. Hence, metrics that measure code churn and developer activity also may be able to indicate vulnerable code locations. For convenience, we call Code complexity, Code churn, and Developer activity metrics CCD metrics in this study.
To achieve the goal of this study, empirical case studies have been conducted on two widely-used, large scale open source projects: the Mozilla Firefox web browser and the Linux kernel as distributed in Red Hat Enterprise Linux. This study analyzed Mozilla Firefox and Red Hat Enterprise Linux (each of them containing over two million lines of source code), and evaluated the adequacy of using CCD metrics as indicators of security vulnerabilities. Because the ultimate gold is to efficiently allocate inspection and testing effort, this study also measured the reduction in code inspection effort using CCD metrics against random file selection.
factors to be considered to determine whether CCD metrics can be used to find vulnerable code locations for projects.
5.1
Hypotheses and Evaluation Criteria
This section provides the evaluation criteria of hypotheses for discriminative power and predictability.
5.1.1. Hypotheses for Discriminative Power
This subsection provides the hypotheses of using the CCD metrics as indicators of vulnerabilities.
5.1.1.1Code Complexity
As discussed in Section 2.2, complexity can lead to subtle vulnerabilities that are difficult to test and diagnose, providing more chances for attackers to exploit. Therefore, complex code would be more vulnerable than simple code. Therefore, the hypothesis for discriminative power for code complexity metrics in this study is:
HCodeComplexity_D: Vulnerable files have a higher code complexity than neutral files.
5.1.1.2Code Churn
HCodeChurn_D: Vulnerable files have more frequent and large changes than neutral files.
Table 6 defines the code churn metrics that we use in this study.
Table 6. Definitions of code churn metrics
Related Hypothesis
Metric Definition
HCodeChurn_D,P NumChanges The number of check-ins for a file since the creation of a file
LinesChanged The cumulated number of code lines changed since the creation of a file
LinesNew The cumulated number of new code lines since the creation of a file
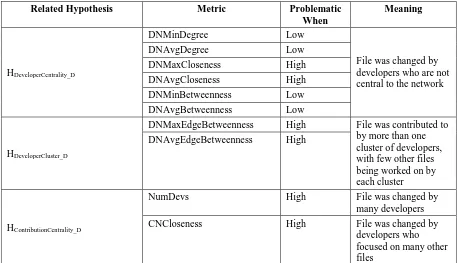
5.1.1.3Developer Activity
Software development is performed by development teams working together on a common project. Lack of team cohesion, miscommunications, or misguided effort can all result in security problems [46]. Version control data can be used to construct a developer network and a contribution network based upon “which developer(s) worked on which file.” This study uses network analysis to represent developer network and contribution network.