| GENOMIC SELECTION
Beyond Genomic Prediction: Combining Different
Types of
omics
Data Can Improve Prediction of
Hybrid Performance in Maize
Tobias A. Schrag,*,1Matthias Westhues,*,1Wolfgang Schipprack,* Felix Seifert,†Alexander Thiemann,† Stefan Scholten,* and Albrecht E. Melchinger*,2
*Institute of Plant Breeding, Seed Science and Population Genetics, University of Hohenheim, 70599 Stuttgart, Germany and †Biocenter Klein Flottbek, Developmental Biology and Biotechnology, University of Hamburg, 22609 Hamburg, Germany
ORCID ID: 0000-0001-7025-6632 (T.A.S.)
ABSTRACTThe ability to predict the agronomic performance of single-crosses with high precision is essential for selecting superior candidates for hybrid breeding. With recent technological advances, thousands of new parent lines, and, consequently, millions of new hybrid combinations are possible in each breeding cycle, yet only a few hundred can be produced and phenotyped in multi-environment yield trials. Well established prediction approaches such as best linear unbiased prediction (BLUP) using pedigree data and whole-genome prediction using genomic data are limited in capturing epistasis and interactions occurring within and among downstream biological strata such as transcriptome and metabolome. Because mRNA and small RNA (sRNA) sequences are involved in transcriptional, translational and post-translational processes, we expect them to provide information influencing several biological strata. However, using sRNA data of parent lines to predict hybrid performance has not yet been addressed. Here, we gathered genomic, transcriptomic (mRNA and sRNA) and metabolomic data of parent lines to evaluate the ability of the data to predict the performance of untested hybrids for important agronomic traits in grain maize. We found a considerable interaction for predictive ability between predictor and trait, with mRNA data being a superior predictor for grain yield and genomic data for grain dry matter content, while sRNA performed relatively poorly for both traits. Combining mRNA and genomic data as predictors resulted in high predictive abilities across both traits and combining other predictors improved prediction over that of the individual predictors alone. We conclude that downstream“omics” can complement genomics for hybrid prediction, and, thereby, contribute to more efficient selection of hybrid candidates.
KEYWORDSBLUP; hybrid performance; maize; omics; genomic prediction; genomic selection; GenPred; Shared Data Resources; Genomic Selection
H
YBRID breeding has considerably advanced yields in crops such as maize, rice, sorghum, pearl millet, rye, sugar beet, and sunflower (Duvick 1999). To exploit heterosis in an optimal manner, parent lines are organized in geneti-cally distinct heterotic groups (Melchinger and Gumber 1998; Reifet al.2007). Each breeding cycle results in large numbers of new inbred parents, especially if line development is based on the doubled haploid (DH) technology (Wedzonyet al. 2009) or on rapid cycles of recurrent selfing by single seed descent (SSD). Any possible combination of two lines from different groups can potentially yield a unique single-cross hybrid that may result in a new cultivar. Together with the large number of available parent lines (aroundn = 1000 or more per heterotic group), this poses a great challenge to plant breeders, who must then select the superior ones fromn2 potential hybrid candidates. From these numbers it becomes obvious that it is economically and logistically impossible to evaluate the phenotypic performance of alln2hybrid candi-dates in multi-environmentfield trials.
Previous studies have shown that genotypic value of un-tested hybrid candidates can be successfully forecast using predictors collected on the 2nparent lines as the basis of a statistical model trained with an only moderately sized subset of hybrids with phenotypic data (Bernardo 1994; Massmanet al. Copyright © 2018 by the Genetics Society of America
doi:https://doi.org/10.1534/genetics.117.300374
Manuscript received October 9, 2017; accepted for publication January 20, 2018; published Early Online January 23, 2018.
Supplemental material is available online atwww.genetics.org/lookup/suppl/doi:10. 1534/genetics.117.300374/-/DC1.
1These authors contributed equally to this work.
2013; Technowet al.2014; Kadamet al.2016). Traditionally, pedigree and genomic information on the parent lines have been used for predictions of breeding values, and the major-ity of studies in the past decade focused on conceiving and improving algorithms for exploiting the full potential of these data (Meuwissenet al.2001; Maenhoutet al.2010; Habier
et al.2011). Best linear unbiased prediction (BLUP) was ini-tially developed for animal breeding (Henderson 1984), and later established in plant breeding by Bernardo (1994). As an approach for polygenic traits, BLUP shrinks all effects equally and uses the degree of relatedness, based on pedigree infor-mation, to predict breeding values. However, coancestry co-efficients calculated from pedigree data are expectations, and can deviate from the realized relationship between individu-als because pairs of founder genotypes are considered unre-lated and Mendelian sampling is neglected, as are the effects of selection (Coxet al.1986; Speed and Balding 2015). Ge-nomic information addresses these issues but captures the activity of genes only imperfectly through linkage (Schopp
et al. 2017). Moreover, statistical models used in genomic prediction are limited in capturing physiological epistasis (Sackton and Hartl 2016), such as pervasive interactions be-tween loci throughout the genome (Bremet al.2005; Brown
et al.2014).
Recently, research turned toward exploring the predictive value of intermediary biological strata in the cascade from genotype to phenotype, expecting these would capture gene activities and integrate interactions within and among up-stream strata. The transcriptome reflects the active part of the genome by quantifying gene expression and has displayed promising properties for predicting yield performance in both maize inbred lines (Guoet al.2016) and hybrids (Westhues
et al.2017; Zenke-Philippiet al.2017). As thefinal stratum in the biological cascade, the metabolome might be expected to integrate all previous processes and interactions. It has in-deed yielded promising predictive abilities for lines (Guo
et al. 2016) and testcrosses (Riedelsheimeret al. 2012) in maize, and for hybrids in rice (Xu et al. 2016) and maize (Westhueset al.2017), when metabolites were sampled from plant tissue at an early development stage. In this study, for thefirst time, we augment the repertoire of“omics” predic-tors with small RNA (sRNA) sequences expected to further improve prediction of hybrid performance due to their in-volvement in transcriptional, post-transcriptional, and trans-lational processes of gene regulation (Lappalainen et al.
2013; Frankset al.2017; Liet al.2017).
In practical breeding programs, only pedigree and genomic data are currently established for routine analyses and appli-cations. It is therefore of great interest to compare genomic with other“omics”data regarding their ability to predict hy-brid performance in a dataset that represents an applied hybrid breeding program with important agronomic traits. Major questions include how consistently single predictors perform for different traits, and whether combining pre-dictors provides high predictive ability more consistently across traits, due to complementation of positive properties.
In addition, determining the impact of individual predictors within such combined predictors is of interest.
Our objectives were to (i) compare the performance of
“omics”or pedigree data as single predictors for the predic-tion of hybrid performance and (ii) investigate the benefit of combining them in major agronomic traits of grain maize by using multi-environmental phenotypic data of hybrids to-gether with pedigree, genomic, transcriptomic, and meta-bolic data of their parent lines.
Materials and Methods
Genetic material and agronomic data
A set of 1567 hybrids, denoted as HTot, was produced in 16 factorial mating designs between 143 Dent and 104 Flint lines from the maize breeding program at the University of Hohenheim (Stuttgart, Germany). The present study is an extension of the publication of Technow et al.(2014) who analyzed a subset of factorials for hybrid prediction on the basis of genomic data only. All HTothybrids were evaluated in field experiments between 1999 and 2014 at 4–10 (median: 7) agro-ecologically diverse environments across Germany. In the trials of each factorial, which included at least five common check genotypes, entries were randomized infield designs with incomplete blocks (a-lattice design, Patterson and Williams 1976) and planted in two-row plots. Traits de-termined were grain dry matter yield (GY, in tons per hect-are), adjusted to 155‰grain moisture, and grain dry matter content (GDMC, in percent). For a subset comprising 50 Dent and 41 Flint inbred lines, denoted asD= {1, 2, . . ., 50} and
F= {1, 2, . . ., 41}, data of all subsequently described pre-dictors were available. To ensure that comparisons among different predictor data types were carried out using identical sets of genotypes for all involved predictors, the initial HTot was restricted to the subset of crosses between D and F, resulting in a core dataset H⊂HTot, comprising 550 hybrids. These core set hybrids H, for which allfive predictor data types were available for both respective parents, were used for hybrid prediction. Pedigree-based relationship coefficients.
Pedigree data
Pedigree data (P) were analyzed for all parent lines at least back to the generation of their grandparents. Coancestry
coef-ficients (Falconer and Mackay 1996) were calculated for all pairs of lines within each heterotic group using SAS (version 9.4; SAS Institute) as detailed in Westhueset al.(2017).
Endophenotypes
Genomic SNP data (G) of all inbred lines were obtained with the Illumina SNP chip MaizeSNP50 (Ganalet al.2011). After performing quality checks as described by Technow et al.
seedlings per line were grown in a climate chamber. Seven days after sowing, whole seedlings were sampled, frozen in liquid nitrogen, pooled, and homogenized. Profiling with a custom microarray (GPL22267) resulted in 1323 transcripts. After raw data were normalized (Smyth and Speed 2003; Ritchieet al.2007), best linear unbiased estimates (BLUEs) and repeatabilities for transcript abundance were obtained separately for the Dent and Flint lines as described in Westhues et al. (2017). Passing a repeatability threshold set to 0.1 was required in both heterotic groups, resulting in 300 gene expression profiles for further analyses.
Transcriptomic sRNA data (S) were collected from all parent lines, of which 10 were replicated for calculation of repeatabilities. Four seeds per entry were taken from the same seed lot used for metabolite and mRNA profiling, and were grown at four different dates. At each date, seeds of all lines (with one seed per entry) were laid out in a completely randomized design, and grown under controlled conditions (25°16 hr day, 21°8 hr night, 70% air humidity) in a climate chamber. Seven days after sowing, for each entry, all four biological replicates were sampled as whole plants, pooled, and homogenized. Total RNA was isolated with the“mirVana miRNA isolation kit”(Ambion, Thermo Scientific). Illumina-compatible sequencing libraries were generated using the NEXTflex Small RNA Sequencing Kit v2 (BIOO SCIENTIFIC) and following the manufacturer’s recommendations with 1 mg of total RNA. Sequencing of 50-nt single end reads (SE50) was performed by the Beijing Genome Institute (BGI, Hong Kong, China) on an Illumina HiSeq 4000 se-quencer. After adapter removal, the reads were filtered for 99.9% sequencing quality (i.e., Phred quality score of 30 for all nucleotides). Read counts were determined for sequences from 18 to 40 nt. Across all entries, read counts were quan-tile-normalized according to Bolstad and Irizarry (2003), with a modification that maintains zero read counts for sequences not present in the respective sample. To enable comparison of libraries with varying sequencing depths, quantile-normalized read counts were scaled to 1 million reads per library and all sRNAs with at least one read per million quantile-normalized reads in two entries were retained. Processing of S data were carried out using custom Java scripts and resulted in 477,193 unique sRNA sequences. After a quality check requiring expression in at least 10% of all samples, and a repeatability threshold set to 0.9, 10,736 sRNA expression levels remained for further analyses. The raw and processed sRNA expression data are deposited at NCBI GEO under the accession GSE106098.
Metabolomic data of roots (R)of all parent lines were quantified as described in de Abreu e Limaet al.(2017). In short, for each of the two replicates per line, 10 seedlings were grown in climate chambers. The roots were harvested 3.5 days after sowing, pooled, and snap-frozen in liquid ni-trogen to quench metabolic activity at sampling. Profiling resulted in 284 metabolites. After raw data were normalized (van den Berget al.2006), BLUEs and repeatabilities (w2) for metabolite levels were obtained as detailed in de Abreu e
Limaet al.(2017) and Westhueset al.(2017). Passing a re-peatability threshold set to 0.3 was required in both heterotic groups, resulting in 148 root metabolites for further analyses.
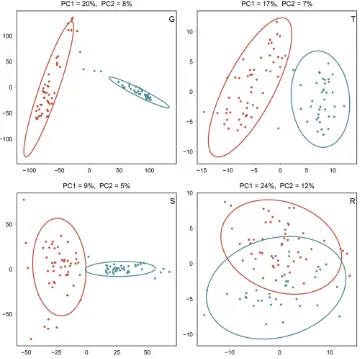
Principal component (PC) analysis of endophenotypes:
For predictors G, T, S, and R, individual variables were scaled and centered across both heterotic groups. For the observed two clusters, bivariate t-distributions were estimated with Maximum Likelihood, and their 0.95 quantiles were used to plot ellipses.
Statistical analysis of agronomic traits
Agronomic data of hybrids were analyzed in two stages, as outlined by Westhues et al. (2017). Briefly, adjusted entry means were determined for each environment, followed by a second stage of analysis, entailing the computation of BLUEs for all hybrids in HTot. For hybrids in the core set H, these BLUEs were used as response variables in the statistical models for predicting the hybrid performance. General com-bining ability (GCA) and specific combining ability (SCA) of parent lines, as well as variance components (s2
GCAD;s
2
GCAF; s2
SCA) of all hybrids in HTot, were estimated as described by Westhueset al.(2017), in a random effects model with geno-mic relationship matrices for GCA and SCA effects using ASReml (Butleret al.2009). The genomic relationship matri-ces for GCA effects of Dent and Flint parents,GDandGF, were
determined as detailed below, and for SCA by multiplying the corresponding elements of GD and GF, as in Bernardo
(1996). Heritabilities (H2) were computed on an entry-mean basis (Massmanet al.2013) asH2¼ ðs2
GCADþs2GCAFþs2SCAÞ=
ðs2
GCADþs2GCAFþs2SCAþs2R=eHÞ;wheres2Rwas the residual
er-ror variance, andeHthe harmonic mean of the number of test
environments per hybrid.
Comparison of predictive abilities
A cross-validation (CV) scheme, stratified by the parent lines (Technow et al.2014) and comprising 1000 runs, was ap-plied to obtain unbiased estimates of the predictive ability, and to compare different predictor combinations, as detailed in Westhueset al.(2017). Briefly, 35 of 50 Dent and 29 of 41 Flint lines were sampled as training parents in each CV run. From all available hybrids between the 35 Dent and 29 Flint training parents, 200 were sampled at random as training hybrids. With this procedure, the 550 core set hy-brids H were partitioned into 200 training set hyhy-brids“TRN” and 350 test set hybrids“TST,”the latter comprisingnT2=
74 T2 hybrids (both parents tested in TRN),nT1d= 111 T1d
hybrids (dent parent tested), nT1f = 117 T1f hybrids (flint
parent tested), andnT0= 48 T0 hybrids (neither parent tested
in TRN) on average across all 1000 CV runs. For each hybrid fraction in a TST and for each scenario, defined as a single or combined predictor applied to a specific trait, predictive abilities were computed by using the same partitioning of TRN and TST samples. This resulted in s vectors pT2, pT1d, pT1f and pT0,
comparable across all scenarios. Predictive abilities were obtained for each hybrid type, each scenario, and for each CV run by calculating Pearson correlations between predicted (^y) and observed phenotypes (y).
Prediction models
Hybrid performance was predicted on the basis of the TRN hybrids in each CV run using predictor data (P, G, T, S, and R) that were available for the corresponding sets of parent linesD
andF, respectively. A GCA model was used for predicting the performance of TST hybrids as described by Westhueset al.
(2017). Correspondingly,WDandWFare matrices of feature
measurements for the respective predictors (G, T, S, and R). The dimension ofWDandWF, respectively, is determined by
the number of parent lines in the corresponding heterotic group (lD= 50 andlF= 41) times the number of features in
the corresponding predictor (mG= 37,392;mT= 300;mS=
10,736; and mR = 148). The columns inWDandWFwere
centered and standardized to unit variance. For each predictor and lines from each heterotic group, kernels were defined as
GD¼ 1
mWDW
T
D;GF ¼1
mWFW
T
F; (1)
wheremdenotes the number of features for the respective predictor (VanRaden 2008),WTDthe transpose ofWD, andWTF
the transpose ofWF. In the case of P, coancestry coefficients
were standardized forGDandGF, respectively. The model for
GCA effects was as follows:
y¼mþX
C
c¼1
ZDgDcþ
XC
c¼1
ZFgFcþe; (2)
where y is the vector of observed hybrid performance (BLUEs), m is the fixed model intercept, ZD is the design
matrix for random GCA effects of the lines inD(gDc), andZF
is the design matrix for random GCA effects of the lines inF
(gFc), referring to the c-th predictor data type. With this
model, one predictor (C= 1) or multiple (C.1) predictors can be considered simultaneously. The random effects (gDc
andgFc) have expectation zero and covariance matrices equal
toGDcs2GCADcandGFcs2GCAFcfor the GCA effects of the Dent and
Flint lines, respectively, andIs2
efor the residual error. ForC.
1,gDcandgFc(c= 2. . .C) were assumed to be stochastically
independent, and variance components for Dents2
GCADc and
Flints2
GCAFcwere combined for each predictor,c, and stored as
relative variance,vc, in each CV run for later analysis of the
relative variances of the C predictors. By enhancing the model with SCA effects we arrived at the universal model for GCA and SCA effects described by Westhueset al.(2017).
In a modified approach, the model (Equation 2) was extended for predictor-specific weightswc:
y¼mþX
C c¼1
ZDgDcwcþ
XC
c¼1
ZFgFcwcþe; (3)
wherewc2 ½0;1;
PC
c¼1wc¼1:Kernels ofC = 3 predictors
(P, G, and T) were weighted and summed up, resulting in one joined weighted kernel per heterotic group. A grid search, varying the weights wP, wG, and wT in increments of 0.1,
resulted in 66 different joined weighted kernels for Dent and Flint, respectively. For each of these 66 joined weighted kernels, the CV procedure was carried out using the same partitioning of TRN and TST samples as for all other analyses in this study. Consequently, for each weight combination, the median across 1000 predictive abilities was reported. In prin-ciple, this approach could be extended to include all five predictors, but computational demand becomes markedly higher with more dimensions.
All predictions were carried out in a computationally efficient manner by mixed model equations implemented in the R package“sommer”(Covarrubias-Pazaran 2016), pro-viding BLUPs for hybrid performance.
Data availability
All statistical analyses, unless stated otherwise, were carried out using R (R Core Team 2016). The agronomic traits data of hybrids are available in the Supplemental Material, “ agro-nomic.txt”inFile S1. The pedigree and genomic data of the parent lines are available in the supplementalfiles“pedigree. txt”inFile S1and“genomic.txt”inFile S1, respectively. The metabolic data of the parent lines can be downloaded as table S1 of de Abreu e Limaet al.(2017) athttps://doi.org/10.1111/ tpj.13495. The transcriptomic data of the parent lines can be downloaded from the National Center for Biotechnology In-formation at https://www.ncbi.nlm.nih.gov/geo with GEO accessions GPL22267 (for the mRNA data) and GSE106098 (for the sRNA data).
Results
Agronomic traits
Variance components of GCA effects were larger for Dent than for Flint parent lines, especially for GY (Table 1). The SCA effects for GY and GDMC contributed 8.5 and 7.1%, respec-tively, to the total genetic variance. Entry-mean heritabilities
H2of all hybrids were higher for GDMC (0.96) than for GY (0.91).
Table 1 GY and GDMC of the entire set HTotof 1567 hybrids, characterized by overall mean (m), variance components of GCA effects for
Dent (s2
GCAD) and Flint lines (s2GCAF) and of SCA effects (s2SCA) as well as entry mean heritabilities (H2). Each is followed by its SE
Trait m s2
GCAD s2GCAF s2SCA H2
GY (t/ha) 11.60 0.7260.09 0.3760.06 0.1060.01 0.9160.008
Population structure and kernel matrices
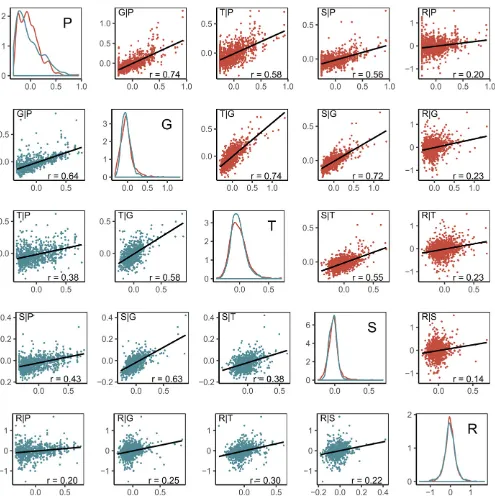
Dent and Flint lines were well separated for G, T, and S, and partially overlapped for R on the basis of the predictor data (Figure 1). Off-diagonal elements of the kernelsGDandGF,
respectively, exhibited strong associations (Figure 2) be-tween G and each of P, T, or S, both for Dent (0.72 # rD#0.74), and slightly lower for Flint (0.58#rF #0.64)
lines. In contrast, associations between R and all remaining predictors were weak (0.14#r#0.30). Remaining associ-ations among P, T, and S were intermediate.
Single predictors
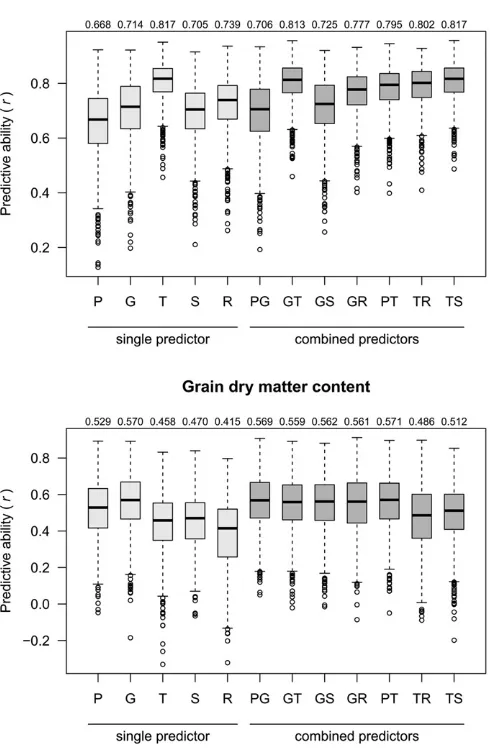
All of the following results refer to the prediction of T0 hybrids, unless stated otherwise. The median of predictive abilities from 1000 CV runs was obtained for each scenario where a single or combined predictor was applied to a specific trait. No predictor achieved consistently superior ranking for predictive ability (i.e.,first or second highest among thefive single predic-tors) for both traits simultaneously. The predictive ability for G was distinctly higher than for P and also higher than for S (Figure 3) for both traits. For GY, the predictor G was outper-formed distinctly by T, and slightly by R, while, for GDMC, G was the best single predictor. Predictor T was always superior to R, and superior to S for GY, or nearly equal to it, for GDMC. The
only single predictor that ranked relatively consistently across traits was S (Figure S1 inFile S2); however, at a low level. Including SCA effects into our models did not improve predictive abilities (Table S1 inFile S2) for genomic, transcriptomic, and metabolomic data, and did not change the ranking of predictors.
Combining two predictors
Predictive abilities of the predictor combination PG were similar to those of G, and higher than for P (Figure 3 and Figure S2 in File S2). For GY, combining G with a second predictor other than P improved the predictive ability to a level superior to G alone, with the biggest improvement for GT, and, although less pronounced, for GR and GS. For GDMC, where G was the best single predictor, no improve-ment was observed. The best single predictor for GY was T, and combinations of T with any other predictor did not fur-ther improve predictive ability. The predictor combinations GT and PT performed consistently well across both traits (Figure S1 inFile S2). Comparing pairs of single predictors with their combinations (Figure S2 inFile S2) revealed that combinations comprising the best single predictor of the re-spective trait had similar or slightly lower predictive ability than the superior single component. Combinations of two predictors not comprising the best single predictor of the
respective trait had higher predictive abilities than any of its components as single predictors. An exception was PG, where the combination was nearly identical to G alone.
Model combining three predictors P, G, and T
The three predictors P, G, and T were combined as indepen-dent factors (Equation 2) for the PGT model and provided median predictive abilities of 0.795 for GY and 0.573 for GDMC. The relative variances per predictor (combined for
Dent and Flint) werevP= 0.20,vG= 0.21, andvT= 0.59
for GY, andvP= 0.31,vG= 0.42 andvT= 0.27 for GDMC, on
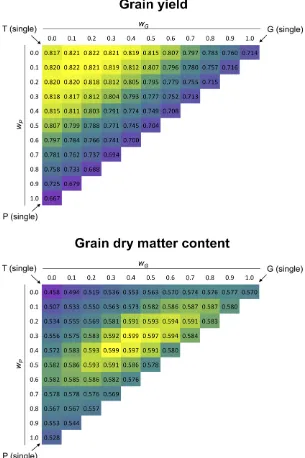
average across all 1000 CV runs. When combining the three predictors by joined weighted kernels (Equation 3) in a grid search (Figure 4), the highest predictive abilities for GY (r = 0.822) were obtained with weightswP = 0.1,wG = 0.1,
wT = 0.8 orwP = 0.0,wG = 0.2,wT = 0.8, and for GDMC
(r = 0.599) with weightswP = 0.4,wG = 0.3,wT = 0.3, or
wP = 0.3,wG = 0.4,wT = 0.3. The sensitivity of the predictive
ability to varying weights (Figure S3 inFile S2) matched well with the range of predictive abilities of the three contributing single predictors for GY. In contrast, for GDMC, the majority of the distribution exceeded the value of predictive ability of the superior single predictor G.
Comparison of T0, T1, and T2
For GY, predictive abilities of T2, T1d, and T1f hybrids were on a similar level (Figure S4 inFile S2), and were clearly separated from the lower values of T0 hybrids, however, with one exception: if T was included as a predictor, then predictive abilities for T0 hybrids were on a similarly high level as those for T1d, T1f, and T2 hybrids. For GDMC, predictive abilities were on clearly sepa-rated levels for T2 (high), T1d, as well as T1f (medium) and T0 (low) hybrids for all investigated single and combined predictors.
Discussion
In modern maize breeding programs, the DH and rapid SSD methods enable the production of thousands of parent lines
and thus—hypothetically—millions of hybrids anew in each season. Similar progress is expected for other crops (Wedzony
et al.2009), especially with the cloning of the gene MATRILIN-EAL, which triggers haploid induction in maize (Kelliheret al.
2017). Testing all these potential hybrid candidates in multi-en-vironmentfield trials is logistically and economically prohibitive. Any features that can be assessed on the parent lines in a high-throughput fashion at an early stage of plant development under standardized conditions, independent of season, and at accept-able costs, might prove useful to forecast the performance of hybrid candidates. In principle, this reduces the number of geno-types on which data have to be collected fromn2hybrids down to only 2nparent lines plus a moderately sized set of hybrids for training. Thus, breeding programs could become more efficient by producing and field testing only the most promising of the forecasted hybrid candidates.
Foundation of hybrid prediction
The careful establishment of genetically diverse heterotic groups is regarded as the foundation of hybrid breeding programs (Melchinger 1999). The breeding program at the University of Hohenheim, which generated the material used throughout this study, was based on these principles and comprises a heterotic pattern of Flint lines, predominantly based on landraces introduced to Europe centuries ago, and Dent lines, established from the Iowa Stiff Stalk Synthetic, and more recently introduced North American material (Stich et al.2005; Fischeret al.2008). Compared to Dent, the lower GCA variances in Flint corroborate the lower di-versity of the long-established European Flint group, as ob-served in previous studies on grain maize hybrids from the same breeding program (Fischer et al. 2008; Schrag et al.
2010). Consistent with the breeding history, the PC analyses based on G, T, and S showed clearly separated heterotic groups (Figure 1).
Such clearly defined and separated heterotic groups re-sult in decreased ratios of SCA variance to GCA variance, and, thereby, increase the efficiency of hybrid selection (Melchinger 1999; Reifet al.2007). Accordingly, in our study, SCA variances were considerably smaller than GCA variances (Table 1), supporting estimates from previous studies in Eu-ropean grain maize (Fischeret al.2008; Schraget al.2010; Technowet al.2014) and silage maize (Argillieret al.2000; Griederet al.2012; Westhueset al.2017). These small SCA variances explain why incorporating SCA effects into the pre-diction models did not further improve predictive abilities (Table S1 in File S2), similar to what was observed by Westhueset al.(2017) in a related dataset for silage maize. In contrast, distinctly larger ratios of SCA to GCA variance were reported by Bernardo (1996) and Kadamet al.(2016), where the latter study comprised materials originating exclu-sively from several North American Dent heterotic groups. Heritabilites on an entry-mean basis corresponded well to estimates published by Massmanet al.(2013), who reported 0.85 for GY and 0.98 for grain moisture among maize single-crosses.
Exploiting established predictors
Pedigree information wasfirst used for progeny prediction (Bernardo 1994) because it was available at practically no cost and did not require sampling of any plant tissue. In our study, P was neither a superior predictor for GY nor for GDMC. While P surpassed the performance of all nonge-nomic predictors for GDMC, it performed most poorly for the more complex trait GY. This lack of predictive ability could be explained by the inability of P to account for any-thing but the expected relationship between two individuals. Conversely, the observed superiority of G over P for both in-vestigated traits could be the result of direct estimation of the actual relationship between the inbred parent lines by the SNPs capturing both Mendelian sampling and the effects of selection (Cox et al.1986; Speed and Balding 2015). In
addition to realized relationship, genomic information also captures linkage disequilibrium (LD) between SNP markers and quantitative trait loci (QTL), thereby providing proxies for the relationship at the QTL (Schoppet al. 2017), but is very limited in addressing the activity of genes.
Capturing physiological epistasis
Other factors that influence the phenotype include the per-vasive interactions between loci (Brem et al.2005; Brown
et al.2014), especially for single-cross hybrids, in which all types of epistasis are fully used in selection (Cockerham 1961). Attempts to model such epistatic effects with genomic data by extending the model were largely unsuccessful (Hill
et al.2008; Guoet al.2016) unless the training and test set shared close relatives (Jiang and Reif 2015). Given that
Figure 4 Predictive abilities (r) for T0 hybrids in GY and GDMC, respectively, for 66 cases that differ in their weights for the predictors P, G, and T. Their correspond-ing kernels were joined with weights varycorrespond-ing from 0 to 1 in increments of 0.1. Weights for P (wP) and G (wG) are
shown at the respective scales; weights for T arewT =
12wP2wG. Plotted values represent medians ofracross
genetic effects on the phenotypefirst pass through the inter-mediary transcriptome, proteome and metabolome (Ritchie
et al.2015), these biological strata—also called“ endopheno-types”(Mackayet al.2009)—offer the prospect of capturing and incorporating effects from the genome or any other up-stream stratum including expression of genes or levels of gene products. The transcriptome, as the second biological stratum after the genome and reflecting its active part, is expected to incorporate gene expression and physiological epistasis (Sackton and Hartl 2016), going beyond mostly negligible statistical epistasis at the population level. Indeed, T was clearly the best single predictor for the more complex trait GY, supporting this hypothesis. Similar results with regard to genomic and mRNA data were published by Westhueset al.(2017), who tested the same factorial designs for silage maize traits in a subset of environments, and by Zenke-Philippi et al.(2017), who tested a smaller subset of the factorial designs for grain maize traits. The possibility of artificially high predictive abilities for T, due to a potential preselection bias of the custom mRNA chip, was ruled out by Westhueset al.(2017), who used the same T data. Addition-ally, independent studies also reported quite good perfor-mance of transcriptomic RNA-Seq data for the prediction of several yield-related traits in maize inbred lines (Guo et al.
2016), as well as for prediction of hybrid rice performance (Xu et al. 2016). Harnessing such advantages of transcrip-tomic data appears especially relevant in a hybrid breeding program if a very small fraction of candidates is selected from the huge number of possible hybrids, because the probability of successfully selecting the best hybrid candidates is a strongly convex function of predictive ability (Westhues
et al.2017). Accordingly, because the predictive ability of T for T0 hybrids in GY was 14% higher than for G, this would result in an approximately twofold higher success rate for selecting the top 100 hybrids out of 106predicted candidates for seed production and intensive testing infield trials.
Exploring further transcriptomic predictors
Phenotypic buffering suggests that information on down-stream“omics”predictors cannot necessarily be inferred from upstream predictors. For instance, increasing copy numbers of genes in yeast did not directly increase their expression levels, which may be an indicator for post-transcriptional regulation (Ishikawa et al. 2017). Micro-RNAs (miRNA), which are a subset of sRNAs, can repress the expression of genes by guiding RNA-induced silencing complexes (RISC) to their complementary mRNA (Mortimeret al.2014). In addi-tion to miRNAs, plants produce a wide variety of other sRNAs that regulate gene expression at the transcriptional level by directing epigenetic modifications of chromatin, likely equally contributing to phenotypic plasticity (Borges and Martienssen 2015). In our study, however, predictive abilities of S as a single predictor were weak, and, depending on the trait, similar or superior predictive abilities were achieved when using G or T (Figure S1 in File S2). Nonetheless, S never ranked last among allfive predictors.
Given that the relative contributions of transcriptional and post-transcriptional regulation determine the usefulness of mRNA levels to infer protein levels, the combination of mRNA with sRNA data might therefore suggest an intriguing alter-native to capturing information similar to the further down-stream proteome itself (Frankset al.2017). Indeed, in our results for GY, predictive ability of TS was the highest among predictor combinations, but not superior to T as a single pre-dictor (Figure 3). For GDMC, although the combination TS provided slightly higher predictive ability than T or S alone, no overall superiority was observed.
Approximating the phenotype
As the last biological stratum in the complex genotype-phe-notype cascade, the metabolome is expected to capture and integrate all previous main effects and interactions within and among the various strata (Pattiet al.2012). For GY, predictive abilities based on R were higher than those achieved using G, albeit still lower than those obtained from using T. Hence, our results support previousfindings on the potential of me-tabolites for predicting plant yields in studies on rice hybrids (Xu et al.2016) and silage maize hybrids (Westhueset al.
2017). In contrast, for GDMC, predictive abilities of R were lowest, which is also in accordance with results from silage maize hybrids for dry matter content (Westhueset al.2017). It should be noted that in Westhueset al.(2017), as well as in our study, the metabolites were sampled from seedlings only a few days after sowing and grown in climate chambers. Less promising results have been reported for predictions based on leaf metabolites sampled from plants in the field 1 month after sowing (Westhueset al.2017), highlighting the impact of environmental factors on metabolite profiles. More generally, the perturbation of feature levels in endophe-notypes such as transcripts, metabolites, and proteins is con-siderably higher than for genomic sequence or marker data. Endophenotypes are responsive to nongenetic factors such as abiotic (Caldanaet al.2011; Waterset al.2017) and biotic (Tzinet al.2015) effects, and susceptible to varying sampling conditions, as applies especially to metabolites with ex-tremely fast turnover rates (Arrivaultet al.2009). Addition-ally, age (Francesconi and Lehner 2014; Meléet al.2015) and type of tissue (Meléet al.2015; Searleet al.2016) are impact-ing on the feature levels of endophenotypes.
Choice of sampling stage
simultaneously (leaf, shoot, and root) is easier with seedlings than with fully developed plants infield plots. Another advan-tage is the shorter cultivation period, with which prediction results become more rapidly available to produce the pre-dicted superior hybrids for further testing. Overall, sampling of the parent lines at an early stage of plant development un-der controlled and standardized conditions appears as an ideal basis to assess features in a high-throughput manner to fore-cast the performance of hybrid candidates in applied breeding programs.
Caveats of downstream predictors
While endophenotypes downstream of the genome may in-corporate heritable upstream interactions within and among strata (Dalchauet al.2011; Zhuet al.2012), it must be con-sidered that endophenotypes are responsive to nongenetic factors as discussed above. Technical limitations impose fur-ther potential constraints on the direct use of some endophe-notypes. For example, even very recent metabolite-profiling technologies (Xuet al.2016) capture only a small subset of the estimated total set of metabolites occurring in nature (Fernie 2007), and currently, it is still difficult to reliably quan-tify a large number of proteins (Frankset al.2017). Moreover, measurement error is another source of noise, reducing the predictive power of endophenotypic features. Evaluations of predictive abilities, determined at various thresholds for re-quired repeatability of individual T, S, or R features, suggested that intermediate thresholds provide highest predictive abil-ities, striking a balance between a minimum degree of repeat-ability on the one hand and a sufficient number of features on the other (Figure S5 inFile S2). The optimum thresholds cor-responded well between GY and GDMC, but differed among predictors, which may have multiple causes. First, the data sets of T, S, and R differed in their design, and, more specifically, in the number of replicated samples, which influences the impact of noise and also the precision of measurements. Second, the technologies for analyzing these endophenotypes differed, and are most likely associated with different levels of precision. Third, features of T, S, and R specifically interact with envi-ronmental and physiological factors while genomic sequence data remains unaffected by them. Fourth, the predictor data sets differed widely in their numbers of features, ranging from 284 for R to 477,193 for S in their initial data sets. Due to such differences among data sets of endophenotypes, the thresh-olds chosen for required feature repeatability were specific to each predictor.
Prediction of T2, T1, and T0 hybrids
The theoretical upper bound for predictive ability is given byffiffiffiffiffiffi
H2 p
(Bernardo 1996), which is in accordance with all ob-served predictive abilities for T0, T1, and T2 hybrids in both traits (Figure S4 inFile S2). Further, the fraction of epistatic effects contributing to the covariance between hybrids, and captured by P or G, is expected to increase with the degree of relatedness among individuals (Westhueset al.2017). It is therefore expected to be large for T2, intermediate for T1,
and small for T0 hybrids. For GDMC, this corresponds to the observed high level of predictive abilities for T2 hybrids along with small differences among the corresponding predictors, the intermediate level of predictive abilities for T1 hybrids, and the low level of predictive abilities along with larger differ-ences among predictors for T0 hybrids (Figure S4 in File S2). For GY, the predictive abilities for T2 hybrids also conform with these expectations. Moreover, the predictive abilities for T2 hybrids in GY were lower than in GDMC for all considered predictors (Figure S4 inFile S2), which is in accordance with the lower heritability of GY compared to GDMC.
Interestingly, in GY, predictive abilities for T1 hybrids were nearly as high as those for T2 hybrids, and with only little variation among predictors. Similar observations were also obtained for T0 hybrids. Consequently, predictive abilities in T1 and T0 hybrids for GY were almost always greater than those for GDMC, which is inverse to the ratio observed for T2 hybrids. These unexpected results may be related to the capability of predictors capturing epistasis and warrant further research.
Usefulness of predictors across traits
From an economic perspective, a single predictor with good predictive ability for multiple traits would be highly desirable. While T and R exhibited highest predictive abilities for GY, they were lowest for GDMC. And whereas G and P were superior predictors for GDMC, they performed relatively poorly for GY (Figure 3 and Figure S1 inFile S2). Such strong interactions between trait and predictor were also observed in studies on hybrids for silage maize traits (Westhueset al.
2017), and on inbred lines for grain maize traits (Guoet al.
2016), which indicates that for prediction with“omics” -de-rived kernels, the merit of an“omics”data type strongly de-pends on the trait under investigation. In practice, knowledge on the suitability of available predictors for a given trait could be derived either from previous studies or from CV applied to all available data, i.e., the training data set. Alternatively, multiple predictors could be combined in one model, aiming to provide consistently high predictive ability across traits by complementing favorable properties of different predictors.
Combining different predictor types
By comparing pairs of single predictors with their combina-tions (Figure S2 inFile S2), we can draw two conclusions. First, combining the best single predictor for a certain trait with another predictor did not improve predictions, and, in some cases, rather impaired predictive ability. Second, com-binations that did not comprise the best single predictor tended to be superior to both components individually.
with all observations, except for GP, indicating that there is no complementary effect of P beyond G. However, absence or presence of complementary effects could not be connected to the observed degrees of association between the kernel
coef-ficients for the respective predictors (Figure 2).
The consistently good performance of GT across both traits may be explained by the fact that it combines the best single predictor for GY (T) and for GDMC (G). Further, the relatively good performance of PT in GY may be due to the contribution of T as the best single predictor for GY. Although neither P nor T were the best single predictor for GDMC, this combination also performed well for GDMC, which may be explained by the high association between P and G for their kernel coefficients (Figure 2), and by the observation that P is the second ranked single predictor for GDMC after G. In addition, T seems to capture a fraction of the information in G that is complementary to P so that the combination PT performed comparably to the best single predictor G and even slightly better than GT for GDMC. These combina-tions—GT and PT—provided some advantages for predic-tion, not only in this study on yield-related traits in grain maize, but also for several yield and quality-related traits in silage maize (Westhueset al.2017).
Finally, we studied the triple combination PGT, because P could be considered a generally available source of informa-tion, and G and T were the best single predictors for the two traits under investigation. Predictive abilities of PGT, when compared to the related two-predictor combinations GT and PT, were lower for GY, but higher for GDMC. To arrive at clear recommendations for the predictors P, G, and T, we further investigated their relevance using three approaches: (1) rank-ing of srank-ingle predictors with respect to predictive abilities, (2) examining relative variance components from a model com-prising all three predictors as independent factors, and (3) determining weights by a grid search on joined weighted kernels. For GY, all three approaches clearly indicated that T had a high impact for predicting hybrid performance, while G followed by P had lower impact. For GDMC, the order of impact was G, P, and T, albeit differences among these predictors were less pronounced than for GY.
Application in breeding programs
Despite the shown benefits of using transcriptomic data for hybrid prediction, the currently higher sampling costs of endophenotypes compared to genomic data should not be neglected. One strategy to balance costs and benefits could be a selective “omics”-screening strategy, where transcrip-tomic measurements are only taken on a subset of genotypes. For all other genotypes, which have pedigree and genomic records, transcriptomic values could possibly be imputed (Gamazon et al. 2015), thereby boosting predictive ability while limiting expenses. Further open points are whether parent lines should first be selected based on their per se
performance before carrying out molecular analyses, and to which degree the production and field evaluation of testcrosses is still required when applying “omics”-based
prediction methods. Ultimately, these operational and economic aspects need to be considered well for successful application in applied breeding programs and warrant fur-ther research.
Conclusions
We have shown that the excellence of a predictor is highly trait-dependent. The respective best single predictor was always comparable or superior to any combination of pre-dictors, highlighting the sufficiency of a single predictor for the prediction of one trait. Due to the interaction between trait and predictor, the prediction of multiple traits can benefit from the complementation of predictors if the best single predictor for any trait is unavailable. Given that P, and often also G, are available in hybrid breeding programs, their combination with T seems to provide a robust basis for prediction of a broad spectrum of traits. Based on the crucial role of mRNA for the genotype-phenotype cascade, we spec-ulate that combining T with G or P enables superior pre-dictive abilities, warranting further research on using mRNA for maize hybrid prediction.
Acknowledgments
We thank the staff of the Agricultural Experimental Re-search station, University of Hohenheim, for excellent technical assistance in conducting the field experiments, H. P. Piepho and H. F. Utz for their advice on the statistical analyses, as well as T. Würschum, W. Molenaar, and two anonymous reviewers for valuable suggestions to improve the content of the manuscript. We are indebted to the group of R. Fries from Technische Universität München for the SNP genotyping of the parent inbred lines, and to A. Schlereth, M. Stitt, Z. Nikoloski, and L. Willmitzer of the Max-Planck Institute of Molecular Plant Physiology, Potsdam, Germany, who designed and conducted the metabolic experiments, published in previous publications (de Abreu e Lima et al.
2017; Westhueset al.2017). Further, we acknowledge the computational support by the state of Baden-Württemberg through bwHPC. This project was funded by the German Federal Ministry of Education and Research (BMBF) within the projects OPTIMAL (FKZ: 0315958B, 0315958F) and SYNBREED (FKZ: 0315528D), and by the German Research Foundation (DFG, Grants No. ME 2260/5-1 and SCHO 764/ 6-1). Financial support for M.W. was provided by the Fiat Panis Foundation, Ulm, Germany.
Literature Cited
Argillier, O., V. Mechin, and Y. Barrière, 2000 Inbred line evalu-ation and breeding for digestibility-related traits in forage maize. Crop Sci. 40: 1596–1600.
Arrivault, S., M. Guenther, A. Ivakov, R. Feil, D. Vosloh et al., 2009 Use of reverse-phase liquid chromatography, linked to tandem mass spectrometry, to profile the Calvin cycle and other metabolic intermediates in Arabidopsis rosettes at different car-bon dioxide concentrations. Plant J. 59: 824–839.
Bernardo, R., 1994 Prediction of maize single-cross performance using RFLPs and information from related hybrids. Crop Sci. 34: 20–25.
Bernardo, R., 1996 Best linear unbiased prediction of maize sin-gle-cross performance. Crop Sci. 36: 50–56.
Bolstad, B. M., and R. A. Irizarry, 2003 A comparison of normal-ization methods for high density oligonucleotide array data based on variance and bias. Bioinformatics 19: 185–193. Borges, F., and R. A. Martienssen, 2015 The expanding world of
small RNAs in plants. Nat. Rev. Mol. Cell Biol. 16: 727–741. Brem, R. B., J. D. Storey, J. Whittle, and L. Kruglyak, 2005 Genetic
interactions between polymorphisms that affect gene expression in yeast. Nature 436: 701–703.
Brown, A. A., A. Buil, A. Vinuela, T. Lappalainen, H. F. Zhenget al., 2014 Genetic interactions affecting human gene expression identified by variance association mapping. eLife 3: e01381. Browning, B. L., and S. R. Browning, 2009 A unified approach to
ge-notype imputation and haplotype-phase inference for large data sets of trios and unrelated individuals. Am. J. Hum. Genet. 84: 210–223. Butler, D. G., B. R. Cullis, A. R. Gilmour, and B. J. Gogel, 2009 Mixed Models for S Language Environments: ASReml-R Reference Manual. Training Series QE02001. Queensland Depart-ment of Primary Industries and Fisheries, NSW DepartDepart-ment of Primary Industries, Brisbane.
Caldana, C., T. Degenkolbe, A. Cuadros-Inostroza, S. Klie, R. Sul-piceet al., 2011 High-density kinetic analysis of the metabo-lomic and transcriptomic response of Arabidopsis to eight environmental conditions. Plant J. 67: 869–884.
Cockerham, C. C., 1961 Implications of genetic variances in a hybrid breeding program. Crop Sci. 1: 47–52.
Covarrubias-Pazaran, G., 2016 Genome-assisted prediction of quantitative traits using the R package sommer. PLoS One 11: e0156744.
Cox, T. S., J. P. Murphy, and D. M. Rodgers, 1986 Changes in genetic diversity in the red winter wheat regions of the United States. Proc. Natl. Acad. Sci. USA 83: 5583–5586.
Dalchau, N., S. J. Baek, H. M. Briggs, F. C. Robertson, A. N. Dodd
et al., 2011 The circadian oscillator gene GIGANTEA mediates a long-term response of the Arabidopsis thaliana circadian clock to sucrose. Proc. Natl. Acad. Sci. USA 108: 5104–5109. de Abreu e Lima, F., M. Westhues, A. Cuadros-Inostroza, L.
Will-mitzer, A. E. Melchingeret al., 2017 Metabolic robustness in young roots underpins a predictive model of maize hybrid per-formance in thefield. Plant J. 90: 319–329.
Duvick, D. N., 1999 Heterosis: feeding people and protecting nat-ural resources, pp. 19–29 in The Genetics and Exploitation of Heterosis in Crops, edited by J. G. Coors, and S. Pandey. ASA-CSSA, Madison, WI.
Falconer, D. S., and T. F. Mackay, 1996 Introduction to Quantitative Genetics. Longman Group, Essex, UK.
Fernie, A. R., 2007 The future of metabolic phytochemistry: larger numbers of metabolites, higher resolution, greater under-standing. Phytochemistry 68: 2861–2880.
Fischer, S., J. Möhring, C.-C. Schön, H.-P. Piepho, D. Klein et al., 2008 Trends in genetic variance components during 30 years of hybrid maize breeding at the University of Hohenheim. Plant Breed. 127: 446–451.
Francesconi, M., and B. Lehner, 2014 The effects of genetic vari-ation on gene expression dynamics during development. Nature 505: 208–211.
Franks, A., E. Airoldi, and N. Slavov, 2017 Post-transcriptional reg-ulation across human tissues. PLoS Comput. Biol. 13: e1005535. Gamazon, E. R., H. E. Wheeler, K. P. Shah, S. V. Mozaffari, K. Aquino-Michaelset al., 2015 A gene-based association method for mapping traits using reference transcriptome data. Nat. Genet. 47: 1091–1098.
Ganal, M. W., G. Durstewitz, A. Polley, A. Bérard, E. S. Buckleret al., 2011 A large maize (Zea mays L.) SNP genotyping array: de-velopment and germplasm genotyping, and genetic mapping to compare with the B73 reference genome. PLoS One 6: e28334. Grieder, C., B. S. Dhillon, W. Schipprack, and A. E. Melchinger,
2012 Breeding maize as biogas substrate in Central Europe: II. Quantitative-genetic parameters for inbred lines and correlations with testcross performance. Theor. Appl. Genet. 124: 981–988. Guo, Z., M. M. Magwire, C. J. Basten, Z. Xu, and D. Wang,
2016 Evaluation of the utility of gene expression and meta-bolic information for genomic prediction in maize. Theor. Appl. Genet. 129: 2413–2427.
Habier, D., R. L. Fernando, K. Kizilkaya, and D. J. Garrick, 2011 Extension of the Bayesian alphabet for genomic selec-tion. BMC Bioinformatics 12: 186.
Henderson, C. R., 1984 Applications of Linear Models in Animal Breeding. University of Guelph, Guelph, ON.
Hill, W. G., M. E. Goddard, and P. M. Visscher, 2008 Data and theory point to mainly additive genetic variance for complex traits. PLoS Genet. 4: e1000008.
Ishikawa, K., K. Makanae, S. Iwasaki, N. T. Ingolia, and H. Moriya, 2017 Post-translational dosage compensation buffers genetic perturbations to stoichiometry of protein complexes. PLoS Genet. 13: e1006554.
Jiang, Y., and J. C. Reif, 2015 Modeling epistasis in genomic se-lection. Genetics 201: 759–768.
Kadam, D., S. Potts, M. O. Bohn, A. E. Lipka, and A. Lorenz, 2016 Genomic prediction of hybrid combinations in the early stages of a maize hybrid breeding pipeline. G3 6: 3443–3453. Kelliher, T., D. Starr, L. Richbourg, S. Chintamanani, B. Delzeret al.,
2017 MATRILINEAL, a sperm-specific phospholipase, triggers maize haploid induction. Nature 542: 105–109.
Lappalainen, T., M. Sammeth, M. R. Friedländer, P. A.’t Hoen, J. Monlonget al., 2013 Transcriptome and genome sequencing uncovers functional variation in humans. Nature 501: 506–511. Li, S., C. Castillo-González, B. Yu, and X. Zhang, 2017 The func-tions of plant small RNAs in development and in stress re-sponses. Plant J. 90: 654–670.
Mackay, T. F. C., E. A. Stone, and J. F. Ayroles, 2009 The genetics of quantitative traits: challenges and prospects. Nat. Rev. Genet. 10: 565–577.
Maenhout, S., B. De Baets, and G. Haesaert, 2010 Graph-based data selection for the construction of genomic prediction mod-els. Genetics 185: 1463–1475.
Massman, J. M., G. A. Gordillo, R. E. Lorenzana, and R. Bernardo, 2013 Genomewide predictions from maize single-cross data. Theor. Appl. Genet. 126: 13–22.
Melchinger, A. E., 1999 Genetic diversity and heterosis, pp. 99– 118 inThe Genetics and Exploitation of Heterosis in Crops, edited by J. G. Coors, and S. Pandey. ASA-CSSA, Madison, WI. Melchinger, A. E., and R. K. Gumber, 1998 Overview of heterosis
and heterotic groups in agronomic crops, pp. 29–44 inConcepts and Breedings of Heterosis in Crop Plants,CSSA Special Publica-tion no. 25, edited by K. R. Lamkey, and J. E. Staub. Crop Sci-ence Society of America, Madison, WI.
Meuwissen, T. H. E., B. J. Hayes, and M. E. Goddard, 2001 Prediction of total genetic value using genome-wide dense marker maps. Genetics 157: 1819–1829.
Mortimer, S. A., M. A. Kidwell, and J. A. Doudna, 2014 Insights into RNA structure and function from genome-wide studies. Nat. Rev. Genet. 15: 469–479.
Patterson, H. D., and E. R. Williams, 1976 A new class of resolv-able incomplete block designs. Biometrika 63: 83–92.
Patti, G. J., O. Yanes, and G. Siuzdak, 2012 Metabolomics: the apogee of the omics trilogy. Nat. Rev. Mol. Cell Biol. 13: 263–269. R Core Team, 2016 R: A Language and Environment for Statistical Computing. R Foundation for Statistical Computing, Vienna. Avail-able at:https://www.R-project.org. Accessed: October 9, 2017. Reif, J. C., F. M. Gumpert, S. Fischer, and A. E. Melchinger,
2007 Impact of interpopulation divergence on additive and dominance variance in hybrid populations. Genetics 176: 1931–1934.
Riedelsheimer, C., A. Czedik-Eysenberg, C. Grieder, J. Lisec, F. Technow et al., 2012 Genomic and metabolic prediction of complex heterotic traits in hybrid maize. Nat. Genet. 44: 217– 220.
Ritchie, M. D., E. R. Holzinger, R. Li, S. A. Pendergrass, and D. Kim, 2015 Methods of integrating data to uncover genotype– phe-notype interactions. Nat. Rev. Genet. 16: 85–97.
Ritchie, M. E., J. Silver, A. Oshlack, M. Holmes, D. Diyagamaet al., 2007 A comparison of background correction methods for two-colour microarrays. Bioinformatics 23: 2700–2707. Sackton, T. B., and D. L. Hartl, 2016 Perspective genotypic
con-text and epistasis in individuals and populations. Cell 166: 279– 287.
Schopp, P., D. Müller, and A. E. Melchinger, 2017 Accuracy of genomic prediction in synthetic populations depending on the number of parents, relatedness and ancestral linkage disequilib-rium. Genetics 205: 441–454.
Schrag, T. A., J. Möhring, A. E. Melchinger, B. Kusterer, B. S. Dhil-lon et al., 2010 Prediction of hybrid performance in maize using molecular markers and joint analyses of hybrids and pa-rental inbreds. Theor. Appl. Genet. 120: 451–461.
Searle, B. C., R. M. Gittelman, O. Manor, and J. M. Akey, 2016 Detecting sources of transcriptional heterogeneity in large-scale RNA-seq data sets. Genetics 204: 1391–1396. Smyth, G. K., and T. Speed, 2003 Normalization of cDNA
micro-array data. Methods 31: 265–273.
Speed, D., and D. J. Balding, 2015 Relatedness in the post-geno-mic era: is it still useful? Nat. Rev. Genet. 16: 33–44.
Stich, B., A. E. Melchinger, M. Frisch, H. P. Maurer, M. Hecken-berger et al., 2005 Linkage disequilibrium in European elite maize germplasm investigated with SSRs. Theor. Appl. Genet. 111: 723–730.
Technow, F., T. A. Schrag, W. Schipprack, E. Bauer, H. Simianer
et al., 2014 Genome properties and prospects of genomic pre-diction of hybrid performance in a breeding program of maize. Genetics 197: 1343–1355.
Tzin, V., N. Fernandez-Pozo, A. Richter, E. A. Schmelz, M. Schoett-neret al., 2015 Dynamic maize responses to aphid feeding are revealed by a time series of transcriptomic and metabolomic assays. Plant Physiol. 169: 1727–1743.
van den Berg, R. A., H. C. J. Hoefsloot, J. A. Westerhuis, A. K. Smilde, and M. J. Van der Werf, 2006 Centering, scaling, and transformations: improving the biological information con-tent of metabolomics data. BMC Genomics 7: 142.
VanRaden, P. M., 2008 Efficient methods to compute genomic predictions. J. Dairy Sci. 91: 4414–4423.
Waters, A. J., I. Makarevitch, J. Noshay, L. T. Burghardt, C. N. Hirsch et al., 2017 Natural variation for gene expression re-sponses to abiotic stress in maize. Plant J. 89: 706–717. Wedzony, M., B. Forster, I. Zur, E. Golemiec, M. Szechynska-Hebda
et al., 2009 Progress in doubled haploid technology in higher plants, pp. 1–33 in Advances in Haploid Production in Higher Plants, edited by A. Touraev, B. P. Forster, and S. M. Jain. Springer, Berlin.
Westhues, M., T. A. Schrag, C. Heuer, G. Thaller, H. F. Utzet al., 2017 Omics-based hybrid prediction in maize. Theor. Appl. Genet. 130: 1927–1939.
Xu, S., Y. Xu, L. Gong, and Q. Zhang, 2016 Metabolomic predic-tion of yield in hybrid rice. Plant J. 88: 219–227.
Zenke-Philippi, C., M. Frisch, A. Thiemann, F. Seifert, T. A. Schrag
et al., 2017 Transcriptome-based prediction of hybrid perfor-mance with unbalanced data from a maize breeding pro-gramme. Plant Breed. 136: 331–337.
Zhu, J., P. Sova, Q. Xu, K. M. Dombek, E. Y. Xu et al., 2012 Stitching together multiple data dimensions reveals in-teracting metabolomic and transcriptomic networks that modu-late cell regulation. PLoS Biol. 10: e1001301.