ABSTRACT
GARDNER, ANGELA NICHOLE. Fish Passage through Road Culverts. (Under the direction of Dr. Greg Jennings).
The North Carolina Department of Transportation (NCDOT) has regulations requiring road crossings to facilitate Aquatic Organism Passage (AOP). Due to a current inability to prove that AOP will not be inhibited, acquiring permits for the design and construction of culverts has become difficult. Often, bridges costing up to three times as much must be built in their place. To improve the design of culverts and the feasibility of obtaining a permit, this study determined the maximum swimming speed that can be sustained by a fish for a period of ten minutes. This speed, known as the critical velocity, is equivalent to traversing a 100m culvert. The critical velocities were determined for the following fish species native to the piedmont of North Carolina: Nocomis leptocephalus, Lepomis auritus, Etheostoma nigrum, Lepomis macrochirus, Noturus insignis, Notropisprocne. The fish were collected by
FISH PASSAGE THROUGH ROAD CULVERTS
By
ANGELA GARDNER
A thesis submitted to the Graduate Faculty of North Carolina State University
in partial fulfillment of the requirements for the Degree of
Master of Science
BIOLOGICAL AND AGRICULTURAL ENGINEERING
Raleigh 2006
To my family: for keeping me grounded while letting me dream big, And for being my biggest fans.
To my best friends: for keeping me sane in times of stress, For making me laugh when times were tough,
Biography
Angela Nichole Gardner was born in North Springfield, Virginia to Sandra and James Gardner in May 1982. She is the middle of three girls, with Kellie being the eldest, and Jenny being the youngest. After a brief stay in Jacksonville, Florida, the Gardner family returned to Springfield where they would stay for the remainder of Angela’s childhood.
The fall of 2000 would bring Angela to Blacksburg, Virginia for her first year at Virginia Tech. Years of playing outside and enjoying the outdoors would inspire Angela to pursue a major in Biological Systems Engineering studying soil and water
Acknowledgements
The author would like to thank her committee members Dr Greg Jennings, Dr William Hunt, and Dr James Gilliam. Their help and encouragement in building a project from scratch was very valuable. The author would also like to thank Bryn Tracy and his team from the Division of Water Quality for teaching her how to electrofish as well as identify fish species. The author would like to acknowledge Dr David Dickey and Dr. Jim Osborne for their help in the statistics portion of this experiment.
The author would also like to thank Mike Shaffer, Will Clayton, and James Puckett for helping in the construction of the flume. She would also like to thank David Godly for his help in electrofishing. David made it seem a lot less like work, and always made it an enjoyable time. The author would also like to thank Paige Puckett for all her help and assistance throughout the entire project.
Table of Contents
1.0 Introduction...1
1.1 Ecological Connectivity...1
1.2 Culverts ...3
1.2.1 Definition of a culvert...3
1.2.2 Retrofitting culverts ...4
1.2.3 Culverts vs. Bridges ...5
1.3 Regulations to facilitate AOP at road crossings ...8
1.3.1 Standards and Regulations...8
1.3.2 North Carolina State BMP manual ...9
1.3.3 Acquiring Permits ...11
1.3.4 Developing Regional Criteria ...13
1.4 Research in the Pacific Northwest ...16
1.4.1 Rebuilding and protecting the Salmonid population ...16
1.4.2 No-Slope design option...17
1.4.3 Hydraulic design option...18
1.4.4 Stream Simulation design option ...20
1.5 Passive and Active methods for finding the physical limitations of fish...21
1.5.1 Passive and active methods...21
1.5.2 Mark recapture studies...23
1.5.3 Research on active methods...24
1.6 Selecting fish species ...27
1.6.1 Choosing fish species...27
1.6.2 Selected Species...29
2.0 Materials and Methods...34
2.1 Collection of fish...34
2.2 Project site...35
2.3 Flume design...36
2.3.1 Flowmeters and other equipment...39
3.0 Results...42
3.1 Hypotheses...42
3.2 Data Summary ...42
3.2.1 Bluehead chub...43
3.2.2 Redbreast sunfish ...44
3.2.3 Johnny darter...45
3.2.4 Bluegill...46
3.2.5 Swallowtail shiner...48
3.2.6 Margined madtom...49
3.2.7 Box-Plot comparison ...51
3.3 Testing hypothesis ...52
3.3.1 Primary hypothesis...52
3.3.2 Secondary hypothesis...53
3.3.3 Finalized GLM...56
4.0 Discussion ...59
4.1 Performance of flume ...59
4.2 Additional comments on fish behavior ...60
4.3 Comparison of findings to other experiments...61
5.0 Excel Model for Culvert Design ...63
5.1 Flow regimes...63
5.2 Modeling flow Type 1 ...64
5.3 Process of the Excel model ...66
5.4 Sensitivity Analysis ...67
5.4.1 Circular Culverts...68
5.4.2 Sunken Circular Culverts...69
5.4.3 Box Culverts ...70
5.4.4 Conclusions based on sensitivity analysis ...71
5.5 Suggested Uses for the model...72
6.0 Conclusions and Recommendations ...74
6.1 Utilizing the data...74
6.2 Design Recommendations ...74
References...76
Appendix A: Additional site photos ...79
Appendix C: Additional Information on Culvert Design Excel Model...89
C.1: Equations for a circular culvert ...90
C.2: Equations for a Sunken Circular Culvert ...91
C.3: Equations for a box culvert ...92
C.4: Graphs for sensitivity analysis of circular culverts ...93
C.5: Graphs for sensitivity analysis of sunken circular culverts...95
C.6: Graphs for sensitivity analysis of box culverts ...97
List of Tables
Table 1.1: Stream crossing structural options for fish passage ...7 Table 1.2: Fish passage design criteria from WDFW design manual, 2003 ...19 Table 1.3: List of possible species for the experiment provided by the
NC DWQ ...28 Table 3.1: Summary of mean critical velocities for each species in cm/s.
Statistical data for Margined Madtom is not based on a normalized data set and should not be used as basis for design. Means for Johnny Darter and Bluehead Chub do not reflect true means, because the maximum flows tested for each species were 70 cm/s (2.3 ft/s) and
100cm/s (3.3 ft/s) respectively. ...43 Table 3.2: Results of the GLM for the relationship given in Equation 3.1...53 Table 3.3: Significance of slope and intercept for each species, based on a
P=0.05 significance level ...54 Table 3.4: Contrasts performed on relationship between Body Length and
Critical Velocity for each species, based on an P=0.05 significance
Level ...55 Table 3.5: Estimate of intercept for each species associated with finalized
GLM model...57 Table 3.6: ANOVA table for the finalized GLM. ...58 Table 5.1: Variables that are required to be input by the designer in the Culvert
design model. The variables are defined in equations 5.1-5.5. ...66 Table 5.2: Values input into the model for the sensitivity test of a circular culvert ...68 Table 5.3: Values input into the model for the sensitivity test of a
List of Figures
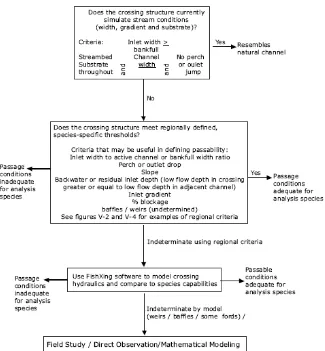
Figure 1.1: Algorithm for identifying road crossings that impede AOP ...14
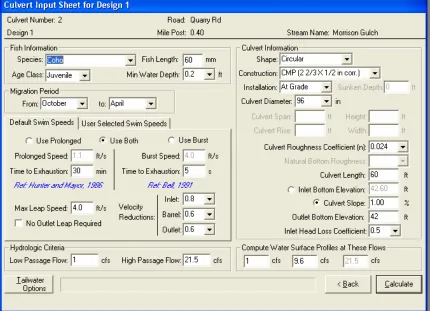
Figure 1.2: Culvert information input sheet in FishXing...16
Figure 1.3: Bluehead Chub ...29
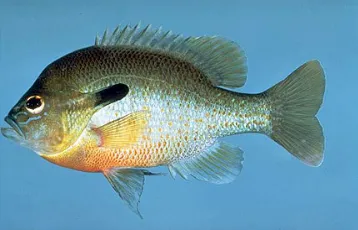
Figure 1.4: Redbreast Sunfish...30
Figure 1.5: Johnny Darter ...31
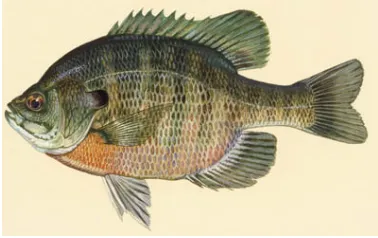
Figure 1.6: Bluegill ...31
Figure 1.7: Margined Madtom...32
Figure 1.8 Swallowtail shiner ...33
Figure 2.1: Lake Wheeler Road Field Laboratory showing primary pond...35
Figure 2.2: Worksite showing secondary pond and flume ...36
Figure 2.3: Side view of flume ...37
Figure 2.4: Front/Top view of flume ...38
Figure 2.5: The pipe leading to the woods carries the drained water, while the channel carries the water exiting through the section cut from the wooden gate ...38
Figure 2.6: Experimental design of velocity changing with time from beginning to end of test...40
Figure 2.7: Measuring the total length of a Bluegill from the tip of the snout to the end of the caudal fin...41
Figure 3.2: Critical velocity related to body length for the Redbreast Sunfish ...45
Figure 3.3: Critical velocity related to body length for the Johnny Darter, where 70cm/s represents the maximum velocity used for testing in the experiment...47
Figure 3.4: Critical velocity related to body length for the Bluegill...48
Figure 3.5: Critical velocity related to body length for the Swallowtail Shiner ...49
Figure 3.6: Critical velocity related to body length for the Margined Madtom ...50
Figure 3.7: Box plot showing differences in critical velocities for each species. The velocity is in cm/s. Note that maximum velocities used for testing Johnny Darter and Bluhead Chub were not the same. Maximum flows tested for each species were 70 cm/s (2.3 ft/s) and 100cm/s (3.3 ft/s) respectively. ...55
Figure 3.8: Graph of the relationship between body length and critical velocity for each species using equations 3.7 – 3.11, developed from the finalized GLM...57
Figure 4.1: Bluegill and Redbreast Sunfish swimming in arc pattern during October 14th test 61 Figure 5.1: Diagrams of the six flow types. Source: USGS can be found in original context at http://wwwrcamnl.wr.usgs.gov/sws/fieldmethods/Indirects/rantz.htm ...64
Figure A.1: Electrofishing in Brier Creek with crew from the NCDWQ ...81
Figure A.2: Angela Gardner and Dan Clinton running test on October 14, 2005 ...81
Figure A.4: Looking towards inlet of the flume ...82
Figure A.5: As build AutoCAD drawings of flume design ...83
Figure C.1: Diagram of circular culvert showing theta as the angle between the water surface and the center of the culvert ...90
Figure C.2: Diagram of a box culvert showing width and height of water ...92
Figure C.3: Velocity response to the change in the input variable Length for a circular culvert...93
Figure C.4: Velocity response to the change in the input variable Culvert Diameter for a circular culvert...93
Figure C.5: Velocity response to the change in the input variable h1, head at section 1, for a circular culvert ...94
Figure C.6: Velocity response to the change in the input variable V1, velocity at section 1, for a circular culvert...94
Figure C.7: Velocity response to the change in the input variable Length for a sunken circular culvert ...95
Figure C.8: Velocity response to the change in the input variable Diameter for a sunken circular culvert ...95
Figure C.9: Velocity response to h1 in a sunken circular culvert...96
Figure C.10: Velocity response to V1 in a sunken circular culvert ...96
Figure C11: Velocity response to sunken depth in a sunken circular culvert...97
FigureC.12: Velocity response to width of a box culvert ...97
Figure C.13: Velocity response to h1 in a box culvert ...98
Figure C.15: Velocity response to culvert length in a box culvert ...99
Figure C.16: Model interface for circular culvert...100
Figure C.17: Model interface for Sunken Circular Culvert ...101
Figure C.18: Model Interface for Box Culvert ...102
1.0 Introduction
1.1 Ecological Connectivity
In periods of rapid development the need for a new infrastructure often
overshadows concerns of potential environmental impacts. Streams have been
straightened and channeled through pipes, and culverts have been sized without
considering impacts on fish migration. As a result there has been a deterioration of
freshwater habitat, and the endangerment of many fish species (Bond et al. 2003). In
recent years a movement towards restoring freshwater ecosystems previously devastated
by human impacts has begun.
In the restoration process of freshwater systems it is important to consider the
effects of ecological connectivity. Ecological connectivity refers to the ability of a
landscape to support the movement of energy, organisms, and materials (Bates et al.
2003). This can include the migration of fish, movement of sediment and debris, and the
capacity of a stream to handle changes in hydrology. With regards to fish passage and
road culverts, it is the linkage between the upstream and downstream reaches.
The process of restoration can be maximized by focusing on these linkages,
specifically the effects on fish dispersal and colonization (Bond et al. 2003). The ability
of fish and other aquatic organisms to disperse is essential for their survival. Dispersal
gains them access to spawning habitats, prey, escape from predators, and the
“maintenance of populations in areas unsuitable for reproduction,” (Warren et al. 1998).
Each fish species requires specific habitat conditions for spawning. These habitats
access to the entire downstream watershed for rearing. During the rearing process
juvenile fish can use nearly every segment of a stream environment (Bates et al. 2003).
When a culvert is installed, not only is habitat lost in that specific area, but
oftentimes fish can not navigate through the culvert, effectively cutting off access to the
upper stream reaches. This fragmentation in the landscape ecology can isolate fish
populations, which increases susceptibility to genetic change and the risk of extinction
due to chance events (Venner Consulting and Parsons Brinkerhoff 2004). When a barrier
is present, individual exchange is blocked among populations, thus eliminating genetic
diversity and the ability of one population to support a waning population nearby. This
can both delay and prohibit the recovery of fish assemblages following disturbance from
culvert installation (Warren et al. 1998)
Wildlife issues are gaining more importance on state Department of
Transportation (DOT) agendas. Possible improvements for culverts, culvert retrofits, and
roadway crossings are being examined to reduce impacts on wildlife passage. A survey
conducted in 2002 shows that 17 of 50 state DOTs are beginning to consider wildlife
crossings in the roadway design process. However, few of the 17 have wildlife crossing
policies. The same survey shows that 9 of 50 state DOTs have made modifications to
existing culverts in order to improve ecological connectivity across roads; however, only
4 states have monitored the crossings to ensure the desired results were reached (Venner
1.2 Culverts
1.2.1 Definition of a culvert
The purpose of a culvert is to carry water under a road embankment. Culverts
vary in shape and size and can be as long as 100m (328ft). Circular culverts are the most
common; however, they can also be elliptical, rectangular or shaped as an arch, and are
made with a variety of materials (Ead et al. 2002).
A culvert is a rigid body that is set into an ever changing stream environment.
Changes in land use due to urbanization can create an unstable watershed. As runoff
volume increases, the streams actively degrade in order to accommodate higher flows.
Culverts are unable to adapt to the degrading streams and instead become barriers to fish
movement. The most common reasons culverts become barriers are excessive outlet
drops, high water velocity within the culvert, turbulence within the culvert, accumulation
of sediment and debris, and an inadequate water depth within the culvert (Bates et al.
2003). In addition to these barriers, the absences of refuge pools at either end of the
culvert prevent fish from acquiring the rest necessary to traverse the obstacle. Scour pools
located at the culvert outlet as well as midchannel bars upstream of the culvert can also
be a sign of velocity barriers within the culvert (Bates et al. 2003). Some culverts are only
seasonal barriers, acting as barriers during periods of low flow. All of the aforementioned
barriers hinder the movement of adult fish but are often more detrimental to both
1.2.2 Retrofitting Culverts
When considering fish passage conventional hydraulic designs procedures have to
be altered. One option is designing or retrofitting culvert fishways. A culvert fishway is
defined as any culvert with special features to make it passable by fish (Rajaratnam et al.
1991). These features attempt to break up the culvert into a series of cells and bays,
creating resting places along the culverts length and barrier velocity at the baffles or slots
created by the baffles (Ead et al. 2002). It is assumed that fish will use their burst speed
to get past the velocity barriers, and then use their prolonged speed to travel in the pools
along the areas of lower velocity (Rajaratnam et al. 1991).
There are several types of fishways commonly used including an offset baffle
system (OB), spoiler system (SPB), side baffles, slotted-weir baffle (SWB), weir baffle
system, circular culvert fishways (CFW), Alberta fish weir (AFW), and the Alberta fish
baffle (AFB). These fishways can be installed in streams with gradients up to 12 %
(Robison et al. 1999). In an OB there is a baffle pointed diagonally upstream on one side
of the culvert and a shorter baffle perpendicular to the culvert on the other side making a
small slot between the baffles. The SB design has multiple baffles running along the
length of the culvert in the direction of the water flow. The baffles are generally spaced at
four times the height and are a length of 2.375 times the height. A SWB has a weir
spanning the length of the baffle with a small slit in the middle of the weir. This type of
baffle can also be made without a slit, causing water to build up behind the baffle and
then pass over, creating a large pool (Robison et. al 1999).
Weirs and baffles can be welded to the culvert or attached by bolts. They can be
1999). Flow equations for many of these baffle systems can be found in Hydraulics of
culvert fishways IV: spoiler baffle culvert fishways by N. Rajaratnam et al. (1991), and
also in Generalized Study of Hydraulics of Culvert Fishways by S.A. Ead et al. (2002).
Flow calculations are based on the height, width and flowrate going through the baffle
system.
The advantages of a baffle system are that they require less oversizing than
buried culverts and are less expensive than bridges and large open bottomed culverts.
Also, baffle systems can be installed in areas where the stream grade is at or near the
bedrock. They are generally used on streams with slopes up to 12%, which would
generally require a bridge. Although fishways and baffles have been designed to improve
fish passage through culverts, there are many problems which have made baffles fall to
one of the last options in the design process for fish passage at road crossings. Baffles
have a much larger failure rate than oversized culverts and bridges. They are prone to
clogging with debris and sediment and can rip out and cause damage to the culvert itself.
Also, they can disrupt the boundary layer, which is a layer in the water profile directly
above the stream bed with the lowest velocities. Baffles can also impede the ability of
juvenile fish to traverse the culvert. It is also difficult to install prefabricated baffles into
culverts, because settling can cause the baffles to pop out, and the damage can then cause
culvert failure (Robison et al. 1999).
1.2.3 Culverts verses Bridges:
A bridge is defined as a structure spanning the entire width of a stream, which sits
passage, bridges are selected as the best design alternative. They change stream habitat
and flow regime the least, and bridges are preferred most in regards to natural resource
protection. Bridges do not tend to create the same flow problems that culverts do (Fitch
1996). Despite being ecologically friendly, bridges cost as much as three times more to
build, and ten times more to maintain than culverts (Fitch 1996). The amount of money
budgeted for fish passage problems is limited. Constructing bridges in place of every
culvert not meeting fish passage guidelines would greatly limit the amount of work that
could be done to combat this problem (Robison et al. 1999). In Oregon and
Massachusetts alone there are over 10,000 and 28,500 road crossings, respectively, that
affect fish bearing streams (Venner Consulting and Parsons Brinkerhoff 2004). For this
reason it is important to come up with a culvert design that is hydrologically feasible.
In choosing between a bridge and a culvert for a specific site it is important to
consider the geometry of the stream and other topographical features. Channel slope can
play a major role in choosing a culvert or a bridge. Culverts are best used when they can
be installed at the slope of the streambed or at less than a 3% slope (Fitch 1996). When
the stream gradient ranges from 5-8% ,the cost of the culvert becomes comparable to the
cost of a bridge for that stream (Robison 1999). In general bridges become economical
as the stream size increases (Robison 1999). In The Design of Road Culverts for Fish
Passage, Bates (2003) suggests that when a stream width exceeds 6.1m (20ft) or there is
frequent movement of large debris, a bridge is the best design alternative. Another source
suggests that culverts should only be used on small streams with a channel width of less
than 3.05m (10ft), because when the design includes multi-plate structures the cost
Most research articles and state design manuals list their order of preference for
stream crossing options in the same order. Oregon, Washington, Maryland, and Virginia
all state that the use of baffles on newly installed culverts should be discouraged, and
cement aprons should not be used on culverts (Bates 2003, Fitch 1996, Robison 1999).
The Oregon restoration guide has the following design table with advantages and
disadvantages for each crossing type, listed in descending order of preference (Table 1.1).
Table 1.1: Stream crossing structural options for fish passage
Type Advantage Disadvantage
Bridge Best alternative (for minimum ecological impact)
Most Costly alternative
Open Bottom Culvert
Good Alternative if properly sized
Expensive and difficult to install
Sunken and Embedded Culverts
Same slope as stream and same stream characteristics
Difficult to install compared to non-buried culvert
Flat Culverts Least cost alternative Difficult to get this passage flat and limited to <0.5% slope
Outlet Backwater Culvert
Low cost alterative (≤4% slope)
Installation of effective, stable weirs for passage can be tricky
Weir/baffle Culverts
Less expensive compared to bridges and open bottom culverts
Have a legacy of failure due to debris and sediment clogging and securing baffles
Fords Low cost
(limited use)
1.3 Regulations to facilitate AOP at road crossings
1.3.1 Standards and Regulations
There are both Federal and State regulations regarding the building of culverts
and their effects on water bodies. In the US Army Corps of Engineers (USACE)
document entitled Final Regional Conditions for Nationwide Permits effective May 12th
2002 under Section II, number 5, the construction of culverts is discussed. It requires that
measures be taken in the installation process to ensure the safe passage of aquatic
organisms. For the 20 North Carolina counties under the Coastal Area Management Act
(CAMA), culverts must be buried at least 0.3m (1ft) below the stream bed. This is also
true for all culverts greater than 1.2m (4ft) in diameter. For culverts with a diameter less
than 1.2m (4ft) the invert must be buried to a depth of at least 20 percent of the culvert
diameter.
Nationwide Permit (NWP) # 14 (Road Crossings) discusses aquatic life
movements in part five of the General Conditions section. It states that
No activity may substantially disrupt the necessary life-cycle
movements of those species of aquatic life indigenous to the waterbody, including those species that normally migrate through the area, unless the activity's primary purpose is to impound water. Culverts placed in streams must be installed to maintain low flow conditions. p3
Similarly in the North Carolina Division of Water Quality (NC DWQ) General
Certification Conditions (GC3375), Section 9 discusses the placement of culverts in
would be impractical. It also requires the design of road crossings to maintain equilibrium
in the stream, causing neither aggration or degration.
Part 11.a under the General Conditions of NWP #14 discusses endangered
species. It states that no NWP will be authorized to an activity that could possibly
threaten an animal identified under the Federal Endangered Species Act (ESA). This
includes altering their habitat in such a way that would disrupt their life-cycle. A detailed
report must be given listing species and habitats that may be affected and the degree to
which they will be affected. In North Carolina a species of specific concern is the
endangered Cape Fear Shiner (Notropis mekistocholas). There are also many endangered
mussels in the state of North Carolina which travel up and downstream by attaching
themselves to fish.
North Carolina’s administrative codes for surface waters and wetlands are listed
in the “REDBOOK”, effective August 1st, 2004. Section 15A NCAC 02B .0231, b.5.dof
the code addresses the movement of aquatic fauna in wetland habitats. Endangered
species are addressed on the state level in section 15A NCAC 02B .0110. Regulations can
be found in their original context in Appendix B.
1.3.2 North Carolina State BMP Manual
The North Carolina Department of Transportation (NCDOT) published a manual entitled
BMP’s for Construction and Maintenance Activities in August of 2003. Section 4.2 in
this manual outlines the expectations in the procedures of installing pipes and culverts
from the site erosion control to the site cleanup. The following guidelines are listed in this
section of the manual regarding AOP through pipes and culverts. The following passages
4.2.7. Install the pipe/culvert per the NCDOT standards and specifications, and
any specified permit conditions. Note that the pipes and culverts shall be buried a
minimum depth below the existing streambed, as defined below, in order to allow
for aquatic organism passage during low flow conditions. Variance may be
obtained by the DEO to allow for deviations in pipe burial depths due to bedrock,
steep gradients in the stream channel, existing head cutting, potential for
drainage of upstream wetlands, or other concerns. p 28
4.2.8 Stream pattern dimension and profile shall be maintained by pipe/culvert
installation
• A 4-foot (1.22m) diameter pipe/culvert installed in a 2-foot (0.61m)
wide stream may require baffles in order to maintain aquatic organism
passage during low flow conditions.
• Pipe size should at least match stream width wherever possible, but a
2-foot (0.61m) wide culvert installed on a 4-foot (1.22m) wide stream
may also need baffles to reduce velocities.
• Two 48 inch (1.22m) pipes installed in a 10-foot (3.05m) wide stream
would require that one pipe be installed at a lower elevation, and in
alignment with the low flow stream channel elevation so that AOP is
maintained during low flow conditions.
• The low flow pipe should be aligned with the deepest part of the
stream channel, so that flow is maintained during low flow conditions.
The protocol for NCDOT projects as listed in the manual requires that a species
survey must be conducted for each site along with a habitat evaluation. The impacts of
the project on habitat must be determined and the future effects on habitat must be as
well.
1.3.3 Acquiring Permits
Appendix E of the NCDOT manual is entitled Environmental Permits and
Certifications. This section focuses on the 404 Nationwide permit, covering topics
including maintenance, bank stabilization, temporary construction access, dewatering,
and road crossings. The 404 Nationwide permit number 14 covers road crossings. The
BMP Manual states that,
“This permit authorizes activities for the construction, expansion, modification,
or improvement of linear transportation crossings (e.g. highways, railways, trails,
etc.) in jurisdictional waters and is subject to specific acreage and linear limits.
Authorization for public linear transportation projects in non-tidal waters,
excluding non-tidal wetlands adjacent to tidal waters, is provided if the discharge
does not cause the loss of greater than ½ acre (0.2 hectare) of jurisdictional
waters. Authorization for public linear transportation projects in tidal waters or
non-tidal wetlands adjacent to tidal waters is provided if the discharge does not
cause the loss of greater than 1/3 acre (0.13 hectare) of jurisdictional waters and
Specific permits for culvert installation can be found at the USACE website:
http://www.saw.usace.army.mil/wetlands/Permits.html
The trout waters of western NC and coastal waters of eastern NC require
additional and stricter permits. In recent years there has been an increasing difficulty in
acquiring the necessary permits to build culverts at road crossings. The permits require
that AOP guidelines be met, but there are not any quantitative guidelines to follow to
prove that this has been done. As a result bridges have to be built in their place. The
guidelines are not species specific and are often adapted from other states guidelines.
Virginia’s research and guidelines are based on trout species. Their research concluded
that the flow velocity should not exceed 1.2 m/s (3.94 ft/s) under normal flow conditions.
Also, the minimum depth of flow should be 9 cm (3.54 in), and the maximum outfall
height should be 10cm (3.94 in) (Fitch 1996). Yet even Virginia’s guidelines are not
complete. They lack guidelines for installing bridges or culverts on high gradient streams
(Fitch 1996)
The dominant group of fish that has been studied is the salmonids. With most of
the research being done in the pacific northwestern part of the United States, the current
research and reflects species specific to that region. Also, the majority of research done
on the limitations of fish passage has been on anadromous fish. With the majority of
North Carolina’s waterways providing habitat for nonanadromous fish, it is important to
1.3.4 Developing Regional Criteria
A National Inventory and Assessment Procedure was developed in 2003 by the
USFS San Dimas Technology and Development Center. The procedure explained in this
manual is intended to be nationally applicable. It develops a consistent method for
identifying road crossings that impede AOP in streams which is outlined in Figure 1.1.
When a stream does not resemble a natural channel, it is important to refer to
regional screens that define a species’ ability to leap into and traverse road crossing
structures. These regional screens create a quick and consistent process of determining
the degree of impediment for each crossing structure.
To develop a regional screen, a list of species must be selected. “The ideal
crossing is one that passes all aquatic organisms and terrestrial species that require stream
or streamside zones to move (Clarkin et al. 2003).” In that case, it is important to select
species representative of all those in the area. In creating this list it is also important to
consult both state and federal regulatory agencies and other interested parties that may
have an input on species of concern. After reviewing any available literature on the
species listed, species, groups, or life stages which have the greatest limitations in
mobility should be selected for the regional screen.
A range of limiting velocities and outfall heights should be developed for each
species. These ranges serve as guidelines, and the ranges should be field tested to see
Figure 1.1: Algorithm for identifying road crossings that impede AOP. (Clarkin et
al. 2003)
When it cannot be determined whether the road crossing is a barrier or not, the
assessment procedure recommends the use of a public domain hydraulic model called
FishXing. The model was developed to help engineers and biologists evaluate culvert
design based on fish passage. Version 2.2 is available for download at
collection to support the program, case studies, and other resources are available at this
website. Some of the features of this program as listed on their website are the model:
• Allows for comparison of multiple culverts designs within a single project.
• Calculates hydraulic conditions within circular, box, pipe-arch, open-bottom arch, and embedded culverts.
• Contains default swimming abilities for numerous North American fish species.
• Contains three different options for defining tailwater elevations.
• Calculates water surface profiles through the culvert using gradually varied flow equations, including hydraulic jumps.
• Outputs tables and graphs summarizing the water velocities, water depths, outlet conditions, and lists the limiting fish passage conditions for each culvert.
Figure 1.2 shows an input screen for a culvert being evaluated by the program. It is
separated into fish information, culvert information, migration period of concern, and
hydraulic criteria. The program will supply the default swimming speed for the species
chosen and calculate the water surface profiles based on the flows. A regional screen
created for the Piedmont of North Carolina would not only help the assessment procedure
of current culverts, but the swimming abilities of local fish could be added to the
Figure 1.2: Culvert information input sheet in FishXing
1.4 Research in the Pacific Northwest
1.4.1 Rebuilding and protecting the Salmonid population
Washington and Oregon are among the leaders in pursuing proper design of road
culverts out of concern for migratory fishes. The salmonid populations are important to
the area for both recreational and economic reasons, as well as being part of local history.
Both states are among the few in the country to have published manuals or guidebooks on
the design of road culverts for fish passage. Washington State’s manual was developed as
a part of their Aquatic Habitat Guidelines (AHG) Program. This program began in 1999
freshwater, and riparian habitat through comprehensive and effective management of
activities affecting Washington's aquatic and riparian ecosystems (WDFW 2006).”
Agencies contributing to the development of the program and manual include the Army
Corps of Engineers, the Washington Department of Natural Resources (DNR),
Interagency Committee for Outdoor Recreation (IAC), United States Fish and Wildlife
Service (USFWS)
Washington State’s guidebook entitled Design of Road Culverts for Fish Passage
published in 2003 outlines three options for the design of road culverts: The no-slope
design option, hydraulic design option, and stream simulation design option.
1.4.2 No-Slope Design Option
The no-slope design option is the first choice for a culvert when it is applicable
for a site. A no-slope culvert can be installed as a new or a replacement culvert, but
cannot be a retrofit. They can be installed when the stream gradient is less than three
percent, and passage is needed for all species. This design is the simplest, requiring the
least amount of site surveys and engineering calculations. The manual defines a no-slope
culvert as follows:
• “Width equal to or greater than the average channel bed width at the elevation
the culvert meets the streambed.
• A flat gradient
• The downstream invert is countersunk below the channel bed by a minimum of
• The upstream invert is countersunk below the channel bed by a maximum of 40%
of the culvert diameter or rise
• The possibility of upstream headcut has been taken into account, and
• There is adequate flood capacity.” (Bates 2003)
With the width equal to or greater than the channel bed, the deposit of bed
material and sediment within the culvert is not hindered. After some time a thalweg may
form within the culvert. The manual states that the diameter of the culvert must be at least
1.25 times the channel bed width. Although this option may ensure a greater number of
species could pass through it is often the most expensive, with culverts being much larger
than those designed with the hydraulic design option.
1.4.3. Hydraulic Design Option
The hydraulic design option is based on the properties of open channel flow
hydrology. The design is constrained by the swimming abilities of local fish species, and
velocities within the culvert are limited to those that can be traversed by the target species
chosen. This design option can be used for retrofits, replacements, and new culverts in a
stream with a low to moderate gradient.
The first step in a hydraulic design is determining the fish passage requirements.
The species and life stages of concern must be identified for the area of culvert
installation. The design should be based on the weakest fish of concern. Table 1.2 is
taken from the design manual and shows an example of species design criteria based on
the length of the culverts. The velocity limitations for each fish are compared to the
because it does not take into account areas of lower velocity along sides and bottom of
the culvert where weaker fish could swim. The hydraulic design must meet velocity
requirements at least 90% of the time during fish migration season where anadromous
fish are the species of concern.
Table 1.2: Fish passage design criteria from WDFW design manual, 2003.
Adult Trout >6in (150mm)
Adult Pink or Chum Salmon Adult Chinook, Coho, Sockeye, or Steelhead Culvert Length Maximum Velocity (fps)
10 - 60 ft 4.0 5.0 6.0
60 - 100 ft 4.0 4.0 5.0
100 - 200 ft 3.0 3.0 4.0
Greater than 200 ft 2.0 2.0 3.0 Minimum Water Depth (ft)
0.8 0.8 1.0
Maximum Hydraulic Drop in Fishway (ft)
0.8 0.8 1.0
The next step is determining the length of the culvert. This is dependent on the
velocity requirements for fish. The length of the culvert is related inversely to the
velocity that a fish can swim against.
The manual lists four options for hydraulic analysis in this order of preference:
stream gauging, continuous-flow simulation model, local regression model, and regional
regression model. Design hydrology can be separated into two sections: high
fish-passage design flow and low fish-fish-passage design flow. The high fish-fish-passage design flow
is the flow exceeded ten percent of the time for each species. The low fish-passage design
flow is used to calculate the minimum water depth within the culvert. This design flow is
The size, material, and slope of the culvert must then be selected in order to meet
the velocity and depth requirements already calculated. The use of Manning’s equation
(Schwab et. al 1993) is the most commonly used method to calculate the flow rate
through the culvert based on the material, slope, and geometry.
Q = 1.49AS1/2R2/3/n = VA (1.1)
Where Q = Discharge, ft3/s S = Slope, ft/ft
R = Hydraulic Radius, ft A = Cross Sectional Area
n = Roughness Coefficient (Mannings n)
In culvert design, channels can be artificially roughened in order to decrease the
velocity changes within the culvert. A study done by Michael Fitch for Virginia in 1996
suggested casting the bottom of culverts to mimic the roughness of stream bottom. Based
on Manning’s equation there should theoretically be no change in velocity within the
culvert if this is done. Washington’s manual suggests a mix of rock and sediment to be
built into the culvert to achieve channel roughness. This roughness creates various flow
patterns which provide both migration paths and rest areas for fish. Very little research
has been done on the effectiveness of these artificially roughened channels.
1.4.4 Stream-Simulation Design Option
Chapter six of the manual discusses the stream-simulation design option. In a
stream simulation design, the goal is for the bed of the culvert to be formed in such a way
that the stream’s natural processes are created or maintained. The idea is that “if fish can
that simulates a stream channel (Bates 2003).” When applying this theory, there is no
longer need to consider specific target species and their velocity and depth limitations.
This design option can be used for both new and replacement culverts on moderate to
high graded streams. The slope ratio must be less than 1.25, and if it is greater the
hydraulic design option should be used. The stream simulation option is best applied
where ecological connectivity is a critical issue, and passage is needed for all fish species.
Any material can be used for this type of culvert; however, bottomless culverts
tend to be the best because the native bed material can remain in place. The size of the
culvert should be greater than or equal to the bed width of the stream. The manual gives
the following equation for the minimum width of the bed in a given channel:
Wculvert bed = 1.2* Wchannel +2 (in feet) (1.2)
The culvert will be filled with material and sediment similar to that which is in other parts
of the channel. When designing a culvert bed for a stream in equilibrium, the streambed
itself can be used as a reference for design. If the channel is aggrading or degrading then
a reference reach should be used for the design. The two suggested methods to use in bed
design are the Unit-Discharge method, and the Paleohydraulic Analysis method. Both of
these methods will aid in the development of the sediment mix by calculating average
particle sizes.
1.5 Passive and active methods of finding physical limitations of fish
1.5.1 Passive and Active Methods
There are two methods for determining the physical limitations of fish. The
passive method for studying fish passage and movement makes use of mark and
These fish are then tagged or marked in some way as to identify them later. After a set
time, fish are then recollected upstream of the culvert. The flow conditions during the set
time period are recorded along with the number, size, and species of fish that were able to
pass through the culvert. This test gives some idea as to what flow conditions fish are
able to pass through.
Active methods for testing fish limitations require a laboratory set up, where fish
are inserted into a current, and their behavior is recorded as the current increases. Active
studies offer more precision for the physical measurement of individuals and ensure that
every individual is accounted for. Active studies are more intensive and time consuming.
There are three types of speed that have been defined by biologists to describe the
swimming behavior of fish: prolonged speed, sustained speed, and burst speed. Studies
often focus on one or more of these speeds. Prolonged swimming speed encompasses
those velocities which can be maintained for periods of 20 seconds to 200 minutes, but
eventually cause fatigue in the fish. Sustained swimming speed is defined as a speed
maintainable for longer than 200 minutes without inducing muscular damage (Winger et
al. 2000). Aerobic metabolism is used by the body during sustained speed in order to fuel
red muscle fibers (Peake et al. 2000). Burst speed is used for periods less than 15-20
seconds, and is fueled by an anaerobic process utilizing the white muscle fibers in fish
(Peake 2000). Burst speeds are often used to traverse short distances very quickly.
Defining the critical velocity of a fish is often the goal of both passive and active
studies. The critical velocity is “the maximum sustained speed a fish can maintain for 10
culverts up to 328 ft (100m) (Clancy and Reichmuth 1990).” A 100m culvert is used as
the average length of a long culvert.
1.5.2 Mark Recapture Studies
In an experiment performed in Arkansas by Melvin Warren Jr. and Mitzi Pardew
in 1998, nine culverts were studied to analyze their impact as barriers to small-stream fish
movement. Four specific culvert designs were selected: fords, open box bridges,
cylindrical culverts, and a solid concrete slab. The goals of the study were to determine if
velocity and water depth in the culvert affected fish movement, if fish movement varied
among the four culvert types, and if the type of culvert had any relation to species
diversity. The average water velocity in the culvert, the water depth, and the length of
the structure was recorded for each culvert. Fish were captured, marked, and then
released downstream of the culverts. An average of 302 fish were marked per site in the
spring, and 424 in the summer. Of the fish marked, 26 species and 8 families were
represented. On average, 18% of the fish were recaptured in the spring and 21% in the
summer.
The results of the study showed the highest rate of fish crossing through the
natural reaches as well as the fords. There was little difference in migration between the
fords and open box structures. No fish were able to navigate the concrete slab, and the
cylindrical culverts proved to be a significant barrier to fish movement. Warren and
Pardew (1996) reported that “culvert and slab crossings reduced overall fish movement,
diversity of movement, and movement of fish families relative to natural reaches.” The
barrier. As a result of the study, a maximum velocity of 30-40cm/s (1-1.3 ft/s) is the
recommended design standard for a 100m culvert.
A study done by David A Belford and William R. Gould in 1989 examined the
passage of four trout species through six different round, corrugated-metal culverts in
Bozeman, Montana. In the study fish were caught by trapping and electrofishing and
forced to move upstream through culverts by barriers placed on the downstream end of a
culvert. Velocities and water depths were recorded for each culvert, along with diameters
and culvert slopes. Fish that traveled through the culvert were caught upstream and their
body length, weight, and sex were recorded. Non-linear regression relationships were
formed for each species in relation to combinations of bottom velocity and culvert length.
Results were very similar for all four trout species, and design suggestions can be given
based on the regression relationships for rainbow trout. This relationship shows that for
culvert lengths up to 10m (32.8 ft) fish could navigate bottom velocities up to 0.96 m/s
(3.15 ft/s). As the length of the culvert increases, the maximum velocity the fish can
navigate decreases. Based on the relationship, a maximum velocity for a 100m (328 ft)
culvert is 0.67m/s (2.2 ft/s).
1.5.3 Research on Active Methods
In an experiment performed by D. R. Jones, J.W. Kiceniuk, and O. S. Bamford in
1974, the critical speed of 17 species native to the Mackenzie River system was
evaluated. Five of these species including the burbot, broad whitefish, mountain
whitefish, Arctic char, and Arctic cisco were examined in the laboratory. After collection
and delivery to the laboratory, the fish were deprived of food for 24 hours before they
cm-diameter (0.29ft) tube which utilized a closed circuit respirometer. The fish were allowed
an initial settling period of 10 minutes before the current flowing through the tube was
increased in 10 minute increments. The velocity was increased until the fish became
exhausted, in which case the last ten minute period the fish completed was considered the
critical velocity. A fatigue test was also performed, where the fish were placed in the tube
and after a period of one hour at the resting velocity of 10cm/s (0.33 ft/s) the velocity was
increased to 60-90% of the critical velocity. The velocity was then kept constant and the
time to fatigue was recorded, with the maximum time of 100min.
The results showed a significant correlation between the body length of fish and
their critical velocity in six of the species. The values for critical velocity ranged from
42.5 – 100.2 cm/s (1.39-3.29 ft/s). The fatigue tests did not show a significant correlation
between swimming speed and the time to fatigue. For the longnose sucker, burbot, and
pike the highest maintainable speed was 60% of the critical velocity, and for the char and
grayling it was 80%.
Another experiment was performed by S. Peake, R. S. McKinley, and D. A.
Scruton in 2000 to measure the swimming performance of a wild population of walleye
(Stizostedion vitreum). The results were then used to predict water velocities that allow
fish passage through culverts. Fish were collected and held in an outdoor tank before use.
The fish were deprived of food for at least 48 hours before use in the experiment. A
Blazka respirometer was used for the study. Fish were placed in the device and allowed
to acclimate for a period of four hours at 0.10cm/s (0.003 ft/s). Velocity was then
increased by 0.10cm/s (0.003 ft/s) every hour until fatigue occurred. The walleye were
seconds. The results of the test were used to estimate the critical velocity. The following
equation was developed to illustrate the linear relationship between sustained swimming
ability and fork length and can be used to estimate maximum sustained velocities for
walleye’s 0.18-0.66 m (0.59-2.17 ft) long at temperatures from 5.8-20.5 ºC (42.44-68.9
ºF)
Ucrit60 (m/s) = 0.124 + 0.68 fork length (m) + 0.0052 Temperature (ºC) (1.3)
It was found that the critical velocities were only slightly higher than Ucrit60 found in the
above equation. An equation for prolonged performance was also developed from the
study. It shows that prolonged speed also increases linearly with fork length, and water
temperature. This equation can be used for walleye’s 0.18-0.67 m (0.59-2.2 ft) long at
temperatures from 6.0- 19.0 ºC (42.8-66.2 ºF)
Ucrit10 (m/s) = 0.263 + 0.72 fork length (m) + 0.0120 Temperature (ºC) (1.4)
The Active methods experiments had many procedures in common. The fish were
generally deprived of food for at least 24 hours. (Peake et al. 2000, Jones et al. 1974,
Winger et al. 2000) This ensured that they were in a post-absorptive state. The fish were
given a minimum time of five minutes to acclimate to the current (Peake et al. 2000,
Jones et al. 1974, Toepfer et al. 1999). Also, the flow was increased in steps, generally
around 0.10m/s (0.33 ft/s) (Peake et al. 2000). Mesh was often put at the entrance and
exit of the flume. The entrance mesh would regulate turbulent flow, and the exit mesh
1986). A variety of methods were used to encourage fish to swim if they fell back on the
mesh. Some were prodded with a glass rod (Whoriskey and Wootton1986), while other
used electrodes placed at the end of the flume (Winger et al. 2000).
1.6 Selecting fish species for the experiment
1.6.1 Choosing fish species
The first step in choosing the species for developing a regional screen is to select
the geographic region of concern. In this project the piedmont of North Carolina was
selected. Fish abundance charts found in Edward Menhinick’s The Freshwater Fishes of
North Carolina were used to select a basic list of species to choose from. Species that
were the most abundant were placed on the list. The North Carolina Division of Water
Quality (NC DWQ) then provided a list of possible species (Table 1.3), highlighting
those of specific concern to them. The NC Wildlife Resource Commission (NC WRC)
suggested studying a shiner similar to the Cape Fear shiner, the Redbreast sunfish, and
the Carolina darter. The goal was to find species of a variety of morphologies to discover
the differences in their performance. A final list of species was chosen based on the input
received by the regulatory commissions, the species abundance charts for the North
Carolina Piedmont, and the ease the NC DWQ had in collecting certain species in
Table 1.3: List of possible species for the experiment provided by the NC DWQ
Species
1 Redfin pickerel 2 Roseyside dace 3 Highback chub 4 Bluehead chub 5 Creek chub 6 Creek chubsucker 7 Satinfin shiner 8 Spottail shiner 9 Redlip shiner 10 Greenhead shiner 11 Whitemouth shiner 12 Swallowtail Shiner 13 White shiner 14 Crescent shiner 15 Highfin shiner 16 Rosefin shiner 17 Pinewoods shiner 18 Sandbar shiner 19 Striped jumprock 20 Blacktip jumprock 21 Margined madtom 22 Pirate perch 23 Speckled killfish 24 Redbreast sunfish 25 Green sunfish 26 Warmouth
27 Pumpkinseed sunfish 28 Fantail darter
1.6.2 Selected Species
Six species were chosen for this experiment to aid in the development of a
regional screen: the Bluehead Chub (Nocomis leptocephalus), Redbreast Sunfish
(Lepomis auritus), Johnny Darter (Etheostoma nigrum), Bluegill (Lepomis macrochirus),
Margined Madtom (Noturus insignis), and the Swallowtail Shiner (Notropisprocne).
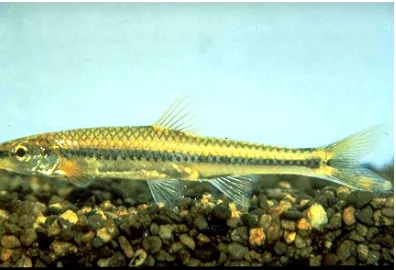
The Bluehead Chub, shown in Figure 1.3, is in the cyprinidae family. It was
chosen to represent chubs for the experiment. The Virginia Tech College of Natural
Resources Virtual Aquarium describes it as having a stocky body, and very large head
tubercles on breeding males. It has a subterminal mouth, pointed snout, and small to
medium eye. The sides of the body are an olive green color, and the dorsal and tail fins
are orange to orange red. Only the breeding males have a blue head. An average adult is
70-160 mm (0.2-0.52 ft). They generally live in cool rocky streams, and are often pool
dwellers. They feed on insects and plants
Source: http://faculty.virginia.edu/vcafs/education.html
Figure 1.3: Bluehead Chub
The Redbreast Sunfish (Figure 1.4) is in the centrarchidae family. It was chosen
for its importance to the NC DWQ and NC WRC. It is also a species easy to collect. The
dark and very long. The mouth is medium and terminal, and the eye is quite large. The
males can have a bright red belly, and often blue iridescent markings can be found on the
snout. Orange and yellow-orange spots can be found on the bars. The caudal fins are
rounded out to a point, and the pectoral fin is also rounded. The average adult body
length is 90-185 mm (0.3-0.61 ft). The Redbreast is found in warm streams of low
gradients, often in the pools and along the edges of the stream. They feed on insects,
crayfish, and other arthropods. Often they are fished recreationally for food.
Source: http://www.cnr.vt.edu/efish/families/redbreastsun.html
Figure 1.4: Redbreast Sunfish
The Johnny Darter, shown in Figure 1.5, is in the percidae family, with large
pectoral fins, high dorsal fins, and a rounded tail fin. Both the dorsal and tail fins are
translucent with dark speckles. The body is long and slender, with the eyes being nearly
at the top of the head. The mouth is terminal and the nose is blunt. There are diamond
shaped black spots running the length of the body. The body is tan with a gold-green
iridescence. The average length of an adult Johnny is 30-40 mm (0.1-0.13 ft). Its habitat
is in warm streams over either gravel, sand or silt. It can be found in small riffles, pools,
and runs. It eats insects and other invertebrates. The Johnny is tolerant of pollution, and
Source: http://www.agriculture.purdue.edu/fnr/afs/puafsx.html
Figure 1.5: Johnny Darter
The Bluegill, shown in Figure 1.6, is another member of the centrarchidae family.
The Virtual Aquarium describes it as having a very deep and compressed body with a
small terminal mouth. It has a dark earflap that is smaller than that of the Redbreast.
There is a dark spot near the rear of the second dorsal fin which aids in the identification
of the Bluegill. The blue/blue-green sides have dark vertical bars running down them.
The average body size for adults is 80-220 mm (0.26-0.72 ft). The Bluegill resides in
pools of low to moderate gradient streams. It feeds on small aquatic terrestrial insects and
plants. This fish is a popular sport fish.
Source: http://aged.ces.uga.edu/2004cds/cd1/Hot_Potatoes/Fish_Identification/Natural_Resources_Fish_ID.htm
Figure 1.6: Bluegill
The Margined Madtom is in the ictaluridae family. As shown in Figure 1.7, it
looks like a small catfish. The Virtual Aquarium describes the body as being mildly
elongated and compressed posteriorly, with a straight pectoral spine. The head is broad
brown ones elsewhere. Some of the fins have dark markings on the tips. The pectoral
fins and spine can be sharp to the touch. The average body length of adults is 80-120mm
(0.26-0.39 ft). The Margined Madtom resides in water bodies from large creeks to large
rivers of low to moderate gradient. The majority of their diet is insect larvae, however
they are also known to eat small fish and terrestrial insects. The spotted species, similar
to the Margined Madtom, is endangered.
Source: http://www.cnr.vt.edu/efish/families/marmadtom.html
Figure 1.7: Margined Madtom
The Swallowtail Shiner, shown in Figure 8, is in the Cyprinidae family. The
Virtual Aquarium describes it as having a slender elongated body, with a subterminal or
slightly inferior mouth, and a slightly pointed or rounded snout. The dorsal fin begins
along the back have of the pelvic fin base. The Swallowtail is a pale yellow color and has
a darker blue stripe running the length of its side. The fins are somewhat yellow in color,
and there is a small black spot at the base of the tail fin. The average length of adults is
40-55 mm (0.13-0.18 ft). It prefers pools of warm creeks and rivers, and feeds on insects,
worms, mites, microcrustaceans, and algae. This species was chosen based on its
similarity to the endangered Cape Fear Shiner, which is of great importance to regulatory
2.0 Materials and Methods 2.1 Collection of Fish
Fish were collected from local streams at least 15 hours in advance of using them for testing purposes. With a team of two to three people, the fish were collected by electrofishing using a model 12-A POW electrofisher from Smith-Root, Inc. Two sites along Crabtree Creek in Raleigh, NC, were used for collection. One site is located beside Crabtree Valley Mall and another near Crabtree Lake. The third site used for collection was Rocky Branch, near the intersection of Western Blvd. and Hunt Dr. in Raleigh, NC. Approximate longitudinal and latitudinal coordinates are as follows:
Crabtree Creek (near Crabtree Valley Mall) 35º 50’ 12” N, 78º 40’ 29.9” W Crabtree Creek (near Crabtree Lake) 35º 50’ 16” N, 78º 46’ 50.8” W
Rocky Branch 35º 46’ 32” N, 78º 39’ 33.8” W
After the fish were collected they were transported in a 37.85 Liter (10 Gallon) Coleman Advantage cooler. A portable air pump named the “Bubble Box” by Marine Metal Products was used to provide oxygen to the cooler during transfer to the project site. After collecting the fish, the larger species including the Bluehead Chub, Redbreast Sunfish, and Bluegill were stored and allowed to rest overnight in a 0.61 m x 0.61 m (2 ft x 2 ft) Team Numark Bait Cage floating in the secondary pond. The smaller fish,
2.2 Project Site
The data collection site was located on the Lake Wheeler Road Field Laboratory operated by North Carolina State University south of Raleigh, NC. The primary pond for the site is shown in Figure 2.1. From the primary pond, water is pumped to a smaller secondary pond used for flume studies. Water is then pumped from the secondary pond using a 0.11 cm3/s (4 ft3/s) gravity flow pump into the flume. The pump could be
controlled electrically by a Cutler-Hammer general duty safety switch and manually with a screw valve. For the purposes of this experiment both methods were used in order to achieve the necessary flow rates.
Pond
Flume
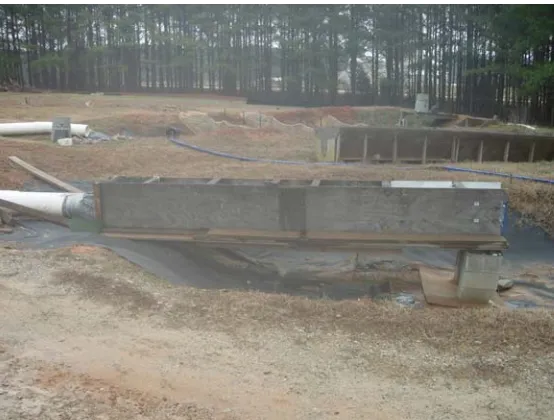
Figure 2.2: Worksite showing secondary pond and flume
2.3 Flume Design
The experiment utilized a flume as a means for testing the fishes’ critical velocity. The flume is located in a basin formerly used for sediment studies south of the secondary pond shown in Figure 2.2. One side of the flume rested at the edge of the sediment basin, while the other end of the flume was in the middle of the basin resting on concrete blocks. It was surveyed and set at a zero percent slope. The flume, shown in Figures 2.3 and 2.4, is 4.9m (16 ft) in length and 0.41m (1.35 ft) in width. The flume walls are 0.61m (2 ft) in height. The basic structure of the flume is constructed of lumber with plywood walls and floor. Connected alongside the flume is a walkway to use while the test is being run. A mesh lining covers the end of the flume located in the basin to catch the fish when they have reached their critical velocity and become exhausted. A series of two
the inlet pipe. The walls and floor of the flume were painted white in order to better see the fish. A synthetic fabric connected the inlet pipe to the flume in order to prevent water from flowing out of the back of the flume. Additional photographs and figures can be found in Appendix A.
During the test, water flowed out of the back of the flume and into the basin. As the basin filled a Honda 4.0 GX 120 Hypro gasoline driven, self priming centrifugal pump (model 1572-SPX) was used to pump water from the basin. A small 5.08 cm (2 in.) pipe drained water from the bottom of the pond. Also a section was cut from a wooden gate at the back of the basin, so that when water rises to a higher level it spills out of the back of the basin into a constructed waterway leading towards the woods shown in Figure 2.5.
The flume was calibrated using predicted flowrate calculations for the site and measuring devices to ensure that the flow meter was indicating the proper velocity. A series of test runs were preformed with the flume prior to the experiment in order to become efficient in the experimental process before adding the fish.
Figure 2.4: Front/Top view of flume
Figure 2.5: The pipe leading to the woods carries the drained water, while the channel carries the water exiting through the section cut from the wooden gate.
in a stream. The increasing depth of water with increasing flowrate would then mimic what occurs in nature with storms of increasing intensities. As a result of choosing this experimental setup, water velocity in the flume varies with depth. The velocity readings were taken at 60% of the water depth in the flume. This depth is accepted as the average velocity.
2.3.1Flowmeter and other equipment
The current meter used in the experiment was produced by the Rickly Hydrological Company. The model description below is taken from their website: http://www.rickly.com/sgi/pygmy.htm
“USGS Pygmy-MH Meter-Model 6225
The USGS Pygmy-MH meter is a magnetic head current meter with the same basic design as the standard Pygmy meter with the exception of shaft and binding post contact. The Pygmy-MH has a miniature reed switch and magnetic shaft which allows for reduced friction for better low velocity response and produces a cleaner signal for the AquaCalc 5000 and AquaCount. The meter uses the standard Pygmy rating table.”
2.4 Experimental Design
Experiments were conducted eight times over a 62 day period between September and November, 2005. No fish was used twice, and none was kept longer than 15 hours before use. Each experiment run included a mix of the six test species. The data set for each species was comprised of individuals tested on different days and, when possible, different streams. A minimum of 20 individuals were tested for each species.
flume at this flowrate and given a minimum of ten minutes to acclimate to the
surroundings. By the end of the ten minutes, the fish are facing the current and swimming against it, towards the flume inlet. If a fish was flat against the mesh at the outlet of the flume by the end of the acclimation period it was considered to be exhausted and not used as part of the experiment.
After ten minutes the velocity was increased by approximately 0.1 m/s (0.33 ft/s). After this ten minute period the velocity was lowered back to the resting velocity for five minutes. After the rest, the velocity was increased by approximately 0.1 m/s (Figure 2.6) from the last ten minute test period, followed again by a five minute rest. The velocity was increased in this manner until it either reached the maximum velocity the pump could provide, or all of the fish were exhausted.
Experimental Design
0 0.2 0.4 0.6 0.8 1 1.2
0 20 40 60 80 100 120 140
Time, minutes
Ve
lo
c
it
y
, m/s
A fish was considered to be exhausted when it was pushed up against the mesh at the outlet of the pipe. If it did not start swimming after a gentle prod with a hand it was removed from the flume. The species, body length, and the velocity at which it became exhausted were recorded for each individual. A ruler connected to a flat board was used as a measuring device, as shown in Figure 2.7. The critical velocity of the fish was considered to be the greatest velocity which it could swim against for a period of ten minutes. Using this definition, the critical velocity assigned to each fish is the velocity for the last ten minute period it successfully completed and not the velocity at which it became exhausted.
3.0 Results 3.1 Hypotheses
1. The null hypothesis is that there is no difference in critical velocities between species tested in this experiment.
2. The secondary hypothesis is that the velocity ranges within each species will be dependent on the length of the individual fish.
3.2 Data Summary
The data for this experiment were analyzed using SAS® 9.1.3 statistical software. There were a total of 202 observations over the six species of fish. The number of
observations and the mean critical velocity for each species can be found in Table 3.1. The Bluehead Chub had the highest critical velocity at 85.55 cm/s (2.81 ft/s), and the Bluegill had the lowest critical velocity at 37.05 cm/s (1.22 ft/s). The overall mean for the 202 observations was 53.57 cm/s (1.76 ft/s).
Table 3.1: Summary of mean critical velocities for each species in cm/s. Statistical data for Margined Madtom is not based on a normalized data set and should not be used as basis for design. Means for Johnny Darter and Bluehead Chub do not reflect true means, because the maximum flows tested for each species were 70 cm/s (2.3 ft/s) and 100cm/s (3.3 ft/s) respectively.
Species
Individuals Tested
Mean Critical Velocity cm/s
Overall
Mean 202 53.57
Bluegill 61 37.05
Bluehead chub 33 85.56
Johnny darter 21 67.76
Margined madtom 9 48.67
Redbreast sunfish 52 43.89 Swallowtail shiner 26 61.42
3.2.1 Bluehead Chub