Segmentation of Outer Retinal Layers Using
Model Selection Algorithms
T. Shanmugavalli1, K.Sridar2
PG Scholar, Veerammal Engineering College, K. Singarakottai, Tamil Nadu, India1
Assistant Professor, Department of CSE, Veerammal Engineering College, K. Singarakottai, Tamil Nadu, India2
ABSTRACT: Extraction of image-based biomarkers, such as the presence, visibility or thickness of a certain layer,
from 3D optical coherence tomography data provides relevant clinical information. We present a method to simultaneously determine the number of visible layers in the outer retina and segment them. The method is based on a model selection approach with special attention given to the balance between the quality of a fit and model complexity. This will ensure that a more complex model is selected only if this is sufficiently supported by the data. The performance of the method was evaluated on healthy and retinitis pigmentosa (RP) affected eyes. Additionally, the reproducibility of automatic method and manual annotations was evaluated on healthy eyes. A good agreement between the segmentation performed manually by a medical doctor and results obtained from the automatic segmentation was found. The mean unsigned deviation for all outer retinal layers in healthy and RP affected eyes varied between 2.6 and 4.9 µm. The reproducibility of the automatic method was similar to the reproducibility of the manual segmentation. Overall, the method provides a flexible and accurate solution for determining the visibility and location of outer retinal layers and could be used as an aid for the disease diagnosis and monitoring.
KEYWORDS: Akaike information criteria, Attenuation coefficient, Bayesian information criteria, Information
complexity, Maximum likelihood estimation, Model selection, Retinitis pigmentosa.
I. INTERODUCTION
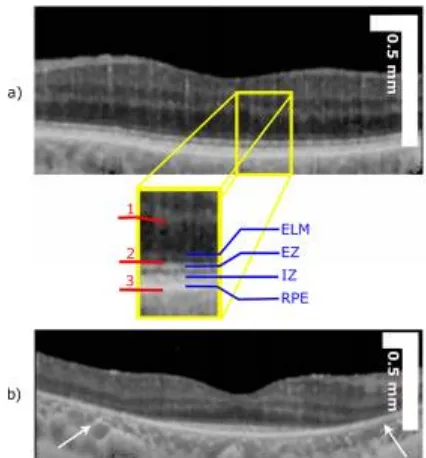
Fig. 1: An OCT B-scan of a healthy (a) and RP (b) affected retina after conversion to attenuation coefficient (see section III-A). The arrows point to areas where several outer retinal layers are no longer visible. Boundaries marked with red lines are obtained with our previously proposed method (see section III-A) and are used to define the region of interest (the outer retina). The abbreviations of these interfaces are as follows: 1. OPL - ONL interface, 2. anterior EZ boundary and 3. Posterior RPE boundary. The outer retinal layers and their abbreviations are indicated with blue lines.
Clustering Based Segmentation
Clustering is nothing but an attempt in which measurement points or patterns are grouped together. This technique is generally applied for data of n dimension. This n corresponds to an arbitrary number, i.e. it can be two, three or more. The clustering technique is best suited for sparse type of images. This technique includes methods like kmeans, fuzzy c-means etc. Subrajeet Mohapatra & Deepti Patra proposed an automated nucleus segmentation method. In the proposed technique, two step segmentation is done to segment a WBC nucleus from rest of the image objects. In first stage an initial segmentation is performed by executing a semi supervised k-means clustering. The next stage is a follow up of first step in which a second stage of segmentation is done using nearest neighbor classification in L*a*b space.
II. LITERATURE SURVAY
PAPER-1 SEGMENTATION OF 4D CARDIAC MRI: AUTOMATED METHOD BASED ON
SPATIO-TEMPORAL WATERSHED CUTS
We propose a new automated and fast procedure to segment the left ventricular myocardium in 4D MRI sequences. Both quantitative and qualitative evaluations are provided. We demonstrate the accuracy of the proposed method. Here we used discrete mathematical morphology. The time efficiency is high. The accuracy of the automated method compared to manual segmentations performed by two cardiologists; the ability of the method to compute reliable characteristics of the LV (ejection fraction and left ventricular mass); the temporal continuity of the resulting automated segmentation; the time-efficiency (about 3’ to segment a sequence of 25 3D-images on a low-end computer) of the proposed method; and the robustness of the few parameters whose setting rely mostly on physical and anatomical facts. MR images of the LV, together with three associated segmentations: two handmade segmentations – each one of them performed by an independent and blinded expert cardiologist and one 4D automated segmentation obtained by the proposed method. The first objective of this paper is to show that mathematical morphology offers interesting alternatives to these approaches in the important and difficult task of designing cardiac segmentation methods that can be used in clinical routine. We introduced the watershed cuts, a notion of watershed in edge-weighted graphs which is optimal in a sense equivalent to minimum spanning trees. This paper presents the first application of this new paradigm. Furthermore, this paper introduces the watershed-cuts in 4-dimensional spaces (3D+time). Our second objective is to show the ability of this operator to take into account both the spatial and temporal gradient of the images and therefore its ability to produce segmentations that are spatially as well as temporally consistent. The proposed method is evaluated on cine-MR image following by this sequence
the accuracy of the automated method compared to manual segmentations performed by two cardiologists; the ability of the method to compute reliable characteristics of the LV (ejection fraction and left ventricular
mass);
the temporal continuity of the resulting automated segmentation;
the time-efficiency (about 3’ to segment a sequence of 25 3D-images on a low-end computer) of the proposed method; and
The robustness of the few parameters whose setting rely mostly on physical and anatomical facts.
Since it is independent of any high-level model, the proposed method can be used to fairly assess model-based segmentation schemes by comparing their results with our non-model based segmentation, hence, discarding bias due to the choice of different models. Furthermore, the proposed method can be used to register generic physiological models of the heart to real patient specific cardiac images. In general, it is indeed easier to register a model to a binary segmentation than directly to images. So we introduce in this paper a new watershed framework which allows for segmenting spatio temporal images that we apply to medical image analysis. Specifically, we propose a new automated and fast procedure to segment the left ventricular myocardium in 4D (3D+t) cine-MRI sequences. The successive segmentations obtained over the time take into account spatio-temporal properties of the images. Thanks to the comparison with manual segmentation performed by two cardiologists, we demonstrate the accuracy of the proposed method and the relevance of the ejection fraction and myocardium mass derived from the automated segmentations. Therefore, this automated method can be used in clinical routine. The proposed scheme does not permit the direct derivation of deformation parameters. Such deformation parameters can be obtained thanks to a model of the heart movement, and such a heart model needs the obtained segmentations as control points. Future work will aim at computing deformation fields whose accuracy will be improved by registration with other modalities such as delayed enhanced MRI and CT scan.
DISADVANTAGE
To improve by registration with other modalities such as delayed enhanced MRI and CT scan
PAPER -2 A REVIEW OF SEGMENTATION METHODS IN SHORT AXIS CARDIAC MR IMAGES
This paper is a review of fully and semi-automated methods performing segmentation in short axis images using a cardiac cine MRI sequence. We will review automatic and semi-automatic segmentation methods of cine MR images of the cardiac ventricles, using the short-axis view. The wide variety of image-driven approaches using weak or no prior have been proposed to tackle the ventricle segmentation in cardiac MRI. Almost all of these methods require either minimal or great user intervention. If image based and pixel classification-based approaches offer a limited framework for incorporating strong prior, straightforward extensions of deformable models in this sense have been extensively studied. In the next section are presented Methods relying on strong prior for heart segmentation. It can be generated by manually segmenting an image or by integrating information from multiple segmented images from different individuals. Strong prior based methods can overcome the previously defined segmentation problems.
(i) No information is used, but our study shows that min this case user interaction is required
(ii) Weak prior, that is, low level information such as geometrical assumptions on the ventricle shape, often combined to low-level user interaction,
(iii) Strong prior such as statistical models, constructed or learned from a large number of manually segmented images, not requiring user interaction.
Our image segmentation categorization includes on the one hand image-driven and pixel classification based approaches, and deformable models, making use of weak or no prior.
DISADVANTAGE
This particularly complex segmentation task, prior knowledge is required. Major challenges linked to this segmentation task.
Image processing and pattern recognition problems are occurring.
PAPER-3 MULTI-ATLAS SEGMENTATION OF THE PROSTATE: A ZOOMING PROCESS WITH ROBUST REGISTRATION AND ATLAS SELECTION
III. METHODOLOGY & IMPLEMENTATION
1. PREPROCESSING
The Blood cell image is taken as input. Because these data are collected from outside sources, Since diffraction effects are almost always negligible once the blood cell is of visible size, we use the disc function to approximate the real image in our experiments. Even though the actual MRI image for cameras used for the test images are unknown, the disc approximation seems to be quite adequate. Our method still get the amount of local blood cell images for all these test images, depicts 3D geometric information for each scene, and does a good job in identifying in-focus subjects.
2. FEATURES EXTRACTION
Feature extraction in image processing is a technique of redefining a large set of redundant data into a set of features of reduced dimension. Transforming the input data into the set of features is called feature extraction. Feature selection greatly influences the classifier performance; therefore, a correct choice of features is a very crucial step. In order to construct an effective feature set, several published articles were studied, and their feature selection methodology was observed. It was noted that certain features were widely used as they gave a good classification. We implemented these features onwhole images in our system. Those features were considered to boost the classifier performance.
Use analysis techniques on a segmented image to mark the location and size of complete and non overlapping cells in a microscopic image.
Green plane feature extraction, Shade correction, Executed detection output will shows like below images
FIG2 GREEN PLANE EXTRACTION
Fig3 Execution Detection
3. CELL FEATURES SEGMENTED
A least-squares partitioning method that divide a collection of objects into the groups. The algorithm iterates over two steps:
1. Compute the mean of each cluster.
2. Compute the distance of each point from each cluster by computing its distance from the corresponding cluster mean. Assign each point to the cluster it is nearest to.
Fig4 Vessels removal
The initial assignment of points to clusters can be done randomly. In the course of the iterations, the algorithm tries to minimize the sum, over all groups, of the squared within group errors, which are the distances of the points to the respective group means. Convergence is reached when the objective function (i.e., the residual sum-of-squares) cannot be lowered any more. The groups obtained are such that they are geometrically as compact as possible around their respective means.
4. CLASSIFIED FEATURES
Fig5 classification
Common Names: Classification
Fig 6 MA Detection
The classes may be specified a priori by an analyst (as in supervised classification) or automatically clustered (i.e. as in unsupervised classification) into sets of prototype classes, where the analyst merely specifies the number of desired categories. (Classification and segmentation have closely related objectives, as the former is another form of component labeling that can result in segmentation of various features in a scene.)
Process:
Image classification analyzes the numerical properties of various image features and organizes data into categories. Classification algorithms typically employ two phases of processing: training and testing. In the initial training phase, characteristic properties of typical image features are isolated and, based on these, a unique description of each classification category, i.e.training class, is created. In the subsequent testing phase, these feature-space partitions are used to classify image features.
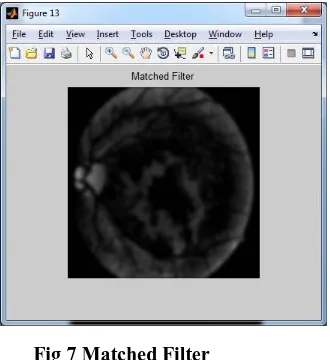
Fig 7 Matched Filter
The description of training classes is an extremely important component of the classification process. In supervised classification, statistical processes (i.e.based on an a priori knowledge of probability distribution functions) or distribution-free processes can be used to extract class descriptors. Unsupervised classification relies on clustering algorithms to automatically segment the training data into prototype classes. In either case, the motivating criteria for constructing training classes is that they are:
independent, i.e. a change in the description of one training class should not change the value of another,
reliable, all image features within a training group should share the common definitive descriptions of that group.
A convenient way of building a parametric description of this sort is via a feature vector , where n is the number of attributes which describe each image feature and training class. This representation allows us to consider each image feature as occupying a point, and each training class as occupying a sub-space (i.e. a representative point surrounded by some spread, or deviation), within the n-dimensional classification space. Viewed as such, the classification problem is that of determining to which sub-space class each feature vector belongs.
5. CLASSIFICATION
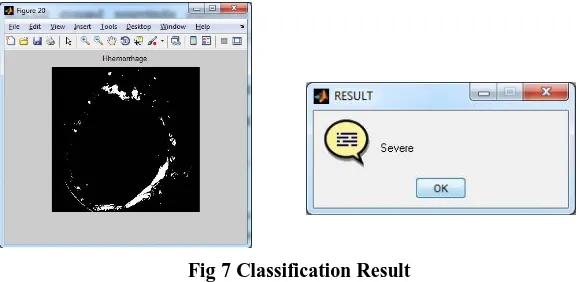
This classification result gives the details aboutretinitis pigmentosa affected eyesand nonretinitis pigmentosa affected eyesblood cells .to get the spitted part from the k means segmentation result. Above the result which is used to find theretinitis pigmentosa affected eyesand nonretinitis pigmentosa affected eyescells from this module. Classification result generates the kmeans cluster and also use SVM (Support vector machine).
Fig 7 Classification Result
IV. CONCLUSION AND FUTURE ENHANCEMENT
CONCLUSION
In this paper we have proposed a framework for comparing image segmentation algorithms, and performed one such comparison. Our framework consists of comparing the performance of segmentation algorithms based on three important characteristics: correctness, stability with respect to parameter choice, and stability with respect to image choice. If an algorithm performs well with respect to all of these characteristics, it has the potential to be useful as part of a larger vision system.
Image segmentation has become a very important task in today’s scenario. In the present day world computer vision has become an interdisciplinary field and its applications can be found in any area be it medical, remote sensing, electronics and so on. Thus, to find a appropriate segmentation algorithm based on your application and the type of inputted image is very important.
FUTURE ENHANCEMENT
In this project we detect the affected part on a MR image. And to find the connection between the probabilistic label fusion model and the recently proposed kmeans segmentation method. Another contribution is that label information is incorporated into image registration to improve registration accuracy. Experimental results show that registration refinement improves segmentation accuracy. The method produces reliable clinical indexes which are in good agreement with the manual measurements. It can provide useful information for clinicians inretinitis pigmentosa affected eyes disease diagnosis.
REFERENCES
[1] J.Cousty, L.Najman, M. Couprie, S. Clément-Guinaudeau, T. Goissen,And J. Garot, “Segmentation of 4D cardiac MRI: Automated methodBased on spatio-temporal watershed cuts,”
[2] M. Jolly, “Fully automatic left ventricle segmentation in cardiacCine MR Images using registration and minimum surfaces,” MIDAS.
[3] M. Lorenzo-Valdés, G. I. Sanchez-Ortiz, A. G. Elkington, R. H. Mohiaddin,And D. Rueckert, “Segmentation of 4D cardiacMRimages usinga probabilistic atlas and the EM algorithm,”
[4] M. Lynch, O. Ghita, and P. F. Whelan, “Segmentation of the left ventricleOf the heart in 3- MRI data using an optimized NonrigidTemporal model,”
[5]C. Petitjean and J. N. Dacher, “A review of segmentation methodsIn short axis cardiac MR images,”
[6] T. R. Burke, D. W. Rhee, R. T. Smith, S. H. Tsang, R. Allikmets, S. Chang, M. A. Lazow, D. C. Hood, and V. C. Greenstein, “Quan-tification of peripapillary sparing and macular involvement in stargardt disease (STGD1),” Investigative Ophthalmology and Visual Science, vol. 52, no. 11, pp. 8006–8015, 2011.
[7] R. F. Spaide and C. A. Curcio, “Anatomical correlates to the bands seen in the outer retina by optical coherence tomography: Literature review and model,” Retina, vol. 31, no. 8, pp. 1609–1619, 2011.
[8] E. Ergun, B. Hermann, M. Wirtitsch, A. Unterhuber, T. H. Ko, H. Sattmann, C. Scholda, J. G. Fujimoto, M. Stur, and W. Drexler, “Assessment of central visual function in stargardt’s disease/fundus flavimaculatus with ultrahigh-resolution optical coherence tomography,” Investigative Ophthalmology and Visual Science, vol. 46, no. 1, pp. 310–316, 2005.
[9] A. Lang, A. Carass, M. Hauser, E. S. Sotirchos, P. A. Calabresi, H. S. Ying, and J. L. Prince, “Retinal layer segmentation of macular oct images using boundary classification,” Biomedical Optics Express, vol. 4, no. 7, pp. 1133–1152, 2013.
[10] R. Kafieh, H. Rabbani, and S. Kermani, “A review of algorithms for segmentation of optical coherence tomography from retina,” Journal of Medical Signals and Sensors, vol. 3, no. 1, pp. 45–60, 2013.
[11] D. C. DeBuc, A review of algorithms for segmentation of retinal image data using optical coherence tomography. InTech, 2011, vol. 6688, ch. 2, pp. 14–54.
[12] K. A. Vermeer, J. van der Schoot, H. G. Lemij, and J. F. de Boer, “Automated segmentation by pixel classification of retinal layers in ophthalmic OCT images,” Biomedical Optics Express, vol. 2, no. 6, pp. 1743–1756, 2011.
[13] M. Mujat, R. C. Chan, B. Cense, B. Hyle Park, C. Joo, T. Akkin, T. C. Chen, and J. F. de Boer, “Retinal nerve fiber layer thickness map determined from optical coherence tomography images,” Optics Express, vol. 13, no. 23, pp. 9480–9491, 2005.
[14] M. A. Mayer, J. Hornegger, C. Y. Mardin, and R. P. Tornow, “Retinal nerve fiber layer segmentation on FD-OCT scans of normal subjects and glaucoma patients,” Biomedical Optics Express, vol. 1, no. 5, pp. 1358–1383, 2010.
[15] J. Novosel, G. Thepass, H. G. Lemij, J. F. de Boer, K. A. Vermeer, and L. J. van Vliet, “Loosely coupled level sets for simultaneous 3D retinal layer segmentation in optical coherence tomography,” Medical Image Analysis, vol. 26, no. 1, pp. 146–158.
[16] H. Ishikawa, D. M. Stein, G. Wollstein, S. Beaton, J. G. Fujimoto, and J. S. Schuman, “Macular segmentation with optical coherence tomography,” Investigative Ophthalmology and Visual Science, vol. 46, no. 6, pp. 2012–2017, 2005.
[17] P. A. Dufour, L. Ceklic, H. Abdillahi, S. Schroder, S. De Dzanet, U. Wolf-Schnurrbusch, and J. Kowal, “Graph-based multi-surface seg-mentation of OCT data using trained hard and soft constraints,” Medical Imaging, IEEE Transactions on, vol. 32, no. 3, pp. 531–543, 2013. [18] A. Carass, A. Lang, M. Hauser, P. A. Calabresi, H. S. Ying, and J. L. Prince, “Multiple-object geometric deformable model for segmentation of macular OCT,” Biomedical Optics Express, vol. 5, no. 4, pp. 1062– 1074, 2014.
[19] S. J. Chiu, X. T. Li, P. Nicholas, C. A. Toth, J. A. Izatt, and S. Farsiu, “Automatic segmentation of seven retinal layers in SD-OCT images congruent with expert manual segmentation,” Optics Express, vol. 18, no. 18, pp. 19 413–19428, 2010.
[20] M. Garvin, M. Abramoff, R. Kardon, S. Russell, X. Wu, and M. Sonka, “Intraretinal layer segmentation of macular optical coherence tomogra-phy images using optimal 3-D graph search,” Medical Imaging, IEEE Transactions on, vol. 27, no. 10, pp. 1495–1505, 2008.
[21] Q. Yang, C. A. Reisman, K. Chan, R. Ramachandran, A. Raza, and D. C. Hood, “Automated segmentation of outer retinal layers in macular OCT images of patients with retinitis pigmentosa,” Biomedical Optics Express, vol. 2, no. 9, pp. 2493–2503, 2011.
[22] R. Kafieh, H. Rabbani, M. D. Abramoff, and M. Sonka, “Intra-retinal layer segmentation of 3D optical coherence tomography using coarse grained diffusion map,” Medical Image Analysis, vol. 17, no. 8, 2013.
in Engineering in Medicine and Biology Society (EMBC), 2015 37th Annual International Conference of the IEEE, Aug 2015, pp. 5646– 5649. [26] G. Staurenghi, S. Sadda, U. Chakravarthy, and R. F. Spaide, “Proposed lexicon for anatomic landmarks in normal posterior segment spectral-domain optical coherence tomography,” phthalmology, vol. 121, no. 8, pp. 1572–1578.