ISSN (Online) : 2319 - 8753 ISSN (Print) : 2347 - 6710
I
nternationalJ
ournal ofI
nnovativeR
esearch inS
cience,E
ngineering andT
echnology Volume 3, Special Issue 3, March 20142014 International Conference on Innovations in Engineering and Technology (ICIET’14)
On 21st & 22nd March Organized by
K.L.N. College of Engineering, Madurai, Tamil Nadu, India
ABSTRACT— Voltage stability is an important problem in the Emerging world of technologies and development, the main objectives in operating an Electric power system is to maintain a proper voltage level thought a system. The Failure occurred in the system equipment to be damage and blackouts. This paper mainly discusses the nonlinear aspect of power systems, with emphasis on voltage instability. In that scenario modal analysis method make use of the power system Jacobean matrix to determine the eigenvalues necessary for the evaluation of the voltage stability of the power system. The least Eigen values indicate the proximity of the system to voltage instability. The voltage profile and critical loading is found by using continuation power flow method. These methods were implemented on IEEE 14 bus system result of the proposed work held on with the help of MATLAB software.
KEYWORDS—Continuation Power Flow, Modal
Analysis, Distributed Generation, Voltage Collapse, Power System Analysis.
I. INTRODUCTION
The important operating tasks of power utilities are keep voltage within the operating limit. In recent year power demand is increase worldwide. A Power system is interconnected in to generating station transmission line and distribution line. The existing power system lines are being more and more pressurized. In that power system distribution networks are usually subjected to voltage instability; sometimes voltage collapses. Voltage collapse has become increasing threat to power system security and reliability. Voltage stability analysis is widely used in the
planning and daily operation of the power system and online monitoring of the distribution system. Load flow techniques are widely used for voltage stability analysis [1].
The modal analysis method is best method for voltage stability analysis compare to L-index method [2].Voltage stability analysis is most important factor for highly developed networks. Voltage stability is the ability of power system to maintain steady acceptable voltage at all buses in the system under normal condition [3].
Voltage instability stems from the attempt of load dynamics to restore power consumption beyond the capability of the combined transmission and distribution system[3].Voltage stability problems are easily predict through the steady state analysis and load flow analysis. The voltage stability problems are mainly depends up on reactive power variation. The control of reactive power some distributed technologies are used to generate reactive power and improve voltage stability.
The voltage stability problems are mainly occurred at the distribution side of the power system network. In that distribution network is customer side (or) load side of the power system network [4].
The distributed generation is connected at the customer side (or) load side of the power system network. The distributed generation to generate the power from near to the load .In that distributed generation connect to the power system many benefits are there we provide quality of power to the customer ,improve voltage profile, Reduce power loss, improve system reliability and efficiency [5,6].
There are many methods are currently used in the voltage stability analysis, the methods are Modal analysis, Steady state voltage stability index, Newton rap son load
Optimal Placement of Distributed Generation
for Voltage Stability Improvement and Loss
Reduction in Distribution Network
S.P.Rajaram
#1, V.Rajasekaran
*2, V.Sivakumar
#3#1Department of Electrical and Electronics Engineering,K.L.N College of Engineering, Madurai, India.
*2Department of Electrical and Electronics Engineering, *PSNA College of Engineering and technology, Dindigul, India.
#3Corresspondingauthor, Department of Electrical and Electronics Engineering, K.L.N College of
Distribution Network
Copyright to IJIRSET www.ijirset.com 530
M.R. Thansekhar and N. Balaji (Eds.): ICIET’14 flow analysis, L-Index method, Singular value decomposition, Line stability index, Continuation power flow method. This paper Modal analysis and continuation power flow methods are used to find the voltage stability analysis. To determine the optimal allocation of distributed generation is presented. Modal analysis and continuation power flow methods are used to find the optimal allocation of distribution generation. In that modal analysis method involved in Eigen values and Eigen vectors of reduced Jacobean matrix, the modal analysis method used to identify the weakest bus by calculating the participation factor, QV-sensitivity factor and stability margin [6]. Continuation power flow method is implemented in the power system analysis Tool box. In the Continuation power flow method voltage profile and critical loading is found. The weak bus is identified based on the voltage profile II. VOLTAGE STABILITY PROBLEMS A. Problem Identification Voltage stability problems are mainly occurred at distribution side and load side of the power system network. In that voltage stability problems are mainly occurred at in sufficient range of reactive power. The reactive power shortage mainly affects the voltage profile. To eliminate the reactive power shortage to increase the distributed generation technologies, distributed generation is to generate the reactive power. B. Modal Analysis Modal analysis is a static approach it is a best tool for voltage stability analysis. In that modal analysis method can be discover the instability characteristic effectively. The the modal analysis method is used to identify the weakest bus by calculating participation factor and sensitivity factor. Modal analysis ∆V/∆Q is a powerful technique to predict voltage collapse and determine stability margin in power system. By solving linearized power flow equation we get the ∆P and ∆Q matrix (1)
∆P- incremental change in bus real power ∆Q-incremental change in bus reactive power ∆V- incremental change in bus voltage magnitude ∆
-incremental change in bus voltage angle Find JR = [JQV-JQƟ JPƟ-1 JPV] (2)And ∆Q = JR ∆V (3)
∆V = JR-1 ∆Q (4)
Let JR= ε
(5)Where ε-Right Eigen vector of JR
-diagonal Eigen vector of JR
-left Eigen vector of JR Equation (5) rewritten as =ε
-1
(6)=ε
-1
∆Q (7)
∆v=
-1
∆Q (8)V=
-1 q (9)write above equation of ith mode becomes
Vi=1/
i qi (10) Constraints:
i =0 The System voltage is collapse.
i
0 The system voltage is stable.
i
0 The system voltage is unstable.C. Participation Factor
The Participation factor is to identify which the most critical bus is to leads the system voltage instability, usually the higher magnitude of participation factor the system is stable.
(11)
-Right eigenvector of kth element - Left eigenvector of kth element.
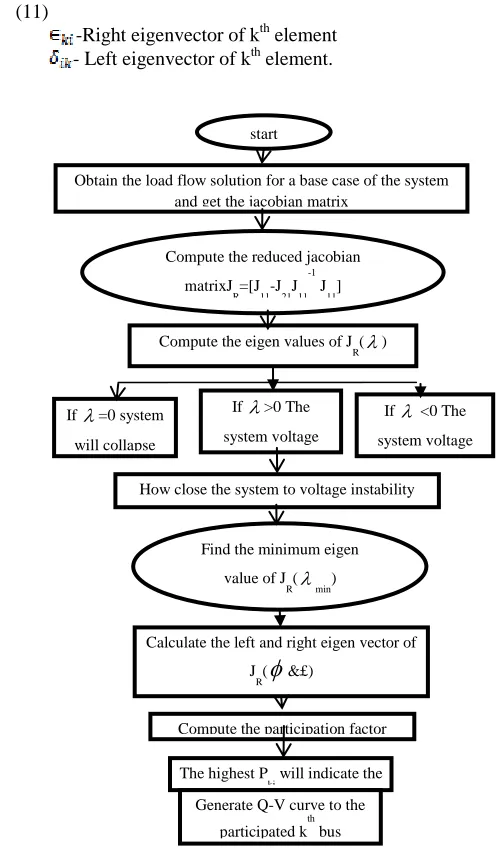
Fig. 1 Flow chart for modal analysis
start
Obtain the load flow solution for a base case of the system and get the jacobian matrix
Compute the reduced jacobian matrixJ
R=[J11-J21J11 -1
J
11]
Compute the eigen values of J
R()
If =0 system will collapse
If >0 The system voltage
stable
If <0 The system voltage
unstable How close the system to voltage instability
Find the minimum eigen value of J
R(min)
Calculate the left and right eigen vector of J
R(
&£)Compute the participation factor P
ki=ɸkiεki
The highest P
ki will indicate the
most participated k
th
bus to i
th
mode in the system Generate Q-V curve to the
participated k
th
Distribution Network
Copyright to IJIRSET www.ijirset.com 531
D. Continuation Power Flow
The identification of Maximum load ability limit most critical problem in voltage stability analysis. In that maximum load ability limit is does not calculate through the modal analysis. The continuation power flow method find the voltage profile up to the voltage collapse point. Voltage profile and critical loading is found weakest bus is identify based on the voltage profile .The continuation power flow method is implemented in PSAT consists of a predictor step realized by the computation of the tangent vector, initial solution and corrector step can be obtained either by means of a local parameters .Power flow equation expressed as
F (
,V﴿= K (12) Where represent the load parameter,
is the vector bus voltage angle, V is the Vector voltage magnitude and K is the percent load change at each bus. Load parameter varies from 0 ≤ ≤ criticalWhere
=0 ,base load condition
= critical, critical loading condition
Rearrange the power flow equation
F (
,V, )=0 (13)E. Predictor and Corrector Method
In the Continuation power flow method predictor and corrector steps are used to find the effective solution for power flow equation. In the predictor step tangent vector is calculated by deriving both side of the power flow equation.
(14)
Where
, V, represents the predicted solution ε- Weighting coefficientCorrector step is a slightly modified Newton raphson power flow equation
(15)
Fig. 2 Predictor and Corrector method
Fig. 2 Curve for predictor &corrector Method
III. DISTRIBUTEDGENERATION
Distributed generation technologies is to play a major role in power system network[4], In that distributed generators connected directly to the grid. Distributed generation to generate power from load side of the power system network [6].Importance of distributed generation is to improve reliability, security, efficiency and quality of the power system.
A. Distributed Generation Placement
The distributed generation placement in distribution network to improve the voltage profile reduces losses, improve reliability. In this paper we use continuation power flow can be used to find the voltage stability margin, based on the stability margin to find the collapse point of the distribution network, the modal analysis method to determine the critical modes of the distribution network. This voltage collapse and critical mode a bus is selected candidate for distributed generation placement. The CPF method highest voltage magnitude buses is selected candidate for DG placement and modal analysis method highest Eigen value, biggest participation factor and less stability margin in each mode is selected candidate for DG placement.
IV. RESULT AND DISCUSSION
A. Modal Analysis IEEE 14 Bus System
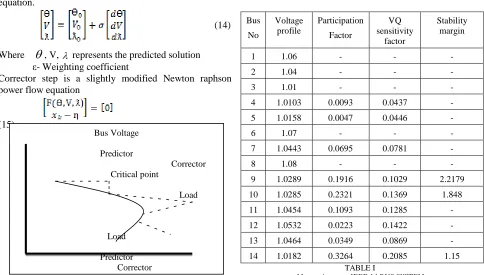
TABLE I
MODALANALYSIS IEEE 14BUSSYSTEM
Bus
No
Voltage profile
Participation
Factor
VQ sensitivity
factor
Stability margin
1 1.06 - - -
2 1.04 - - -
3 1.01 - - -
4 1.0103 0.0093 0.0437 -
5 1.0158 0.0047 0.0446 -
6 1.07 - - -
7 1.0443 0.0695 0.0781 -
8 1.08 - - -
9 1.0289 0.1916 0.1029 2.2179
10 1.0285 0.2321 0.1369 1.848
11 1.0454 0.1093 0.1285 -
12 1.0532 0.0223 0.1422 -
13 1.0464 0.0349 0.0869 -
14 1.0182 0.3264 0.2085 1.15 Bus Voltage
Predictor
Corrector Critical point
Load
Load
Predictor Corrector
Critical point
Distribution Network
Copyright to IJIRSET www.ijirset.com 532
M.R. Thansekhar and N. Balaji (Eds.): ICIET’14 From the above table bus number 14, 10, and 9 have the
highest participation factor for the critical mode. In the three buses bus 14 is a highest participation factor (0.3264).so bus no 14 indicates the highest contribution to voltage collapse.
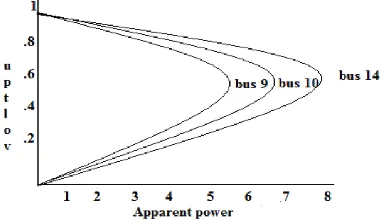
B. Modal Analysis IEEE 14 bus system output
The load voltage vs. apparent power graph is drawn for all buses in IEEE -14 bus system at zero power factor value. In that 14 system bus no 14 is least stable compared
C. Continuation Power Flow IEEE 14 Bus System Using PSAT
The CPF method critical loading and voltage profile is found. The weak bus is identified based on the voltage profile. The weak bus is considered as the optimal location to place a distributed generator to all other buses.
Fig. 3 Modal analysis IEEE 14 bus system output
TABLE II
POWER FLOW RESULT
TABLE IV
REAL AND REACTIVE POWER REPORT
The Continuation power flow method voltage profile and critical loading is found ( =2.5159). The weak bus is identified based on the voltage profile.
The Continuation power flow method bus number 14, 10, and 9 are critical bus in the IEEE 14 bus system. In the three buses bus no 14 is the most critical bus (0.54847).so bus no 14 indicates the highest contribution to voltage collapse.
Bus
V [p.u.]
max=2.5
159 Phase [rad] P gen [p.u.] Q gen [p.u.] P load [p.u.] Q load [p.u.]
01 1.06 0 13.14 3.290 0 0
02 1.0009 -0.57 1.002 9.776 0.761 0.445
03 0.93206 -1.44 0 4.576 3.305 0.666
04 0.62947 -1.17 0 0 1.677 0.140
05 0.62255 -0.98 0 0 0.266 0.056
06 0.96224 -1.92 0 4.102 0.392 0.263
07 0.68341 -1.65 0 0 0 0
08 0.98501 -1.65 0 1.686 0 0
09 0.57548 -1.92 0 0 1.035 0.582
10 0.59867 -1.97 0 0 0.315 0.203
11 0.75967 -1.95 0 0 0.122 8
0.063 15
12 0.86501 -2.00 0 0 0.214 0.056
13 0.81098 -2.00 0 0 0.473 0.203
14 0.54847 -2.14 0 0 0.522 0.175
Fro m Bus To Bu s Li ne P Flow [p.u.] Q Flow [ p.u.] P Loss [p.u.] Q Loss [p.u.]
02 05 1 2.0276 1.7963 0.4206 1.260
06 12 2 0.355 0.2052 0.0223 0.046
12 13 3 0.1186 0.1026 0.0072 0.006
06 13 4 0.8410 0.7095 0.0865 0.170
06 11 5 0.4679 0.7580 0.0814 0.170
11 10 6 0.2637 0.5244 0.0489 0.114
09 10 7 0.1057 -0.193 0.0046 0.012
09 14 8 0.2416 -0.027 0.0227 0.048
14 13 9 -0.303 -0.251 0.0884 0.180
07 09 10 0.9681 0.8040 0 0.373
01 02 11 10.026 0.6597 1.7421 5.262
03 02 12 -3.108 2.0725 0.7593 3.158
03 04 13 -0.196 1.8371 0.2675 0.661
01 05 14 3.1173 2.6311 0.8071 3.295
05 04 15 1.5935 -0.446 0.0942 0.292
02 04 16 2.6293 1.8457 0.6026 1.802
04 09 17 0.4169 0.2261 0.0026 0.296
05 06 18 2.057 0.2626 0 2.428
04 07 19 0.9681 0.1136 0 0.479
08 07 20 0 1.6865 0 0.516
TABLE III
LINE FLOW RESULT FOR CPF USING PSAT
S. No
TOTAL GENERATION
TOTAL LOAD TOTAL LOSSES Real Powe r Reactiv e Power Real Power Reacti ve Power Real power Reactiv e Power
1 14.14 59
23.4322 9.087 2.856 5.058 7
20.5762
Distribution Network
Copyright to IJIRSET www.ijirset.com 533
D. Voltage Magnitude of IEEE 14 bus system by using CPF
Fig. 4 Voltage magnitude for IEEE 14 bus system
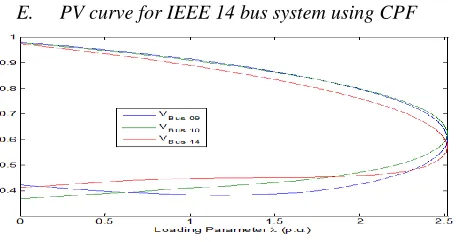
E. PV curve for IEEE 14 bus system using CPF
Fig. 5 Load voltage curve for IEEE 14 bus system
V. CONCLUSION
In this paper, Modal analysis and Continuation Power Flow method is used to voltage stability analysis of power system is presented. The voltage collapse problem is studied by using above two methods. Modal analysis technique, 14,10,9 buses are found to be the weakest and contributing to voltage collapse in IEEE 14 bus system. The stability margin or the distance to voltage collapse is identified based on voltage and reactive power variation. The Continuation power flow method voltage profile and critical loading is found. The weak bus is identified based on the voltage profile. In the continuation power flow method 14,10,9 buses are found to be the most critical and contributing to voltage collapse in IEEE 14 bus system.
REFERENCES
[1] G.B .Jamson and L.Lee, ”Distribution network reduction for voltage stability analysis and load flow calculation,” International journal of electrical power energy system, vol. no. 13, pp. 9-13, 1991.
[2] B.Gao, G.K.Morrison and P.Kundurl,”Voltage stability evaluation using modal analysis,” IEEE Transactions Power System,”vol. 7, no. 4, pp. 159-1542, Nov.1992.
[3] P.Kundur,”Power system stability and control,”New York:McGraw-Hill 1994.
[4] T.Gozel,U.Eminogule andM.H.Hocaoglu, “Thecontinuation power flow : A tool for steady state voltage stability analysis,”IEEE Tranactions on Power System, vol. 7, no. 1, pp. 416-423, Feb. 2008.
[5] Zhao Yang Dong and Junhuna Zaho,”Comparision of CPF and Modal analysis Methods in Determining Effective DG Location, IEEE 2010.
[6] Al-AbriRashid, “Voltage stability Analysis with High Distributed Generation Penetration,” Electrical and Computer Engineering Waterloo, Ontario, Canada 2012.
Distribution Network
Copyright to IJIRSET www.ijirset.com 534