Analysis of Implementing ISO 9001 Quality
Management System towards the Quality Performance
of Contractor on Infrastructure Project
Manlian Ronald. A. Simanjuntak. 1, Barcellius Nicholas C2
Professor of Construction Management, UPH Graduate Program, Jakarta, Indonesia1
Graduate Program of Master of Civil Engineering, UPH Graduate Program, Jakarta, Indonesia2
ABSTRACT:The growth of infrastructure projects in Indonesia is a represent of the seriousness from the government in increasing the capacity and capability of construction to become the foundation of national development. It’s seen from the infrastructure budget in the period of 2015-2017 is increasing by 123.4% from the previous period. West of Sumatra is an area at Indonesia which is the government focus on to be able to solve a number of land transportation infrastructure problems that have been wounded so far and it’s included in Western Indonesian National Roads Improvement Projects (WINRIP). In the highly demand of contractors to execute the infrastructure projects, the performance of contractor became an issue recently. A lot of quality problems showed up in contractor company which had the sertification of ISO 9001:2015. So with the help of reviewing the literature of Quality Management System, ISO 9001:2015, Contractor Performance, Infrastructure Project, Potrait of Contractor in Indonesia, and Relevant Researches will be the basis of this analysis to answers the problems of this research. Analysis performed with mix method of qualitative and quantitative. Interview is the part of qualitative method with 3 respondents and Questionnaires is the part of quantitative method with 39 respondents. Respondents should have a minimum of 3 years working experience to fill the quetionnaires. The data analysed by SPSS Program. The results shows that the determination of the parties who concerned and relevant to the quality management system in a company and improving the suitability, adequacy, and effectiveness of the quality management system are the essential requirements for successful implementation of the quality management system in contractor’s company. Meanwhile, the culture of the employees is found as a constraint of implementing ISO 9001:2015 in contractor’s company.
KEYWORDS: The Growth of Infrastructure Projects, Performance of Contractor, ISO 9001:2015
I. INTRODUCTION
II. REVIEWOFLITERATURE
Quality Management System
The Quality Management System is a set of documented procedures and standard practices for system management that aimed to assuring the conformity of a process and products (goods and services) to those requirements or regulations or specified by the customer or organization (Vincent Gaspersz, 2002). Quality Management Systems will review all activities of the overall management function which determines the quality policy, objectives and responsibilities, and implements them through tools such as: the determination and development of objectives and the need for quality and implementation of the quality management system (Quality Planning); the techniques and operational activities used to meet the quality requirements (Quality Control); planned and systematic actions that implemented and demonstrated to provide sufficient trust that the product will satisfy the need of the product quality (Quality Assurance); and actions taken to enhance the value of the product to the customer through enhancing the effectiveness and efficiency of processes and activities through the organitational structure of the company (Quality Improvement). Responsibility for quality management exists at all levels of management, but must be controlled by top management, and its implementation should involve all members of the organization. Indonesia adopted the ISO standard for the Quality Management System standard.
ISO 9001:2015
The latest version of international standardization ISO 9001 which is the only one Quality Management Systems that give a sertification to company that has implementing the quality management system. Has 10 clauses : Scope, Normative references, terms and definitions, context of the organization, leadership, planning, support, operation, performance evaluation, and improvement. There are 7 fundamentals in this ISO version: Customer focus, Leadership, People’s Involvement, Process Approach, Improvement, Evidence Based Decision Making, and Relationship Management. The benefits of implementing ISO 9001:2015: consistency & compatible across all standards; reduce conflicts & duplication from different management system standards; ability to easily migrate other management systems into one, such as OH&S, environment, etc; Minimise replication of documentation; Focus on more important/ high-risk processes (ISO 9001, 2015). From all of the ISO 9001 benefits, there are a lot of obstacles that may be the factors of this system failure : The commitment of top management; Lack of infrastructure support; Partial of the quality of management system; Knowledge of the Quality Management System; Culture of the organization; and the imperfection of the Quality Management System (Nasution, 2010).
Performance of the Contractor’s Company
Much of the actual work here depends not only on TQM principles (teamwork, employee involvement, scientific approach, obsession with quality, and customer focus), but also on common sense and organizing principles. The following are important elements to make sure that the “DO” part of the cycle has achieved: Finding out what has already been tried in the community, and how well it worked; Discovering whether there's any residual bad feeling attached to certain methods or approaches -- or people -- which may resurface if they're proposed again; Using as examples other communities that have successfully mounted similar programs, while remaining aware that not everything that works in one place will work in another; Consulting the research to see what has worked in this situation; Involving all stakeholders in the development of the program or initiative, especially the people who will do the actual work; and Taking care of the logistics: a place to operate, equipment and supplies, the proper staff and/or volunteers on board, etc. Check: Check the product to make sure it was produced in accordance with the plan. Compare the details and overall shape of the program or initiative to the plan. Does it align with the needs assessment? Does it look like it will address the desired outcomes in desired ways? Is it inclusive? Was everyone involved in its development? Is it feasible? Is it ready to go?. Act: Market the product. "Marketing the product" here means actually running the program or initiative that you've planned.
Infrastructure’s Project
A physical system that provides transportation, drainage, irrigation, building, and other public facilities, which is needed to fulfil various basic human needs both economic and social needs. (Grigg, 1988) Infrastructure itself consist of various physical facilities needed and developed by public agencies aimed at fulfilling social and economic objectives and governmental functions in terms of transportation, electric power, water supply, waste disposal, and other similar services (Stone, 1974).
Potrait of Contractors in Indonesia
According to the General Director of Construction, Ministry of PUPR Mr. Yusid Yosyib in 2016, construction service companies in Indonesia still facing great challenges in meeting the needs of the Government, one of the important things that highlights this challenge is human resources. Recently, Contractors companies in Indonesia also attentioning public with a bad portrait. It’s seen from the problems that showed up recently like the collapsed of retaining wall in Terminal 3 of Soekarno-Hatta Airport, the collapsed of Babat-Widang bridge in East of Java, and a lot of problems from the contractors quality management system.
III.RESEARCHMETHODOLOGY
constraints), 5 (Very Disagree: Not related at all) . Primary data taken from repondents that works for contractor’s company and should have 3 years experience. 39 data has obtained from the questionnaires distributed and 3 datas from the interview.
IV.ANALYSISANDDISCUSSION
Benefits from implementing ISO 9001 QMS within the point of view from contractor
To know whether implementing ISO 9001 has made a benefit in contractor’s company, an interview is used as the instrument. Interview was conducted to: 1) Mr. Robby as the President Director of PT RP; 2) Mr. Febrion as the Operational Director of PT RP; and 3) Mr. Eko as the Project Manager of PT HK. All of them stated and agreed that the implementation of ISO 9001 in their company has given a benefit. So that the analysis can be continues to find the indicators that affect the implementation of ISO 9001.
The Indicators that affect the implementation of ISO 9001
We knew that by implementing ISO 9001 in contractor’s company will give a benefit. To know what kind of benefit that the company can get and the obstacles that the company has experienced, the indicators that affect the implementation of ISO 9001 should be found. By doing the review of literature, found 3 indicators that affect. There are: The reasons for the company to implementing ISO 9001 in their company; how well the company has run the requirements on the ISO 9001:2015 regulations; and the obstacles in the implementation of ISO 9001 in the company. 12 variables has found from the reasons for the company to implementing ISO 9001 in their company indicator, 35 variables has found from how well the company has run the requirements on the ISO 9001:2015 regulations indicator; and 4 variables has found from the obstacles in the implementation of ISO 9001 in the company indicator.
Validity Test
All of the variables from the indicators tested by using the SPSS program to see which variables are valid and which one is not. This test compared the value of Pearson’s Correlation from the SPSS between all of the independent variables (X) with the dependent variable (Y). The variables taken are variables that have a Pearson’s Correlation >0.4 with the dependent variable (Y). The result showed that only 14 variables have the Pearson’s Correlation >0.4, there are: X8 ( Enable organizations to give stakeholders confidence for consistency, effectiveness, and efficiency); X12 ( Making the company more adaptable to change ); X13 (Manage all the relevant parties which have the competence and leadership of the quality management system); X14 (The organizations shall determine the external and internal issues that relevant to the organization’s objectives and direction that affect its ability to achieve the desired results of the quality management system); X15 (The organization shall establish the limits and application of the quality management system to determine its scope); X17 (Top level of management should demonstrate leadership and commitment to the quality management system); X18 (Top management must establish, implement, and maintain the quality policy); X20 (Ensure that the existing processes provide the desired output); X29 (The people doing the work should be aware of the contribution to the effectiveness of the quality management system, including the benefits of improved performance); X33 (Company should control the exeternal service providers and products when: products and services from external providers are intended to be incorporated into the organization’s products and services; products and services provided directly to customers by the provider); X34 (Control of production and service provision); X46 (The organization shall continually improve the suitability, adequacy, and effectiveness of the quality management system); X50 ( The knowledge level of the worker in quality management system is low); and X51 (The culture of the worker doesn’t support).
Intercorrelation Test
value of Pearson’s correlation, there are 6 variables valid for the factor & regression linear analysis, they are: X13 (Manage all the relevant parties which have the competence and leadership of the quality management system); X33 (Company should control the exeternal service providers and products when: products and services from external providers are intended to be incorporated into the organization’s products and services; products and services provided directly to customers by the provider); X34 (Control of production and service provision); X46 (The organization shall continually improve the suitability, adequacy, and effectiveness of the quality management system); X50 (The knowledge level of the worker in quality management system is low); and X51 (The culture of the worker doesn’t support).
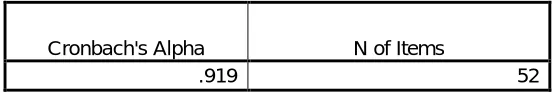
Reliability Test
Reliability test has been done with SPSS program to see is the questionnaire reliable or not. The test compared the cronbach alpha that gotten from the program which the value of cronbach alpha is >0.6 means that the questionnaire is reliable and if <0.6 the questionnaire is no reliable. From this analysis we’ve got the value of Cronbach’s Alpha is 0.919. It showed that the value 0.919 > 0.6, which means that the questionnaires is reliable.
Table 1: Reliability Test
Cronbach's Alpha N of Items
.919 52
Factor Analysis
All variables that has been analysed in validity test, intercorellation test, and reability test used in factor analysis and identified to make sure the variables that is relevant and from the factor analysis shown which components that the variables in. The relevancy of the variables tested by the correlation between the independent variables and partial correlation. The first assumption is Determinant of Correlation Matrix test, if the Determinant value is near of the 0 value means that the correlation between variables is high. In this analysis, the Determinant value is 0.005 which is near of 0 value. So, the variables are correlating highly.
The second assumption of the factor analysis is to compare the Kaiser-Meyer-Olkin Measure of Sampling Adequacy value should be > 0.5, the KMO value in this case is 0.726 which means that the requirements of this assumption is fulfilled.
Table 2: KMO and Bartlett’s Test
KMO and Bartlett's Test
Kaiser-Meyer-Olkin Measure of Sampling Adequacy. .726
Bartlett's Test of Sphericity
Approx. Chi-Square 187.463
df 15
Sig. .000
Third assumption of the factor analysis is testing the significance level from the Bartlett’s Test of Sphericity should be <0.05 which mean the assumption of the trust level is 95%. The value of significance in this analysis is 0.00 which means the requirement of the Bartlett’s Test is fulfilled.
eigenvalue > 1, means that from analysis factor showed that the variables will have 2 components. The 1st component consists of : X13 (Manage all the relevant parties which have the competence and leadership of the quality management system); X33 (Company should control the exeternal service providers and products when: products and services from external providers are intended to be incorporated into the organization’s products and services; products and services provided directly to customers by the provider); X34 (Control of production and service provision); X46 (The organization shall continually improve the suitability, adequacy, and effectiveness of the quality management system) and the 2nd component consists of: X50 (The knowledge level of the worker in quality management system is low) and X51 (The culture of the worker doesn’t support).
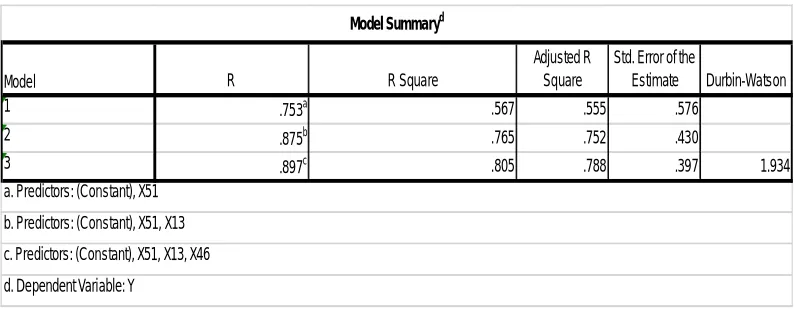
Linear Regression’s Analysis
Variables from the new components that obtained from the factor analysis tested with linear regression’s analysis to see how much is the correlation from the independent variables (X) with the dependent variable (Y). This test using the stepwise method. There are 4 tests that performed in this analysis, there are: R square test, F test, T test, and Durbin Watson’s Test). In R Square test, the value of correlation between the independent variables (X) with the dependent variable (Y) analysed to see how much the impact between the variables.
From the R Square test, shown that there are only 3 variables that give an impact to the contractor’s performance, there are: X13 (Manage all the relevant parties which have the competence and leadership of the quality management system) with the percentage of impact level = 56%; X46 (The organization shall continually improve the suitability, adequacy, and effectiveness of the quality management system) with the percentage of impact level =19.8%; and X51 (The culture of the worker doesn’t support) with the percentage of impact level = 4%. The total of the impact from all of the 3 variables against the contractor’s performance is 80.5%.
Table 2: Linear Regression’s Analysis – R Square
R R Square
Adjusted R Square
Std. Error of the
Estimate Durbin-Watson
1 .753a .567 .555 .576
2 .875b .765 .752 .430
3 .897c .805 .788 .397 1.934
d. Dependent Variable: Y
Model Summaryd
Model
a. Predictors: (Constant), X51
b. Predictors: (Constant), X51, X13
c. Predictors: (Constant), X51, X13, X46
The third test is T test. This test will comparing the value of T from SPSS analysis with the T value from the table, with the requirements: 1) T value from SPSS > F table shows that the independent variable partially has an effect to the dependent variable and 2) the significance level should lower than 0.05 to show that the level of significance is high. The T value from the table is 2.03693, then comparing it with the : 1st variable (X13) has a T value from SPSS = 4.03, 2nd variable (X46) has a T value from SPSS = 2.678, and 3rd variable (X51) has a T value from SPSS = 4.886. So, it showed that: X13 (Manage all the relevant parties which have the competence and leadership of the quality management system ) partially has an effect with Y (contractor’s performance); X46 (The organization shall continually improve the suitability, adequacy, and effectiveness of the quality management system) partially has an effect with Y (contractor’s performance); ); and X51 (The culture of the worker doesn’t support) partially has an effect with Y (contractor’s performance). All of the 3 variables has a level of significance < 0.05 so all of the 3 variables (X13,X46, and X51) has a high level of significance.
The last test is D test or Durbin Watson test. This test will shown if the variables has an autocorellation or not, with the requirements: (4-DW)>DU<DW. DL & DU value got from the D table, with the DL value = 1.1612 and DU = 1.8587. The DW value from the SPSS analysis is 1.934. So with the requirements, we got the equation = 2.1413>1.8587<1.934. So it show that there is no autocorrelation in this analysis.
V. CONCLUSION
By implementing ISO 9001 QMS in contractor’s company, will give an improvement to the company performance. The requirements from ISO 9001 that the company should do to get an improvement to the company performance are: manage all the relevant parties which have the competence and leadership of the quality management system and the organization shall continually improve the suitability, adequacy, and effectiveness of the quality management system. Other than that, the contractor’s company in West of Sumatra has an obstacle from implementing ISO 9001 QMS as the culture of the worker doesn’t support for implementing ISO 9001 QMS.
Improvements that the company can be done to maximize the benefits are: 1) The company should organize the competent parties in the field of Quality Management System that can give influence to all members of the company either from the top level of management or the lowest employees so that the Quality Management System can run well in the company. This can be done by starting from selection on the first interview of employees by HRD, choose objectively while determining the position of someone in the organization according to ability, cultivate a quality management system in all level of management by giving a training, briefing, and examples; 2) Organization must make continuous improvement to meet the suitability, adequacy, and effectiveness of quality management system such as conducting a good documentation system to facilitate discovery of the differences contained in enterprise quality management, creating better organizational structures so that enterprise management becomes better; and improving the quality of workers in Indonesia, strated from the background of family, education, and also the living environment. This things certainly can’t be separated from the responsibility of the government to make improvements in the culture of the country, both from the ministry of culture and education (KEMENDIKBUD), ministry of worker (KEMENAKER), ministry of religion (KEMENAG), ministry of human development and culture coordinator (KEMENKO PMK), and also ministry of public works and human settlements (KEMENPUPERA) to lead and conducting the construction workers so that they can have a culture of discipline and responsible. With all of these improvements expected the contractor’s company will have high competitiveness and the quality management system in the organization will getting better.
REFERENCES
1. Vincent Gaspersz, “Total Quality management”, PT Gramedia Pustaka Utama, 2001. 2. Logotheis N., “Managing for Total Quality”, UK: Prentice Hall International Ltd, 1992.
3. Caecillia Srimindarti, “Balanced Scorecard Sebagai Alternatif untuk Mengukur Kinerja, Fokus Ekonomi, Vol. 3 No. 1, 2004. 4. Menteri Pekerjaan Umum Republik Indonesia, “PerMen PU No: 04/PRT/M/2009”, 2009.
6. K. Sathis Raja & Mubeena M., “Assesesment of TQM in Construction Industry “, 2017.
7. Prof. Manjunathgouda & Prof. Supriya, “Assessment of Maturity Level of TQM in Construction Industry”, 2017. 8. Peter Hoonaker, “Barriers and benefits of Quality Management in the Construction Industry”, 2010.
9. Turgut Acikara, “Evaluations of Construction Project Participants Attitudes Toward Quality Management in Turkey”, 2017.
10. Vaughan Coffey, “Organizational Culture and Quality Management System Implementation in Indonesia Construction Companies”, 2016. 11. Made Arya, “Application of Quality Management System ISO 9001:2008 to Contractor”, 2013.
12. Suryo Nugroho, “Review of QMS Implementation on Housing Project Management”, 2012.
13. Yusuf Latief, “Critical factors in QMS for Profitability Optimization and Competitiveness of Construction Service Companies in Indonesia”, 2008.
14. Henny Yunita & Anton Soekiman, “User Satisfaction Level Analysis of Construction Services Against Implementation of Quality Management System ISO 9001 in Contractors Company”, 2016.