ABSTRACT
JIAO, SHIHUI. The Genetics of Feed Efficiency and Feeding Behavior in Pigs. (Under the direction of Dr. Christian Maltecca.)
The overall objective of this research was to study the genetics of feed efficiency and feeding behavior with the use of feed intake measures recorded by electronic feeding system. The first study aimed at determining if two alternative implementations (termed MI and MICE) of multiple imputation were more effective to adjust errors occurring in feed intake collected by electronic feeders than the well-established linear mixed model (LMM) approach. In our results, multiple imputation outperformed the LMM approach in all
simulated scenarios with mean accuracies of 96.71%, 93.45% and 90.24% obtained with MI and 96.84%, 94.42% and 90.13% with MICE, compared to 91.0%, 82.63% and 68.69% using LMM, for daily feed intake. In the second study we investigated measures of intake and growth, to determine the potential of genomic information in improving the efficiency of swine production. Magnitudes of heritability from pedigree analysis were moderate for growth, feed intake and ultrasound traits; heritability estimates were 0.32 ± 0.09 for FCR (feed conversion ratio) but only 0.10 ± 0.05 for RFI (residual feed intake). Comparatively, heritability estimates using marker information by Bayes-A models were about half of that from pedigree analysis, suggesting “missing heritability”. Moderate positive genetic
The Genetics of Feed Efficiency and Feeding Behavior in Pigs.
by Shihui Jiao
A thesis submitted to the Graduate Faculty of North Carolina State University
in partial fulfillment of the requirements for the degree of
Doctor of Philosophy
Animal Science and Poultry Science
Raleigh, North Carolina 2015
APPROVED BY:
________________________________ ________________________________
Dr. Christian Maltecca Dr. Joseph P. Cassady
Chair of Advisory Committee
________________________________ ________________________________
Dr. Todd See Dr. Mark Knauer
BIOGRAPHY
Shihui Jiao was born in Zhengding of city Shijiazhuang, Hebei Province, China in1986, to Jinhua Jiao and Zhengxia Wang. She grew up with a younger brother, Shigeng Jiao and a large family of relatives in the small town full of historical temples and towers.
The love for animals drove her to make the first big decision in her life: to take animal science as her major in the top ranking agricultural university in China. As a college student, she thoroughly enjoyed taking diverse subjects as an animal science major, such as biology, genetics, nutrition, chemistry, physiology, microbiology, and of course biostatistics.
ACKNOWLEDGMENTS
I would first like to acknowledge Dr. Christain Maltecca, as a great mentor and advisor, for taking me as a Ph.D. student and guiding me in my course studies and research at NC State University, especially his dedication to research and wisdom he has shared with me throughout the past 4 years.
I would also to thank my committee for their helps and inputs in my resarch. I enjoyed working with each member of the committee. I would also like to say a special thanks Dr. Joe Cassady for accepting me as a Ph.D. student at NC State, his professional, finantial and personal support during the first 3 years of my Ph.D. program, his willingness to be on my committee and for traveling so far for my final oral defense.
This work cannot be completed without the helps and supports from Dr. Kent Gray, Dr. Yijian Huang and all others in Smithfield Premimun Genetics. I would also like to take the chance to thank Dr. Kent Gray for offering me the opportunity to work at SPG as an student intern during the summer 2014.
A special thanks goes out to Dr. Gene Eisen and Dr. O. W. Robison for leading the genetics journal club and their willingness to share their wisdom and insigts in animal breeding, and also to my fellow graduate students and Dr. Francesco Tiezzi for many simulating discussions, many helps and many laughs.
TABLE OF CONTENTS
LIST OF TABLES ... x
LIST OF FIGURES ... xiii
ABBREVIATIONS ... xv
CHAPTER 1 Literature review ... 1
INTRODUCTION ... 2
Individual feed intake ... 3
Measures of feed efficiency ... 8
Selection for feed efficiency ... 10
Feeding behavior ... 13
Genomic evaluations of feed efficiency and feeding behavior ... 16
Genome-wide association study ... 23
CONCLUSION ... 26
Chapter 2 ... 27
Chapter 3 ... 27
Chapter 4 ... 28
Chapter 5 ... 28
Chapter 6 ... 29
LITERATURE CITED ... 30
CHAPTER 2 The use of multiple imputation for the accurate measurements of individual feed intake by electronic feeders ... 47
MATERIALS AND METHODS ... 50
Animal selection and dataset generation ... 50
Statistical analysis for error adjustment ... 53
Measuring method performance ... 57
RESULTS ... 57
DISCUSSIONS ... 59
CONCLUSIONS ... 62
LITERATURE CITED ... 63
CHAPTER 3 Feed intake, average daily gain, feed efficiency, and real-time ultrasound traits in Duroc Pigs: I. Genetic parameters estimation and accuracy of genomic prediction ... 79
INTRODUCTION ... 81
MATERIALS and METHODS ... 82
Animal and phenotype data collection ... 82
Statistical Analysis ... 83
RESULTS ... 89
Phenotype records editing and statistics ... 89
Genetic parameter estimation ... 90
Marker effects estimation and genomic prediction accuracy ... 91
DISCUSSIONS ... 92
Feed intake visit records from electronic feeders ... 92
Genomic prediction accuracy ... 96
CONCLUSIONS ... 97
LITERATURE CITED ... 98
CHAPTER 4 Feed intake, average daily gain, feed efficiency, and real-time ultrasound traits in Duroc Pigs: II. Genome-wide association. ... 114
INTRODUCTION ... 115
METERIALS and METHODS ... 116
Animal and phenotype data collection ... 116
Genotype data editing before GWAS ... 117
Statistical Analysis ... 117
RESULTS ... 123
Regions identified for feed efficiency traits ... 123
Regions identified for production traits ... 124
Effects of SNP and haplotypes associated with ADG, ADFI and BF ... 126
DISCUSSIONS ... 126
Genomic regions identified for feed efficiency traits and production traits ... 126
Significance tests and genomic regions associated with traits of interests ... 131
CONCLUSIONS ... 133
LITERATURE CITED ... 134
CHAPTER 5 Genetic analysis for different measures of feed efficiency and feeding behavior traits and the accuracy of genomic prediction using single-step method ... 166
MATERIALS and METHODS ... 168
Field data ... 168
Marker data ... 171
Dataset splits ... 172
Statistical Analysis ... 172
RESULTS ... 176
DISCUSSIONS ... 180
Measures of feed efficiency ... 180
Social interaction by modeling pen sharing by pen mates ... 185
Feeding behavior traits ... 186
Accuracy of genomic prediction ... 187
CONCLUSIONS ... 187
LITERATURE CITED ... 189
CHAPTER 6 Genome-wide association for different measures of feed efficiency and feeding behavior ... 209
INTRODUCTION ... 210
MATERIALS AND METHODS ... 212
Field data ... 212
Marker data ... 214
Statistical analysis ... 214
RESULTS ... 216
DISCUSSIONS ... 218
Genome-wide association for feeding behavior ... 220
CONCLUSIONS ... 221
LIST OF TABLES
Table 2.1 Types of errors in feed intake visits from FIRE and rate of error for each error type in full dataset from year 2004 to 2013. ... 69 Table 2.2 Error rates in simulated replicated datasets. ... 70 Table 2.3 Accuracies of adjusted daily feed intake (DFIa) with three different error adjustment
methods. ... 71 Table 2.4 Accuracies of adjusted average daily feed intake (ADFIa) with three different error
adjustment methods. ... 72 Table 3.1 Types of errors in FIRE (Feed Intake Recording Equipment) data, error rates, and
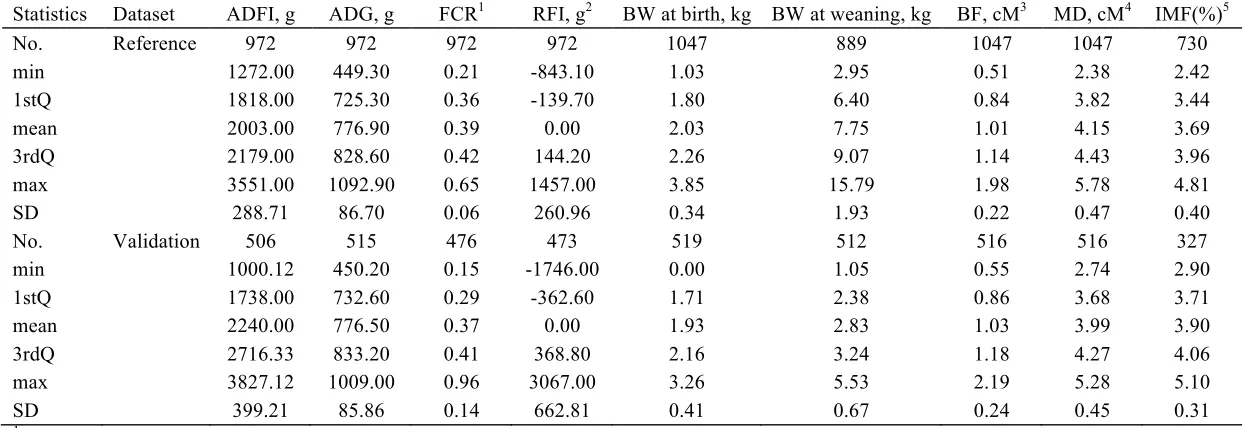
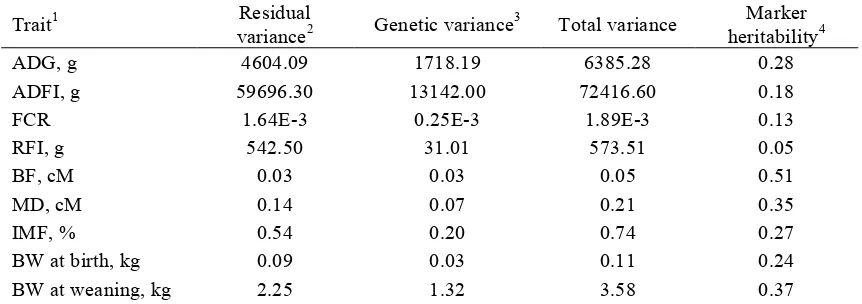
coefficients of errors from a linear mixed model for ADFI adjustment. ... 103 Table 3.2 Statistics for ADG1 estimates obtained from linear regression and robust regression. ... 104 Table 3.3 Descriptive statistics for nine traits analyzed in the reference and validation dataset. ... 105 Table 3.4 Estimates of variance components and heritability for traits by single-trait animal models.
... 106 Table 3.5 Genetic correlations between traits investigated using two-trait animal models. Covariance
estimates are shown above the diagonal and correlation estimates are shown below diagonal, SE of estimates presented in parentheses. ... 107 Table 3.6 Posterior means of variance explained by whole-genome markers for trait investigated. . 108 Table 4. 1 Top 5 genomic regions identified for feed efficiency traits by posterior distribution of
1-Mb window variances. ... 146 Table 4.2 Top 5 genomic regions identified for production traits by posterior distribution of 1-Mb
window variances. ... 148 Table 4.3 Number of significant 1-Mb windows identified by Bayes Factor (>3.1, 100 or 500) for
Table 4.4 Significant 1-Mb windows identified by bootstrapping analysis for traits investigated, using FDR < 10% and FDR < 5%. ... 150 Table 4.5 Summary of significant 1-Mb windows across 3 QTL inference strategies and potential
candidate genes. ... 151 Table 4.6 Substitution effects of minor allele for ALGA006684 (within 166-170Mb on SSC 1) for
ADFI, ADG and BF. ... 152 Table 4.7 Association of haplotypes of DNA segments with ADFI, ADG and BF, SNPs were located
within 166-170Mb on SSC 1. ... 153 Table 5.1 Different measures (1-6) of residual feed intake (RFI) in g………...195 Table 5.2 Descriptive statistics for feeding behavior measures, growth, feed efficiency and off-test
traits. ... 196 Table 5.3 Estimates of variance components and heritability (h2) for behavior, growth, efficiency and
off-test traits with pedigree information. ... 198 Table 5.4 Estimates of additive genetic correlation (SE) from two-trait animal model between feed
efficiency and other production traits with pedigree information. ... 200 Table 5.5 Estimates of additive genetic correlation1 from two-trait animal model between behavior
and other traits with pedigree information. ... 201 Table 5.6 Estimates of variance components and heritability (h2) for behavior, growth, efficiency and
off-test traits using single-trait animal model incorporated with pedigree and marker
information. ... 202 Table 5.7 Accuraciesof predictions for testing dataset (n = 506, pigs born in 2011 and 2012,
LIST OF FIGURES
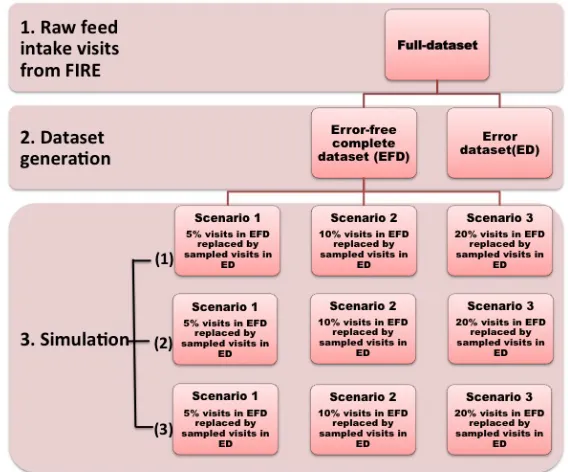
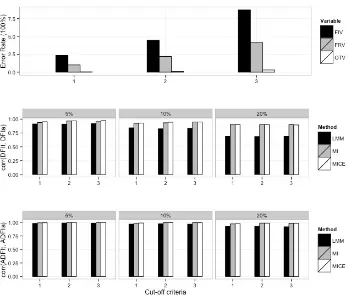
Figure 2.1 Working flow chart for data generation and simulation. ... 68 Figure 2.2 The impact of different cut-off criteria (for FIV-high, OTV-high and FRV-high) in full
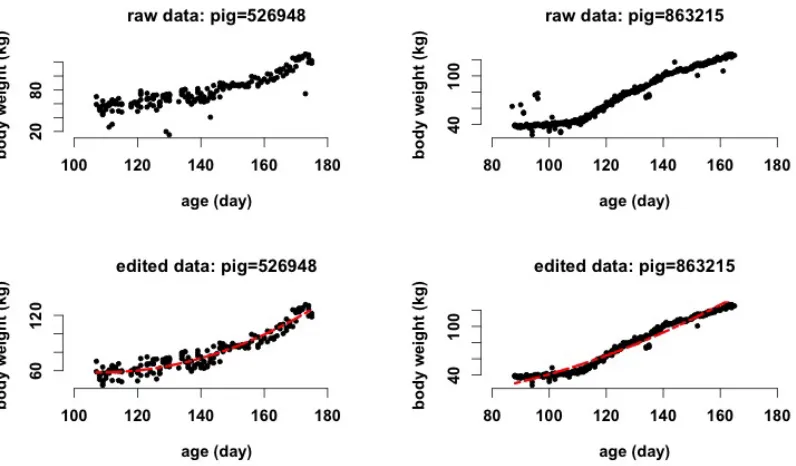
dataset on the performance of error-adjusting methods. ... 73 Figure 3.1 Serial pig body weights (kg) from FIRE (feed intake recording equipment) and predicted
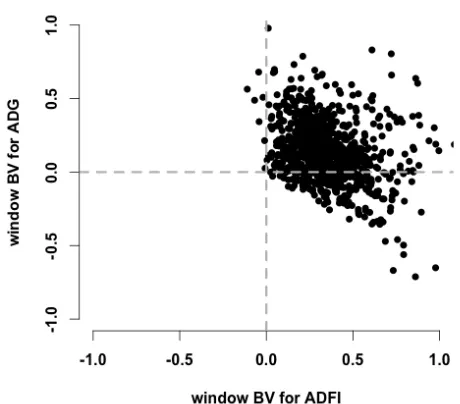
weights (kg) were plotted against age (d). ... 111 Figure 3.2 Window breeding values (BVs) for ADG and ADFI (from the result of Multivariate
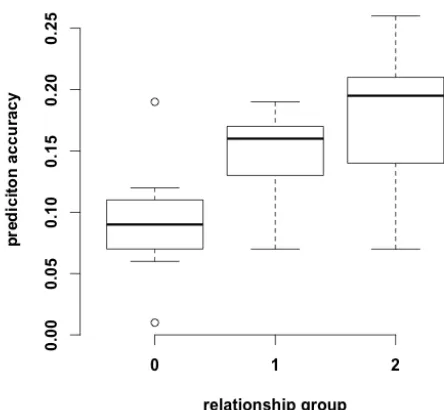
Bayes-A) were plotted. ... 112 Figure 3.3 Genomic prediction accuracies for the 9 traits investigated of different relationship
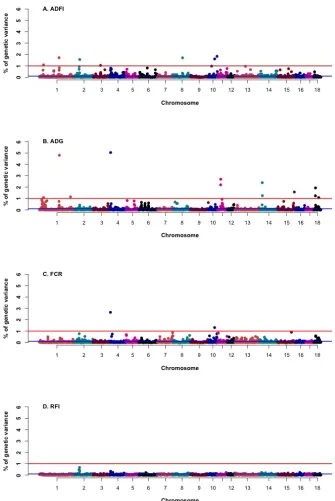
groups.. ... 113 Figure 4.1 Percentage of genetic variances explained by windows (in total, 2380 1-Mb windows from
autosome 1 to 18 of the swine genome) for feed efficiency traits from posterior distribution of window variances against chromosome positions.. ... 144 Figure 4.2 Cumulative proportion of genetic variance explained by 1-Mb windows (chromosome
segments in length of 1-Mb), ranked from most to least variation explained derived from posterior distribution of window variances for each trait. ... 145 Figure 4.3 Linkage disequilibrium plot of the region approximately range from 166 to 170 Mb on
SSC1, using r2 scores ... 147 Figure 4.4 Heat map of frequency of significant haplotypes and joint frequency of pair-wise
haplotypes. ... 154 Figure 5.1 The average relationship among pigs sharing the same pen as pen mates. ... 197 Figure 6.1 The Manhattan plots of average daily number of visits to feeders (ANVD), average
Figure 6.2 The Manhattan plots of measures of feed efficiency: residual feed intake (RFI), residual growth (RG) and residual feed intake and growth (RIG)……….………...…229 Figure 6.3 The Manhattan plots feeding behavior traits: average daily occupation time (AOTD),
average daily feeding rate (ADFR) and average feed intake per visit (FIV). ... 230 Figure 6.4 The gene network with candidate genes identified for feeding behavior traits. ... 235 Figure 6.5 The gene network with candidate genes identified for measures of feed efficiency. ... 236 Figure 6.6 The gene network with candidate genes identified for feeding behavior and measures of
ABBREVIATIONS ADFI: average daily feed intake
ADFIa: adjusted average daily feed intake ADG: average daily gain
AFIV: average feed intake per visit AFRD: average daily feeding rate AFRV: average feeding rate per visit ANVD: average number of visit per day AOTD: average daily occupation time AOTV: average occupation time per visit BF: ultrasound backfat thickness
BLUP: best linear unbiased prediction bp: base pairs
BV: breeding value BW: body weight
BW_Off: off-test body weight DFI: daily feed intake
FIRE: feed intake recording equipment (Osborne Industries, Inc., Osborne, Kansas, USA) FIV: feed intake per visit
FRV: feeding rate per visit
GBLUP: genomic best linear unbiased prediction GEBV: genomic estimated breeding value GS: genomic selection
GWAS: genome-wide association study HD: high-density
IBD: identical by decent IBS: identical by state
IMF: ultrasound intramuscular fat percentage
IOVG: individual feed intake recording in group housing () LASSO: least absolute shrinkage and selection operator LD: linkage disequilibrium
LMM: linear mixed model MAF: minor allele frequency MAS: Marker-assisted selection Mb: Mage base pairs
MD: ultrasound muscle depth
OTDe: daily occupation time in error visit OTV: occupation time per visit
RFI: residual feed intake RG: residual growth
RIG: combined measure of residual feed intake and residual growth SNP: single nucleotide polymorphism
SEP: standard error of prediction
SNPBLUP: single nucleotide polymorphism best linear unbiased prediction SSC: Sus scrofa chromosome
INTRODUCTION
The ultimate goal of most livestock industry is to improve profitability. In the past, this has been achieved effectively by the genetic improvement of the output traits (production traits) of economic importance, such as lean meat growth rate in pigs, milk yield in dairy cattle or egg production in poultry. Success has been witnessed in the past several decades in livestock production with an emphasis on selection for increasing production traits (Rauw et al., 1998). Since the profit is a function of both inputs and outputs, traits related to inputs of production such as feed efficiency traits have also long been recognized and received
substantial attentions especially by the swine and poultry industries, for which cost of feed is easier to quantify.
has been an abundance of data collected by electronic feeding systems, which have been used and continue to be used to understand the basic physiology and genetics of feed efficiency and feeding behavior. This information is advantageous for developing selection programs that can be targeted to improve the efficiency of feed utilization in swine herds.
Individual feed intake
Individual feed intake is difficult and expensive to measure. For several decades, pigs from nucleus herds have been evaluated for feed intake in central test stations, where the pigs were penned individually. However, pigs in commercial herds are normally housed in
groups. Potential problem of genotype x environment interaction have been found between nucleus and commercial herds (Merks, 1989), as pigs housed individually in central test stations eat more, grow faster, and are fatter than pigs housed in groups. This genotype x environment may hamper the selection since it is generally recommended that selection should be carried out under the environmental conditions in which the improved breed is destined to live in (Falconer, 1952) to achieve maximum response. To avoid this, efforts have been made to develop automatic feeding systems to collect individual feed intake on pigs housed in groups, with a single-space feeder equipped in each pen where pigs as pen mates share the same environment.
recording in group housing, Insentec B.V., Marknesse, the Netherland), while the electronic sow feeder (Nedap, Groenlo, the Netherlands) is normally utilized for sows. The design of these feeders is similar in principle (Maselyne et al., 2015). The pig visiting the feeder is identified, and then feed consumption and duration of feeding time are recorded. Take FIRE system as an example, each pen is equipped with a feeder that allows pigs access to feed 24 h per day, but only one pig in the pen can eat at each time because of a protective crate. When a pig enteres the feeder, weight of the feed eaten, pig ID, body weight of the pig, duration time of feeder visiting, and feeder number are recorded. The second advantage other than the ability to measure individual feed intake for group-housed pigs is that some behavior
measures can also be recorded (Maselyne et al., 2015; Maselyne et al., 2014). Additionally, traits are often measured over an entire test period, but electronic feeders measure each visit to the feeder so curves for the traits related to feed intake can be obtained. As a result, selection can be applied to curve parameters to change the shape of the curve (Schnyder et al., 2001; Schulze et al., 2002). More importantly, with the longitudinal measures recorded for feed intake, the underlying genetic mechanisms of the dynamics of feed intake and growth can be studied (Howard et al., 2015).
several recorded datasets ranged from 6% to up to 35% (Eissen et al., 1998; Casey, 2003; Jiao et al., 2014a). Secondly, one single-space feeder is normally placed in a pen in the performance testing nucleus herds whereas in commercial herds multiple-space feeder are normally employed, resulting in potential occurrence of genotype x environment. The single feeding space and the protection the feeder provides for the pig by the electronic feeding systems can change the feeding behavior compared to normal farm conditions with other type of feeders (Maselyne et al., 2015). From the results of the study by Nielsen et al. (1996), pigs visited the feeder much more frequently with shorter durations, eating significantly less per visit accessed to four-spaced feeder compared to pigs kept in the groups given access to a automatic single-space feeder. Lastly, the electronic feeding system is expensive, thus in order to maximize the use of the single-space feeder the number of pigs distributed in the same pen is also maximized. This could negatively impact the accuracy of feed intake measures (Brisbane, 2002; Eissen et al., 1999) and may cause social interactions among pen mates (Bergsma et al., 2008; Chen et al., 2010).
Automatic feeding systems are now used in genetic nucleus and research herds to improve or study traits related to feed intake. Although there are many benefits using these feeders as stated, the issues associated with those electronic feeding systems must be addressed in order to optimize the use of electronic feeders.
Previously reported error rates in feed intake collected by electronic feeders varied among different datasets. In a similar population of Duroc, Jiao et al. (2014a) found the overall error rates ranging between 14% and 35%. Eissen and colleagues (1998) reported error visits representing 6% of the total 385,329 feeding visits for 250 pigs. Similarly, Casey (2003) reported percentages of identified error visits of 4.33%, 5.62% and 18.74% for three different datasets with 863,590 total visits for 893 pigs, 290,073 total visits for 591 pigs and 162,638 visits for 237 pigs, respectively.
Due to the fact that simply deleting unreliable records would underestimate the true daily feed intake (Casey, 2003; Eissen et al., 1999), editing or adjustment methods have been established in order to obtain more accurate measures. A linear mixed model (LMM) has been proposed by Casey (2003) to adjust records containing errors after removing visits with missing values. This approach has proven especially useful when strategies that alternate the use of an electronic feeder between two pens of pigs every other week (Grignola et al., 2002) to maximize the number of pigs tested per feeder is employed. However, negative impacts using those strategies have been reported by several authors (Schulze et al., 2001; Von Felde et al., 1996), mainly due to stress in the tested pigs. In spite of this, accuracy of this
adjustment model were reported higher than the method used by Eissen et al. (1999).
However, applying LMM adjustments to a dataset with extreme values remains a challenging task since those values tend to severely bias the estimates (Osborne and Overbay, 2004).
processed to construct covariates associated with each error types before the actual mixed model application. And lastly, subjective constraints for daily feed intake or occupation time with errors need to be used to limit the bias arising from influential or extreme values in the estimation and prediction.
In order to utilize serials body weight measures collected using FIRE feeders to obtain growth rate, regression models established using robust regression have applied with better performance compared to least squares (Zumbach et al., 2010). Growth rate obtained by robust regression, have been used in genetic analyses by several authors such as Chen et al. (2010), Jiao et al. (2014a) and Howard et al. (2015).
Given that adjustment methods based on LMM are problematic, alternative editing methods are needed to best use the data collected by electronic feeding systems. Multiple imputation might be in this case a viable option. Multiple imputation was introduced by Rubin (1976), as a method with the very general task of ‘filling in’ missing values. This approach has gained increasing popularity and the past several decades have seen
implementations spanning many areas of statistical analysis (Rubin, 1996; Allison, 2002). The key concept of this technique is the use of the distribution of the observed data to estimate a set of plausible values for the missing data. Its generality and recent software development makes it a potentially advantageous approach in feed intake data edits since it treats errors as unobserved missing values. In contrast to LMM, multiple imputation is very general and can be easily implemented in a variety of settings with minimal data
Measures of feed efficiency
certain level of feed intake and production performance. Berry and Crowley (2012)
introduced RIG as a combined measure of residual feed intake and residual growth in order to combine both advantages of the two measures of efficiency. They defined RIG as the difference of residual growth and residual feed intake, both scaled to mean 0 and standard deviation 1 to remove the potential calling problems.
The two most common measures of feed efficiency are FCR and RFI, while RG and RIG are seldom used as efficiency measures in swine research (MacNeil and Kanp, 2015) albeit they have been employed both in poultry (Willems et al., 2013) and beef cattle (Crowley et al., 2010). Residual feed intake is commonly used as standard measure of feed efficiency at a given level of production, so that the predicted feed intake can be defined by different sets of production traits, as suggested by several authors (Johnson et al., 1999; Hoque et al., 2009; Do et al., 2013). However, the relationships between feed efficiency with other traits may not consistent across different of stages of maturity (Archer et al., 2002) or different populations or breeds (Do et al., 2013).
The two commonly used measure of feed efficiency FCR and RFI suffer from several problem. For example, FCR (or Feed : Gain ratio) has a close correlation with both feed intake and rate of gain (Carstens et al., 2003); this may lead to animals with heavier mature weights and greater maintenance requirements as animals with similar FCR may differ greatly in their rate of gain and feed intake (Smith et al., 2010). Additionally selection based on ratio traits may result in different response in the component traits and cannot be
study carried out by Campo and Turrado (1998) RFI was employed as trait to decrease the FCR and was shown to be better than direct selection on the ratio in chicken. Nonetheless, residual feed intake (RFI) is still genetically correlated with the production traits (Kennedy et al., 1993). Additionally, this trait may lack acceptance by producers because slow growing animals eating relatively less of feed may actually have good RFI. Crowley et al. (2010) and Berry and Crowley (2012) argued that RG and RIG may be better measures of feed
efficiency because improved RG is associated with faster growth rate on average, given same level of feed intake and RIG by combining RFI and RG measures should be able to retain advantages of both. Indications exist that RG and RIG might be two good measures of efficiency and feed utilization in beef cattle (Crowley et al., 2010) and turkey (Willems et al., 2013). However the genetics of the two traits, the genetics relationships between these and other traits in pigs remain to be determined.
Assessing various measures of feed efficiency in pigs may shed lights on how to choose a particular useful feed efficiency measure in the future selection program. The genetics of different measures of feed efficiency and interrelationships with other important economic traits may provide new information and new understanding of the various
measures.
Selection for feed efficiency
pigs (Rauw et al., 1998; Lonergan et al., 2001), resulting in reduced pork quality and increased reproduction and health problems. On the other hand, only approximately 65% of phenotypic variation in feed intake can be accounted for by growth rate and other
performance traits, such as backfat thickness or muscle depth (Cai et al., 2008). The
remaining phenotypic differences can be evaluated by feed efficiency (as based on different definitions). As leanness approaches optimum levels, direct selection for feed efficiency can create more incentives for producers in swine production, in which case individual feed intake is needed on a large number of animals in the breeding population.
reported in pigs. However, Willems et al. (2013) reported the estimates of RG and RIG in turkey were 0.19 and 0.23 and Crowley et al. (2010) found that RG was moderately heritable in beef cattle.
Genetic correlations between FCR and RFI and other production traits have been reported in different breeds/populations. Genetic correlations with RFI and growth rate have been generally small. Hoque et al. (2008) reported genetic correlation between daily gain (DG) and RFI of -0.05, DG and FCR of -0.22 and FCR and RFI of 0.95. Negative
correlations (-0.37 and -0.54) have been also found in two feeding regimes between average daily gain (ADG) and FCR by Schulze et al. (2001). However, Mrode and Kennedy (1993) found weak positive genetic correlation between growth measures and RFI, ranging from -0.18 to -0.34. Genetic correlation between efficiency and backfat has been show to be low when residual feed intake is adjusted for backfat (-0.15) but intermediate when adjusted for average daily gain (-0.34), and high when adjusted for lean growth (-0.61) in a study from Mrode and Kennedy (1993). Do et al. (2013) reported moderate to negligible genetic correlation between FCR and BF (-0.36 and -0.03) in Danish Duroc and Yorkshire population but not in Landrace where a moderate genetic correlation between FCR and growth (-0.38 and -0.31) was found in Danish Duroc and Yorkshire and of opposite direction in Danish Landrace (0.26).
(de Vries and Kanis, 1992). Cai et al. (2008) reported how selection for reduced RFI significantly decreased the feed requirement in pigs at a given rate of growth and backfat thickness in comparison to a random control line in a 5-generation selection experiment in Yorkshire pigs. Another divergent selection experiment against high RFI in Large White pigs found higher carcass percentage and weight of loin in low RFI line whereas the line
divergence in growth, body weight and backfat thickness was close to zero after 3 generation of divergent selection for RFI (Gilbert et al., 2006).
Feeding behavior
Phenotypes of feeding behavior have been studied in the past, focusing on the mechanisms of free feeding (Young and Lawrence, 1994) in pigs and the relationship between feeding behavior and growth or feed intake. Analysis of feeding behavior were mainly concentrated on testing hypothesis of controlling food or diet selection, including the roles of hunger and satisfaction (Tolkamp et al., 2002), on predicting illness (Cornou et al., 2008; Sowell et al., 1998), or on identifying certain behavior traits for incorporation into selection index (Rauw et al., 2006; Do et al., 2013) in order to get indirect selection response on feed efficiency.
of each feeding visit and the body weight of the animal. One potential problem with the use of electronic feeders is that to maximize the usage of feeder, one single-space electronic feeder often is equipped in a pen with a large group of pigs. This may introduce social interactions like competition or cooperation among pigs sharing the same pen. Social interactions among pen mates have been reported by several authors in feed intake and growth of pigs (Arango et al., 2005; Bergsma et al., 2008; Chen et al., 2010) and in feed consumption of dairy cattle (Huzzey et al., 2014).
The relationship between feeding behavior (summarized from feeding events) and feed efficiency has been investigated in previous publications (Do et al., 2013; Rauw et al., 2006; Rohrer et al., 2013; von Felde et al., 1996; Haer et al., 1993; Labroue et al., 1997), but limited research has been done on the relationships between behavior measures and different measures of feed efficiency, especially when social interaction is considered.
Little was known regarding the genetics of behavior traits and the relationship with other economically important traits in large populations. This lack of information might reflect the fact that collecting individual feed intake is expensive. Feeding behavior traits have been found to be moderate to high heritable. Do et al. (2013) reported that heritabilities of six feeding behavior traits were all moderate to high and consistent across Danish Duroc, Yorkshire and Landrace breeds. Similar results have been seen in other studies (Rauw et al., 2006; Labraue et al., 1997). However, Rohrer et al. (2013) found the estimates of heritability for feeding behavior traits were variable (ranging from 0.16 to 0.60) in a pedigreed
Landarace-Yorkshire-Duroc composite population. Is should be noted though that in that case a small number of animals were measured (n = 1162). Some of the feeding behavior measures have been shown to be strongly genetically correlated with growth and feed efficiency traits, although the strength of the correlations depends on breeds and population (Do et al., 2013; Rauw et al., 2006; Labraue et al., 1997).
2015; Maselyne et al., 2014). Those devices would be less costly and easier to maintain than electronic feeding systems (Brown-Brandl et al., 2013).
Genomic evaluations of feed efficiency and feeding behavior
Nearly all traits of great economic importance in domestic animals are for the most part quantitative and complex in nature, such as milk yield in dairy cattle, growth rate in pigs and egg production in chicken (Falconer and Mackay, 1996). The classical model of
intake is still a character expensive to measure, thus traditional selection for feed efficiency becomes less efficient.
In the recent past, researcher have tried to identify genes or quantitative trait loci (QTL) on the constructed linkage maps of major livestock, after the discovery of a few number of genes of very large effect, such as the effect of the gene affecting halothane sensitivity in pigs (Lundstrom et al., 1995). Between the end of the 20th and beginning of 21th century, thousand of QTL have been located in pigs, associated with economically important traits such as growth rate, leanness, feed intake, meat quality and disease resistance
(Rothschild et al., 2007; Ernst et al., 2013). Although a lot of effort has been dedicated to mapping QTL in livestock (Rothschild et al., 2007), the discovery of the underlying mutations affecting certain traits and implementation of discovered QTL through marker assistant selection (MAS) has been limited (Dekkers, 2004) because of rare replication of QTL studies, the limited variation explained by the identified QTL, and difficulty in determining economic weight for a single marker.
The discovery of a many thousands, and even millions of single-nucleotide polymorphisms (SNP) has greatly improved our ability to use information on DNA
mutations controlling the phenotype of interest. The availability of these dense marker information, provide us more room to investigate the underlying genetic architectures of traits of interests and the ability to conduct genome-wide selection (Meuwissen, 2007).
The landmark paper from Meuwissen et al. (2001) marks the start of the genomic selection (GS) era. After this publication, there has been a rapid development of genomic selection tools and genomic selection to implement GS in animal breeding programs of various species, including dairy, beef, pig, layer chicken, etc (Meuwissen et al., 2013; Hayes et al., 2009; van Eenennaam et al., 2013; Wolc et al., 2012). In contrast to traditional
selection (BLUP), GS relies on a large number of individual in a genotyped and phenotyped training population from which a genomic prediction equation is derived that can then be used to estimate the genomic estimated breeding value (GEBV) of unphenotyped individuals as a selection candidate based solely on their marker genotypes. Thus, GS is more efficient for traits that are sex specific, measured late in life, expensive to measure, or have a low heritability. The use of GS has been fully applied to dairy industry (VanRaden et al., 2008) and is implemented to beef (Garrick, 2011), swine (Abell et al., 2014) and poultry (Wolc et al., 2012) industries.
Unlike dairy industry, implementing the genomic selection tool is hindered by the ratio of the value of an individual to the cost of its genotyping in other species including pigs (Abell et al., 2014; Habier et al., 2009). To reduce genotyping costs low-density genotyping strategies have been implemented (Huang et al., 2012; Habier et al., 2009; Cleveland and Hickey, 2013).
values. A direct method to incorporate genomic information into the traditional BLUP framework is to replace the numerator relationship matrix (A matrix) with a realized or genomic relationship matrix (G matrix) (VanRaden, 2008), termed GBLUP. The A matrix is based on the expected additive variance-covariance relationship matrix based on the
pedigree, which is twice the coancestry between individuals. The coancestry or coefficient of kinship is the probability that the alleles/genes carried by the two individuals descend from the same ancestor (IBD) (Nejati-Javaremi et al., 1997). The expected relationship does not account for Mendelian sampling, thus full siblings are assumed to have the same relationship with their parents. Additionally, the founders of a pedigree are assumed to be unrelated with zero inbreeding. In contrast, the G matrix is derived from alleles being identical by state (IBS), thus estimating the realized proportion of the genome that two individuals share including the base animals (Goddard et al., 2011; Hayes et al., 2009). The G matrix picks up distance relationships prior to recording of the pedigree and Mendelian sampling is
accounted for, which allows for variation in progeny genotypes to be determined, in particular full or half siblings (Nejati-Javaremi et al., 1997). In field study, the GBLUP approach is attractive because the implementation is straightforward using existing BLUP routines and small computation demands (VanRaden et al., 2008).
implementation (SNPBLUP) all markers are fitted so that each has the same variance. Habier et al. (2007) and VanRaden (2008) noticed that the this model and GBLUP model are
equivalent. The SNPBLUP model makes the assumption that all SNP effects are independent and identically distributed, coming from the same normal distribution with small variance. Thus the SNP effects estimated from the model is typically very small and are very sensitive to the prior. Furthermore, SNP effects are normally distributed with constant variance may be unrealistic: some SNP in LD with causal mutations may capture the QTL effects thus have large effects while other SNP may have no effects. Therefore, various genomic prediction models have been developed with different prior assumptions for SNP effects (Meuwissen et al., 2001; Habier et al., 2010; Tibshirani, 1996, Whittaker et al., 2002, Park and Casella, 2008) and those approaches have been called the Bayesian alphabets (Gianola et al., 2009). In the BayesA model, the SNP effects are assumed to have a t distribution (Meuwissen et al., 2001). This allows some SNP to have larger effects than they do under an assumption of normality, because a t-distribution has fatter tails than a normal distribution. In the BayesB model (Meuwissen et al., 2001), a fraction (p) of the SNPs is assumed to have no effect, and a fraction (1 - p) has an effect drawn from a t-distribution. BayesC (Habier et al., 2011) is similar to BayesB except that the SNPs with an effect are assumed to have a normally distributed effect instead of t-distribution. BayesC is computationally simpler to solve than BayesB and yields almost similar accuracies. BayesR is an extension of BayesC with multiple normal distributions, which allows good prediction under a range of genetic
double-exponential distribution (also called the Laplace distribution), which result in Bayesian least absolute angle and selection operator (Bayesian LASSO) (Park and Casella, 2008). de los Campos et al. (2009) further extended Bayesian LASSO to accommodate pedigree in formation as well as covariates other than markers. In summary, the main difference between the methods is their prior distributions and their assumptions about the distribution of marker effects. de Los Campos et al. (2013) reviewed the relationships among the Bayesian models and some models can be considered special case or limiting case of others.
The various models (GBLUP, BayesA, B, C, R and Bayesian LASSO) have been compared with simulation and real data analysis. In general, the method with assumptions about the distributions of SNP effects that most closely agree with the true distribution gives the highest accuracy of GEBVs (Meuwissen et al., 2014). Higher prediction accuracy often observed when SNP effects have prior distributions with spike at 0 than distributed with equal variance, however, GBLUP yield similar accuracy in real data analysis (Hayes et al., 2009; Meuwissen et al., 2014).
covariances among all ungenotyped individuals. This extension of genomic relationship matrix as combination of A and G matrix can be used in BLUP procedure, and is generally termed single-step genomic BLUP (ssGBLUP). Single-step GBLUP (or ssGBLUP) has been used widely in different species for routinely genetic evaluations (Misztal et al., 2013) with its advantages being easy implementation and the use of standard BLUP routines with genotyped or non-genotyped animals. The increased accuracies of predictions by using ssGBLUP incorporated with genotypes over pedigree-based BLUP have also been reported by Christensen et al. (2012) for growth and feed intake and by Forni et al. (2011) for sow litter size in analyses using swine data. Similar conclusion has also seen from Guo et al. (2015) in genomic evaluation of litter size and piglet mortality in Danish pigs using ssGBLUP.
Genome-wide association study
The accuracy of prediction for future phenotypes or genetic merit using high-density SNP makers also depends on the genetic architecture of the trait of interest (Hayes et al., 2010). With more dense genomic information, the genetic architecture of a trait can be better understood, such as the number of genes/loci that affect a trait and the additive effects of individual genes/loci. Identifying genes for complex traits would greatly enhance our
understanding of the traits. For livestock, there would be a practical benefit in locating genes causing the phenotypes to further facilitate breeding and selection (Hayes and Goddard, 2010).
Genome-wide association study also known as LD mapping is used to identify trait-marker association relationships based on linkage disequilibrium (LD). The association study needs both phenotypes and genotypes of a sample of animals. Since most of traits of
al., 2006; Wakefield et al., 2007; Hosking et al., 2008; Fridley et al., 2009; Wakefield et al., 2008). Benefits of exploring Bayesian models in the contexts of genome-wide association studies were reviewed thoroughly by Stephens and Balding (2009): Bayesian approach considers the background knowledge of relationship between genotype and phenotypes (biological information); incorporates uncertainty in the model (flexibility of the model) and results in probability statement about the parameters; allows variable and model selection in a natural way.
Identifying genes or markers in domestic animals for quantitative traits with
appropriate measure of evidence compared to Bayes factor based on Bayesian contexts. Oppose to parametric methods, permutation and bootstrapping use data itself to obtain empirical estimate of the maximal distribution. Both permutation and bootstrapping methods proceed by resampling data under the null hypothesis (Nichols and Hayasaka, 2003).
Success in genome wide association study also relies on the ability to account for population structures (Pritchard, 2000) as failure to do so can cause spurious associations (false positives) in the genome wide association study. Population structure can strongly influence patterns of LD within a genome. Unlike human population, in livestock population structure can be created by multiple offspring per sire, selection for specific breeding goals and breeds or strains within the population, population mating patterns and admixture (Falconer and Mackay, 1996). Consequently, the highly structure nature of livestock population can reduce the number of animals used to conduct association mapping since relative information can be used in addition to its own records (Hayes and Goddard, 2010). As another advantage in contrast to human, there is no need to use SNP panels as dense as human’s to conduct association mappings using samples from one breed in those livestock species. However, on the other hand, a long extent of LD may be problematic for fine mapping of a QTL, because association may be detected at a distance far from the causative locus (Hayes and Goddard, 2010).
including a few studies tried to locate the genes for feed efficiency in pigs. Onteru et al. (2010) reported genomic regions containing insulin release genes (eg., GLP1R, CDKAL, SGMS1) with RFI and ADFI. Later on, a total of 79 significant SNP associations with FCR in pigs on 6 chromosomes were identified in Denmark Duroc pigs, of which 10 SNP reach the genome-wide significance threshold on SSC 4 and 14 (Sahana et al., 2013). Noval regions affecting two different measures of RFI were reported in a genome-wide association study in Danish Duroc pigs on chromosome 1, 8, 9, 13 and 18 and indicated the candidate genes in those genomic regions involve in biological processes and metabolic pathways (Do et al., 2014a), while the gene detection in Yorkshire boars revealed different regions (Do et al., 2014b). The results reported by Do et al. (2014a, 2014b) may indicate that the genomic regions influencing feed efficiency in different breeds were slightly different and it is interesting to see if those genes were functioned in the same pathways. Little is known for the underlying genetic architecture of feeding behavior in pigs. The only association study conducted by Do et al. (2013) reported several genomic regions on SSC 1, 8, 11, and 12 associated with several feeding behavior measures.
CONCLUSION
incorporate feed efficiency in the breeding program yet. Data collected by electronic feeding system has long known to contain errors and new method need to be established to better utilize those data with higher accuracy. Feeding behavior may be good indicator traits for feed efficiency because they are much more easier to collect with less equipment, but still need further investigations. The availability of dense SNP marker information has greatly facilitate identifying the underlying genes influencing feed efficiency and feeding behavior traits and genomic selection seems promising as increased accuracy of genomic selection has been reported for other traits in pigs and important production traits in other species.
The subsequent 5 chapters will address those questions through the following objectives;
Chapter 2
Obtaining accurate individual feed intake records is the key first step in achieving genetic progress toward a more efficient pig in nutrient utilization. Feed intake records collected by electronic feeding systems contain errors (extreme values or outliers exceeding certain cut-off criterions), which are due to feeder malfunction or animal feeder interaction. The objective of this study was therefore to evaluate the performance of two alternative implementations of multiple imputation, denoted as MI and MICE, in replacing errors and missing observations occurring in feed intake data, compared with the well-established LMM approach, under different simulated scenarios.
Chapter 3
marker-assisted or genomic selection. This project aimed at identifying genomic regions associated with feed efficiency and production traits. As part of the work, the objectives of this chapter were (1) to explore heritabilities and genetic correlations for ADFI, ADG, feed efficiency traits (FCR and RFI), ultrasound traits (BF, MD and IMF), BW at birth and weaning, using either pedigree or marker information; and (2) to access accuracy of genomic prediction of the nine traits in a Duroc terminal sire population.
Chapter 4
With more dense genomic information, the genetic architecture of a trait can be better understood, such as the number of genes/loci that affect a trait and the additive effects of individual genes/loci. The objective of this study was to identify genomic regions associated with variations in feed intake, average daily gain, the two commonly used feed efficiency measures (feed conversion ratio and residual feed intake) and real-time ultrasound traits in a Duroc terminal sire population.
Chapter 5
The present chapter had three objectives. The first was to estimate genetic parameters for different measures of feed efficiency and other traits (including growth, off-test
measurements and feeding behavior traits) with pedigree or marker information. The second objective was to quantify the effect of social interaction among pen mates for traits collected using FIRE system. The last objective was to compare the accuracy of prediction for all those traits of interests using traditional BLUP or single-step genomic BLUP (ssGBLUP)
Chapter 6
LITERATURE CITED
Abell, C. E., J. C. M. Dekkers, M. F. Rothschild, J. W. Mabry, and K. J. Stalder. 2014. Total cost estimation for implementing genome-enabled selection in a multi-level swine production system. Genet. Sel. Evol. 46(1):32.
Allison, P. D. 2002. Missing data: Quantitative applications in the social sciences. Br. J. Math. Stat. Psychol. 55:193-196.
Arango J., I. Misztal, S. Tsuruta, M. Culbertson, and W. Herring. 2005. Estimation of variance components including competitive effects of Large White growing gilts. J. Anim. Sci. 83:1241-1246.
Archer, J. A., P. F. Arthur, R. M. Herd, P. F. Parnell, and W. S. Pitchford. 1997. Optimum postweaning test for measurement of growth rate, feed intake and feed efficiency in British breed cattle. J. Anim. Sci. 75:2024–2032.
Arthur, P. F., and R. M. Herd. 2005. Efficiency of feed utilisation by livestock-Implications and benefits of genetic improvement. Can. J. Anim. Sci. 85(3):281-290.
Balding, D. J. 2006. A tutorial on statistical methods for population association studies. Nat. Rev. Genet. 7:781-791.
Bergsma, R., E. Kanis, E. F. Knol, P. Bijma. 2008. The contribution of social effects to heritable variation in finishing traits of domestic pigs (Sus scrofa). Genet.178:1559-1570.
Bernard C., and M. H. Fahmy. 1970. Effect of selection on feed utilization and carcass score in swine. Canadian J. Anim. Sci. 50(3): 575-584.
Brisbane, J. R. 2002. Prediction of within-herd differences in total feed intake between growing pigs. Can. J. Anim. Sci. 82:283-293.
Brown-Brandl, T.M., G. A. Rohrer, and R. A. Eigenberg. 2013. Analysis of feeding behavior of group housed growing-finishing pigs. Comput. Electron. Agric. 96:246-252. Cai, W., D. S. Casey, and J. C. M. Dekkers. 2008. Selection response and genetic parameters
for residual feed intake in Yorkshire swine. J. Anim. Sci. 86:287-298.
Cameron, N. D., and M. K. Curran. 1994. Selection for components of efficient lean growth rate in pigs 4. Genetic and phenotypic parameter estimates and correlated responses in performance test traits with ad-libitum feeding. Anim. Prod. 59: 281-291
Carstens, G. E., C. M. Theis, M. D. White, T. H. Jr. Welsh, B. G. Warrington, R. D. Randel, T. D. A. Forbes, H. Lippke, L. W. Greene and D. K. Lunt. 2002. Residual feed intake in beef steers: I. Correlations with performance traits and ultrasound measures of body composition. J. Anim. Sci. 80 (Suppl. 2): 135.
Chen, C. Y., I. Misztal, S. Tsuruta, B. Zumbach, W. O. Herring, J. Holl, and M. Culbertson. 2010. Estimation of genetic parameters of feed intake and daily gain in Durocs using data from electronic swine feeders. J. Anim. Breed. Genet. 127:230-234.
Casey, D. S. 2003. The use of electronic feeders in genetic improvement programs for swine. PhD Diss. Iowa State Univer., Ames.
associated with errors in data from electronic swine feeders. J. Anim. Sci. 83:969-982.
Christensen, O. F. and M. S. Lund. 2010. Genomic prediction when some animals are not genotyped. Gen. Sel. Evol. 42:2.
Christensen, O. F. P. Madsen, B. Nielsen, T. Ostersen, and G. Su. 2012. Single-step methods for genomic evaluation in pigs. Animal. 6:10:1565-1571.
Cleveland, E. R., R. K. Johnson, R. W. Mandigo, and E. R. Peo, Jr. 1983. Index selection and feed intake restriction in swine. II. Effect on energy utilization. J. Anim. Sci. 56:570-578.
Cleveland, M. A., and J. M. Hickey. 2013. Practical implementation of cost-effective
genomic selection in commercial pig breeding using imputation. J. Anim. Sci. 91(8): 3583-3592.
Crowley, J. J., M. McGee, D. A. Kenny, D. H. Crews, R. D. Evans, and D. P. Berry. 2010. Phenotypic and genetic parameters for different measures of feed efficiency in different breeds of Irish performance-tested beef bulls. J. Anim. Sci. 88(3):885-894.
Daetwyler, H. D., R. Pong-Wong, B. Villanueva, and J. A. Woolliams. 2010. The impact of genetic architecture on genome-wide evaluation methods. Genetics. 185:1021-1031. De Haer, L. C. M., J. W. M. Merks, H. G. Kooper, G. A. J. Buiting, and J. A. van Hattum.
de los Campos, G., H. Naya, D. Gianola, J. Crossa, A. Legarra, E. Manfredi, K. Weigel, and J. M. Cotes. 2009. Predicting quantitative traits with regression models for dense molecular markers and pedigree. Genet. 182(1):375-385.
de los Campos, G., J. M. Hickey, R. Pong-Wong, H. D. Daetwyler, and M. P. L. Calus. 2013. Whole-genome regression and prediction methods applied to plant and animal
breeding. Genetics. 193:327-345.
Dekkers, J. C. M. and F. Hospital. 2002. The use of molecular genetics in the improvement of agricultural populations. Nat. Rev. Genet. 3:22-32.
Dekkers, J. C. M. 2004. Commercial application of marker- and gene-assisted selection in livestock: Strategies and lessons. J. Anim. Sci. 82:E313-E328.
Dekkers, J. C. M. 2012. Application of genomic tools to animal breeding. Current Genomics. 13:207-212.
De Vries, A. G., R. Kerr, B. Tier, and T. Long. 1994. Gametic imprinting effects on rate and composition of pig growth. Theo. Appl. Genet. 88 (8):1037-1042.
Do, D. N., A. B. Strathe, J. Jensen, T. Mark, and H. N. Kadarmideen. 2013a. Genetic
parameters for different measures of feed efficiency and related traits in boars of three pig breeds. J. Anim. Sci. 91(9):4069-4079.
Do, D. N., A. B. Strathe, T. Ostersen, J. Jensen, T. Mark, and H. N. Kadarmideen. 2013b. Genome-wide association study reveals genetic architecture of eating behavior in pigs and its implications for humans obesity by comparative mapping. Plos
Do, D. N., A. B. Strathe, T. Ostersen, S. D. Pant, and H. N. Kadarmideen. 2014a. Genome-wide association and pathway analysis of feed efficiency in pigs reveal candidate genes and pathways for residual feed intake. Front. Genet. 5:307.
Do, D. N., T. Ostersen, A. B. Strathe, T. Mark, J. Jensen, and H. N. Kadarmideen. 2014b. Genome-wide association and systems genetic analyses of residual feed intake, daily feed consumption, backfat and weight gain in pigs. BMC Genet. 15(1): 27.
Eissen, J. J., E. Kanis, and J. W. M. Merks. 1998. Algorithms for identifying errors in individual feed intake data of growing pigs in group-housing. Appl. Eng. Agric. 14:667-673.
Eissen, J. J., A. G. De Haan, and E. Kanis. 1999. Effect of missing data on the estimate of average daily feed intake of growing pigs. J. Anim. Sci. 77(6):1372-1378.
Erbe, M., B. J. Hayes, L. K. Matukumalli, S. Goswami, P. J. Bowman, C. M. Reich, B. A. Mason, and M. E. Goddard. 2012. Improving accuracy of genomic predictions within and between dairy cattle breeds with imputed high-density single nucleotide
polymorphism panels. J. Dairy Sci. 95:4114-29.
Ernst, C. W. and J. P. Steibel. 2013. Molecular advances in QTL discovery and application in pig breeding. Trends Genet. 29:215-225.
Falconer, D. S. 1952. The problem of environment and selection. Am. Naturalist. 86: 293-298.
Fan, B., S. Lkhagvadorj, W. Cai, J. Young, R. M. Smith, J. C. M. Dekkers, E. Huff-Lonergan, S. M. Huff-Lonergan, and M. F. Rothschild. 2010. Identification of genetic markers associated with residual feed intake and meat quality traits in the pig. Meat Sci. 84:645-650.
Fisher, R. A. 1918. The correlation between relatives on the supposition of Mendilian inheritance. Trans. Roy. Soc. Edinburgh 52:399-433.
Forni, S., I. Aguilar, and I. Misztal. 2011. Different genomic relationship matrices for single-step analysis using phenotypic, pedigree and genomic information. Genet. Sel. Evol. 43:1.
Garrick, D. J. 2011. The nature, scope and impact of genomic prediction in beef cattle in the United States. Genet. Sel. Evol, 43(17):10-1186.
Garrick, D. J. 2011. The nature, scope and impact of genomic prediction in beef cattle in the United States. Genet. Sel. Evol, 43(17):10-1186.
Gianola, D., G. de los Campos, W. G. Hill, E. Manfredi, and R. Fernando. 2009. Additive genetic variability and the Bayesian alphabet. Genetics. 183:347-363.
Gilbert, H., J.P. Bidanel, J. Gruand, J. C. Caritez, Y. Billon, P. Guillouet, H. Lagant, J. Noblet, P. Sellier. 2008. Genetic parameters for residual feed intake in growing pigs, with emphasis on genetic relationships with carcass and meat quality traits. J. Anim. Sci. 85(12):3182-3188.
Goddard, M. E., B. J. Hayes, and T. H. E. Meuwissen. 2010. Genomic selection in livestock populations. Genet. Res. 92.5-6:413-421.
Goddard, M. E., B. J. Hayes, and T. H. E. Meuwissen. 2011. Using the genomic relationship matrix to predict the accuracy of genomic selection. J. Anim. Breed. Genet. 128:409-421.
Goodman, S. N. 1999. Toward evidence-based medical statistics. 2: The Bayes factor. A. Int. Med. 130(12):1005-1013.
Grignola, F., A. C. Clutter, D. S. Casey, J. C. M. Dekkers, and X. Liu. 2002. Effects of feeding strategies using electronic feeders on data quality, feed intake, growth and feed efficiency of swine. Proc. Seventh World Cong. Genet. Appl. Livest. Prod.: 10-12.
Gunsett, F.C. 1984. Linear index selection to improve traits defined as ratios. J. Anim. Sci. 59:1185-1193.
Guo, X., O. F. Christensen, T. Ostersen, Y. Wang, M. S. Lund, and G. Su. 2015. Inproving genetic evaluation of litter size and piglet mortality for both genotyped and
nongenotyped individuals using a single-step method. J. Anim. Sci. 93. 2
Habier, D., R. L. Fernando, and J. C. M. Dekkers. 2007. The impact of genetic relationship information on genome-assisted breeding values. Genetics. 177:2389:2397.
Habier, D., R. L. Fernando, and J. C. M. Dekkers. 2011. Extension of the bayesian alphabet for genomic selection. BMC Bioinformatics. 12:186.
Henderson, C. R. 1953. Estimation of variance and covariance components. Biometrics. 9(2): 226-252.
Hayes, B. J., J. Pryce, A. J. Chamberlain, P. J. Bowman, and M. E. Goddard. 2010. Genetic architecture of complex traits and accuracy of genomic prediction: coat colour, milk-fat percentage, and type in Holstein cattle as contrasting model traits. PLoS Genet. 6:e1001139.
Hayes, B., and M. Goddard. 2010. Genome-wide association and genomic selection in animal breeding. Genome. 53(11):876-883.
Hayes, B. J., P. J. Bowman, A. J. Chamberlain, and M. E. Goddard. 2009. Invited review: Genomic selection in dairy cattle: progress and challenges. J. Dairy Sci. 92:433-443. Hayes, B. J., P. M. Visscher, and M. E. Goddard. 2009. Increased accuracy of artificial
selection by using the realised relationship matrix. Genet. Res. Camb. 91:47-60. Hazel, L. N. 1943. The genetic basis for constructing selection indexes. Genetics. 28:476-
490.
Henman, D. 2003. Nutritional management in integrated pig units.p11-132. in J. Wiseman, M. A. Varely, and B. Kemp, eds. Perspectives in pig science. Nottingham University Press, Nottingham, UK.
Hoque, M. A., H. Kadowaki, T. Shibata, T. Oikawa, and K. Suzuki. 2009. Genetic
Hoque, M. A., H. Kadowaki, T. Shibata, and K. Suzuki. 2008. Maternal and direct genetic parameters for production traits and maternal correlations among production and feed efficiency traits in Duroc pigs. Asian-Aust. J. Anim. Sci. 7:961-966.
Hosking, F. J., J. A. C. Sterne, G. D. Smith, and P. J. Green. Inference from genome-wide association studies using a novel Markov model. Genet. Epidem.32: 497-504. Howard, J. T., S. Jiao, F. Tiezzi, Y. Huang, K. A. Gray, and C. Maltecca. 2015.
Genome-wide association study on legendre random regression coefficients for the growth and feed intake trajectory on Duroc Boars. BMC Genet. 16(1):59.
Hu, Z., E. R. Fritz, and J. M. Reecy. 2007. AnimalQTLdb: a livestock QTL database tool set for positional QTL information mining and beyond. Nucleic. Acids Res. 35 (suppl 1): 604-609.
Huang Y., J. M. Hickey, M. A. Cleveland, and C. Maltecca. 2012. Assessment of alternative genotyping strategies to maximize imputation accuracy at minimal cost. Genet. Sel. Evol. 44:25.
Huzzey, J. M., D. M. Weary, B. Y. F. Tiau, and M. A. G. von Keyserlingk. 2014. Short communication: Automatic detection of social competition using an electronic feeding system. J. Dairy Sci. 97(5):2953-2958.
Hyun, Y., and M. Ellis. 2001. Effect of group size and feeder type on growth performance and feeding patterns in growing pigs. J. Anim. Sci. 79:803-810.
Jiao, S., C. Maltecca, K. A. Gray, and J. P. Cassady. 2014a. Feed intake, average daily gain, feed efficiency, and real-time ultrasound traits in Duroc pigs: I. Genetic parameter estimation and accuracy of genomic prediction. J. Anim. Sci. 92 (6):2377-2386. Johnson, Z. B., J. J. Chewning, and R. A. Nugent. 1999. Genetic parameters for production
traits and measures of residual feed intake in large white swine. J. Anim. Sci. 77:1679-1685.
Kachman, S. 2008. Incorporation of marker scores into national cattle evaluations. Proc. 9th Genetic Prediction Workshop, Kansas City, MO, pp. 88-91.
Kang, H. M., J. H. Sul, S. K. Service, N. A. Zaitlen, S. Kong, N. B. Freimer, C. Sabatti, and E. Eskin. 2010. Variance component model to account for sample structure in genome-wide association studies. Nat. Genet. 42 (4):348-354.
Kennedy, B. W., J. H. Van der Werf, and T. H. Meuwissen. 1993. Genetic and statistical properties of residual feed intake. J. Anim. Sci. 71:3239-3250.
Kizilkaya, R. L., R. L. Fernando, D. J. Garrick. 2009. Genomic prediction of simulated multibreed and purebred performance using observed fifty thousand single nucleotide polymorphism genotypes. J. Anim. Sci. 88: 544-551.
Koch, R. M., L. A. Swiger, D. Chambers, and K. E. Gregory. 1963. Efficiency of feed use in beef cattle. J. Anim. Sci. 22: 486-494.
Legarra, A., I. Aguilar, and I. Misztal. 2009. A relationship matrix including full pedigree and genomic information. J. Dairy Sci. 92:4656-4663.
Legarra, A., O. F. Christensen, I. Aguilar, and I. Misztal. 2014. Single step, a general approach for genomic selection. Liv. Sci. 166:54-65.
Lonergan, S. M., E. Huff-Lonerga, L. J. Rowe, D. L. Kuhlers, and S. B. Jungst. 2001. Selection for lean growth efficiency in Duroc pigs influences pork quality. J Anim. Sci. 79(8):2075-2085.
Lunn, D. J., J. C. Whittaker, and N. Best. 2006. A Bayesian toolkit for genetic association studies. Genet. Epidem. 30:231-247.
Osborne, J. W., and A. Overbay. 2004. The power of outliers (and why researchers should always check for them). PARE. 9:1-12.
Onteru, S. K., B. Fan, M. T. Nikkilä, D. J. Garrick, K. J. Stalder, and M. F. Rothschild. 2011. Whole-genome association analyses for lifetime reproductive traits in the pig. J. Anim. Sci. 89:988-995.
Onteru, S. K., D. M. Gorbach, J. M. Young, D. J. Garrick, J. C. M. Dekkers, and M. F. Rothschild. 2013. Whole genome association studies of residual feed intake and related traits in the pig. PloS one. e61756.
McGlone, J. J., and W. Pond. 2003. Pig Production: Biological Principles and Applications. Delmar Learning, Clifton Park, NY.
Maselyne, J., W. Saeys, and A. Van Nuffel. 2015. Review: Quantifying animal feeding behaviour with a focus on pigs. Physiol. Behav. 138:37-51.
Maselyne, J., W. Saeys, B. De Ketelaere, K. Mertens, J. Vangeyte, E. F. Hessel, B. Sonck, and W. Saeys. 2014. Validation of a High Frequency Radio Frequency Identification (HF RFID) system for registering feeding patterns of growing-finishing pigs.
Comput. Electron. Agric.108:209-220.
Meiwissen, T. H. E., B. J. Hayes, and M. E. Goddard. 2001. Prediction of total genetic value using genome-wide dense marker maps. Genetics. 157:1819-1829.
Meiwissen, T. H. E. 2007. Genomic selection: marker-assisted selection on a genome wide scale. J. Anim. Breed. Genet. 124:321-322.
Meuwissen, T.H.E., B. J.Hayes, M. E. Goddard. 2014. Accelerating improvement of livestock with genomic selection. Annu. Rev. Anim. Biosci. 1:221-237.
Merks, J. W. M. 1989. Genotype x environment interactions in pig breeding programmes. VI. Genetic relations between performances in central test, on-farm test and commercial fattening. Livest. Prod. Sci. 22:325-339.
Misztal, I. A. Legarra, and I. Aguilar. 2009. Computing procedures for genetic evaluation including phenotypic, full pedigree, and genomic information. J. Dairy Sci. 92:4648-4655.
Mrode, R. A., and B. W. Kennedy. 1993. Genetic variation in measures of food efficiency in pigs and their genetic relationships with growth rate and backfat. Anim. Prod. 56:225-232.
Nejati-Javaremi, A., C. Smith, and J. P. Gibson. 1997. Effect of total allelic relationship on accuracy of evaluation and response to selection. J. Anim. Sci. 75:1738-1745. Nielsen, B. L., A. B. Lawrence, and C. T. Whittemore. 1995. Effect of group size on feeding
behaviour, social behaviour, and performance of growing pigs using single-space feeders. Livest. Prod. Sci. 44:73-85.
Nguyen, N. H., C. P. McPhee, and C. M. Wade. 2005. Responses in residual feed intake in lines of Large White pigs selected for growth rate on restricted feeding (measured on ad libitum individual feeding). J. Anim. Breed. Genet. 122(4):264-270.
Park, T., and G. Casella. 2008. The Bayesian Lasso. J. Am. Stat. Assoc. 103:681-86
Pritchard, J. K., M. Stephens, N. A. Rosenberg, and P. Donnelly. 2000. Association mapping in structured populations. Am. J. Hum. Genet. 67 (1): 170-181.
Rauw, W. M., E. Kanis, E. N. Noordhuizen-Stassen, and F. J. Grommers. 1998. Undesirable side effects of selection for high production efficiency in farm animals: a
review.Livest. Prod. Sci. 56(1):15-33.
Rohrer, G. A., T. Brown-Brandl, L. A. Rempel, J. F. Schneider, and J. Holl. 2013. Genetic analysis of behavior traits in swine production. Livest. Sci. 157(1):28-37.
Rothschild, M. F., Z. Hu, and Z. Jiang. 2007. Advances in QTL mapping in pigs. Intern. J. Biolo. Sci. 3 (3):192.
Rubin, D. B. 1978. Multiple imputation for nonresponse in surveys. John Wiley & Sons. New York.
Rubin, D. B. 1996. Multiple imputation after 18+ years. J. Am. Stat. Assoc. 91:473-489.
Sahana, G., K. Veronika, H. Henrik, N. Bjarne, and O. F. Christensen. 2013. A genome-wide association scan in pig identifies novel regions associated with feed efficiency trait. J. Anim. Sci. 91:1041-1050.
Schnyder, U., A. Hofer, F. Labroue, and N. Kunzi. 2001. Genetic parameters of a random regression model for daily feed intake of performance tested French Landrace and Large White growing pigs. Genet. Sel. Evol. 33:635-658.
Schulze, V., R. Roehe, L. B. J, H. Looft, and E. Kalm. 2002. Genetic associations between observed feed intake measurements during growth, feed intake curve parameters and growing-finishing performances of central tested boars. Livest. Prod. Sci. 73:199-211.
Sowell, B.F., J. G. P. Bowman, M. E. Branine, and M. E. Hubbert. 1998. Radio frequency technology to measure feeding behavior and health of feedlot steers. Appl. Anim. Behav. Sci. 59:277-284.
Su, Y. S., M. Yajima, A. E. Gelman, and J. Hill. 2011. Multiple imputation with diagnostics (mi) in R: Opening windows into the black box. J. stat. softw. 45:1-31.
Suzuki, K., M. Irie, H. Kadowaki, T. Shibata, M. Kumagai, and A. Nishida. 2005. Genetic parameter estimates of meat quality traits in Duroc pigs selected for average daily gain, longissimus muscle area, backfat thickness, and intramuscular fat content. J Anim. Sci. 83:2058-2065.
Tibshirani, R. 1996. Regression shrinkage and selection via the lasso. J. R. Stat. Soc. B. 58(1):267-88.
Tolkamp, B.J., D. P. N. Schweitzer, I. Kyriazakis. 2000. The biologically relevant unit for the analysis of short-term feeding behavior of dairy cows. J. Dairy Sci. 83, 2057– 2068.
van Buuren, S. and K. Groothuis-Oudshoorn. 2011. MICE: Multivariate imputation by chained equations in R. J. Stat. Softw. 45:1-68.
VanRaden, P. M. 2008. Efficient methods to compute genomic predictions. J. Dairy Sci. 91:4414-4423.
Veerkamp, R. F., M. P. Coffey, Donagh P. Berry, Y. De Haas, E. Strandberg, H. Bovenhuis, M. P. L. Calus, and E. Wall. 2012. Genome-wide associations for feed utilisation complex in primiparous Holstein–Friesian dairy cows from experimental research herds in four European countries. Animal 6:1738-1749.
Livest. Prod. Sci. 47: 11-22.
Walker, N. 1990. A comparison of single- and multi-space feeders for growing pigs fed non-pelleted diets ad libitum. Anim. Feed Sci. Technol. 30:169-173.
Walker, N. 1991. The effects on performance and behaviour of number of growing pigs per mono-place feeder. Anim. Feed Sci. Tech. 35:3-13.
Wakefield, J. 2007. A Bayesian measure of the probability of false discovery in genetic epidemiology studies.Am. J. Hum. Genet. 81:208–227.
Wakefield, J. 2008. Reporting and interpretation in genome-wide association studies. Intern. J. Epidem. 37:641-653.
Willems, O. W., S. P. Miller, and B. J. Wood. 2013. Assessment of residual body weight gain and residual intake and body weight gain as feed efficiency traits in the turkey (Meleagris gallopavo). Genet. Sel. Evol. 45(1):26.
Wolc, A., J. Arango, P. Settar, J. E. Fulton, N. P. O’Sullivan, R. Preisinger, D. Habier, R. Fernando, D. J. Garrick, W. G. Hill, and J. C. M. Dekkers. 2012. Genome-wide association analysis and genetic architecture of egg weight and egg uniformity in layer chickens. Anim. Genet. 43:87-96.
Visscher. 2010. Common SNPs explain a large proportion of the heritability for human height. Nat. Genet. 42:565-69.
Zhang, Z, J. Liu, X. Ding, P. Bijma, DJ de Koning, and Q. Zhang. 2010. Best linear unbiased prediction of genomic breeding values using a trait-specific marker-derived
relationship matrix. PloS one 5 (9):e12648.