ABSTRACT
CHEN, WEI-TING. Laser-Processed Directionally Solidified WC-W2C Eutectoids. (Under the direction of Dr. Elizabeth C. Dickey.)
Directionally solidified WC-W2C ceramics containing 40 at % carbon, corresponding to the WC-W2C eutectoid composition, were produced by laser surface melt processing. The resulting microstructures showed a lamellar-type eutectic/eutectoid microstructure with the WC minor phase embedded in the W2C matrix phase. The interlamellar spacing (𝜆) in the eutectoid regions followed the relationship 𝑉𝜆3.8 = 𝑐𝑜𝑛𝑠𝑡𝑎𝑛𝑡, with the smallest spacing of
331±36 nm achieved in the 3.24 mm/s processed sample. The indentation hardness increased with decreasing interlamellar spacing, and a Vickers indentation hardness of 28.5 GPa was achieved in the sample with the smallest interlamellar spacing. The directionally solidified WC-W2C materials show enhanced indentation mechanical properties in comparison to previously reported WC-Co composites and WC-based materials.
Crystallographic orientation relationships and interfaces in directionally solidified WC-W2C eutectoids were investigated by electron microscopy and electron backscattered
diffraction. A preferred nominal growth directions of [1̅21̅0] WC// [1̅21̅0] W2C or [011̅0]WC//[011̅0]W2C along the solidification direction was observed. The majority of
interface habit planes are found to be (0001)WC//(0001)W2C. The interfaces were found to
Laser-Processed Directionally Solidified WC-W2C Eutectoids
by Wei-Ting Chen
A dissertation submitted to the Graduate Faculty of North Carolina State University
in partial fulfillment of the requirements for the degree of
Doctor of Philosophy
Materials Science and Engineering
Raleigh, North Carolina 2015
APPROVED BY:
_______________________________ _______________________________ Elizabeth Dickey Ronald Scattergood
DEDICATION
BIOGRAPHY
Wei-Ting Chen was born July 11th, 1988 to parents Kuo-Chung Chen and May-Chu Tsai of Kaohsiung City, Taiwan. In 2010, he graduated with a Bachelor’s degree from National
Cheng Kung University. After graduation he remained with National Cheng Kung University as a Research Assistant, focusing on chemical vapor deposition of semiconductor nanowires. In August, 2011, he joined North Carolina State University to pursue his doctorate. In January, 2011, he joined Prof. Elizabeth Dickey’s group to start his research. His project
ACKNOWLEDGMENTS
TABLE OF CONTENTS
LIST OF TABLES………...…...vii
LIST OF FIGURES………...viii
Chapter 1 Introduction……….... 1
1.1 Material requirements for cutting tool applications………...………. 1
1.2 Eutectic ceramic composites………... 3
1.3 Objectives……….5
Chapter 2 Background………..8
2.1 Hard ceramic and ceramic composite materials………8
2.2 Directional solidification of eutectoid/eutectic (DSE) carbide and boride……...9
2.2.1 Eutectoid reaction……….10
2.2.2 Eutectoid growth………...11
2.2.3 Eutectoid microstructure……….………...12
2.2.4 DSE carbide and boride systems………....13
2.2.5 Microstructural scale vs processing rate relationship……….…….16
2.3 Processing techniques………...17
2.4 Indentation hardness testing………..21
2.4.1 Vickers indentation hardness………....22
2.4.2 Load-dependent hardness………..23
2.4.3 Indentation-induced fracture profiles………....26
2.4.4 Indentation hardness and hardness scaling in carbide and boride DSEs………..….….29
2.5 Crystallographic orientation relationship in carbide and boride DSEs.…..32
2.6 WC-W2C eutectoids………..………..36
2.6.1 Phases and equilibria in W-C system………36
2.6.2 Tungsten carbide (𝜹-WC)………..37
2.6.3 Ditungsten carbide (𝜷”-W2C)………..40
2.6.4 Microstructure of WC-W2C eutectoids……….43
Chapter 3 Growth and Microstructure-dependent Hardness of Directionally
Solidified WC-W2C Eutectoid Ceramics………..50
3.1 Experimental procedures……....………..50
3.1.1 Sample preparation………...50
3.1.2 Laser surface processing………...………...50
3.2 Results and discussion………..53
3.2.1 Microstructure analysis………....……….53
3.2.2 Vickers indentation hardness………60
Chapter 4 Crystallographic Orientation and Interface Analysis in WC-W2C Eutectoids………..64
4.1 Experimental procedures………..64
4.2 Eutectoid microstructure………...65
4.3 Crystallographic texture………69
4.4 Interface analysis………..73
4.5 Discussion……….78
Chapter 5 Deformation Mechanisms in WC-W2C Eutectoids………..80
5.1 Experimental procedures………..80
5.2 Indentation-induced fracture profile……….82
5.3 Characterization of deformation mechanisms………...………...84
5.3.1 Deformation mechanisms in W2C-rich regions………...……..……..85
5.3.2 Deformation mechanisms in primary WC regions………87
5.3.3 Deformation mechanisms in WC-W2C eutectoid regions………….91
5.4 Discussion………93
Chapter 6 Conclusions………..95
Bibliography……….98
Appendices……….113
Appendix A Laser System………114
LIST OF TABLES
Table 2-1 Boride and carbide eutectic/eutectoid systems………..…13
Table 2-2 Crystallographic ORs of DSEs………..33
Table 2-3 Orientation relationship matching models in DSEs………...34
Table 2-4 Structural data of tungsten carbide compounds……….37
Table 5-1 𝑔 ∙ 𝑏 criterion for dislocations in primary WC region………89
Table 5-2 𝑔 ∙ 𝑅 criterion for stacking fault in primary WC region……….89
Table 5-3 𝑔 ∙ 𝑏 criterion for dislocations in WC eutectoid lamellae………...93
Table A-1 The specifications of the laser system………..116
Table B-1 Specifications of the DILAS laser system………...…..…………...…………119
Table B-2 Specifications of Aerotech motion control stages………119
Table B-3 Specifications of Mikron pyrometer……….120
LIST OF FIGURES
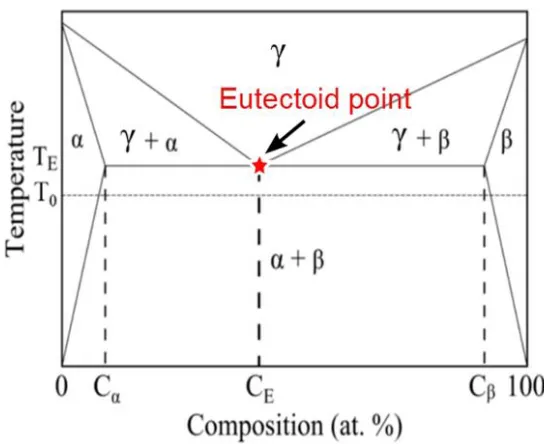
Fig. 2-1 Schematic of a binary phase diagram showing a eutectoid reaction…….…..…...10
Fig. 2-2 Schematic of eutectoid growth……….…………...11
Fig. 2-3 Schematic of the typical microstructures in eutectoids and eutectics……….…...12
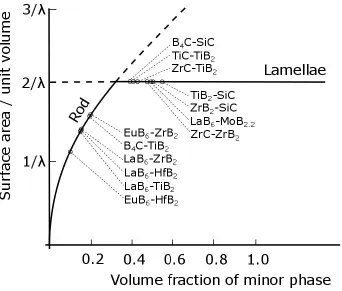
Fig. 2-4 Summary of observed boride and carbide eutectic microstructures as a function of the volume fraction of the minor phase………...14
Fig. 2-5 Typical morphologies of directionally solidified eutectic microstructures….…...15
Fig. 2-6 Vapor pressures of the elements at various temperatures………..17
Fig. 2-7 Schematic diagram of crucibleless zone melting……….…………..19
Fig. 2-8 Schematic diagram of laser surface processing method……….………20
Fig. 2-9 Schematics of Vickers (a) indenter tip and (b) indentation imprint……….……..23
Fig. 2-10 Schematic of indentation hardness as function of load……….……….24
Fig. 2-11 Indentation hardness as function of load for NC 132 silicon nitride……….26
Fig. 2-12 Cross-section view of Vickers indentation profiles………...28
Fig. 2-13 Interlamellar spacing dependent indentation hardness in DSE borides and carbides………...31
Fig. 2-14 X-ray pole figures of the LaB6-ZrB2 DSE……….32
Fig. 2-15 W-C binary phase diagram……….………36
Fig. 2-16 Crystal structure of δ-WC………..……….………..39
Fig. 2-17 Crystal structure of the β′′-W2C……….41
Fig. 2-18 Microstructure of fully dense monolithic W2C sintered at 1900oC………...42
Fig. 2-19 Vickers indentation hardness as function of load……….…..43
Fig. 2-20 SEM images of the microstructures of WC-W2C eutectoids……….44
Fig. 2-21 TEM image of slip in WC grain deformed by radial turning testing……….46
Fig. 2-22 High resolution TEM image of two dissociated partial dislocations……….47
Fig. 2-23 HRTEM image of the triangular array of dislocations………...48
Fig. 2-24 TEM dark-field image of dislocations in W2C at 2100 oC and the schematic the associated dislocations………...49
Fig. 3-1 Image of Laser surface processing……….51
Fig. 3-2 XRD spectra of arc-melted and laser-processed WC-W2C eutectoid………53
Fig. 3-3 SEM images of the directionally solidified WC-W2C eutectoids ……….55
Fig. 3-4 Schematics predictions of the microstructures at various temperatures…………56
Fig. 3-5 The relationship between interlamellar spacing and laser scan rate………..58
of interlamellar spacing………..62
Fig. 4-1 Montaged optical micrograph of the laser-processed sample produced at 0.12 mm/s in the longitudinal plane………..66
Fig. 4-2 SEM BSE micrographs of WC-W2C eutectoids produced at the scan rate of 0.12 mm/s………..68
Fig. 4-3 EBSD maps of WC-W2C DSE……….………..70
Fig. 4-4 EBSD WC and W2C pole figures……….………..72
Fig. 4-5 EBSD (0001)WC//(0001)W2C interface orientation map……….……….73
Fig. 4-6 TEM bright-field image of the lamellae in the WC-W2C eutectoid………..75
Fig. 4-7 STEM image of the WC(0001)//W2C(0001) interface..….…………...…………77
Fig. 5-1 SEM image of indentation-induced fracture behaviors……….……….82
Fig. 5-2 SEM images of indentation induced fracture behaviors…………...…….………83
Fig. 5-3 SEM image of the microstructure of WC-W2C eutectoids produced at 0.12 mm/s processing rate……….84
Fig. 5-4 TEM bright-field image of W2C-rich region in pristine sample ……...………....85
Fig. 5-5 TEM bright-field and dark-field images of deformed W2C-rich region…………86
Fig. 5-7 TEM bright field images deformed primary WC region………88
Fig. 5-8 Schematic of the dislocation-stacking fault network observed in primary WC region………90
Fig. 5-9 TEM bright field images of WC and W2C lamellae in eutectoid region………...92
Fig. A-1 Schematic of laser system used for laser surface processing..………...114
Chapter 1
Introduction
1.1 Material requirements for cutting tool applications
Ceramic materials are utilized in a variety of mechanical applications that require high hardness, high wear resistance, and high fracture toughness. For example, cutting tools have been used for cutting, shaping, and drilling metal materials in industry[1–3]. Cutting tools generally refer to the parts that have direct contact with the metal work pieces and perform the actual removal of the materials in the manner of shear action. The preference of ceramic cutting tool is subject to the mechanical properties of the materials, including high hardness, high wear resistance, and high fracture toughness[1,3]. Cutting tools must have higher hardness than metal work piece in order to remove materials. Wear resistance is the important requirement for the lifetime of the cutting tools. Furthermore, fracture toughness provides the resistance to fracture behaviors.
the other hand, carbides and borides such as WC, SiC, and ZrB2 are of great interest, because the covalent bonding within the material leads to higher hardness relative to oxides, although the oxidation resistance of those materials may be lower than oxides.
Monolithic oxides, carbides, and borides usually suffer from low fracture toughness, which may lead to cracking and chipping at corners and edges, which is one of the failure modes for cutting tools[1,3]. Therefore, composite materials processed by a variety methods have been developed, because high interface density within composites may change the fracture behavior, and hence, increase overall fracture toughness. For example, TiB2 and ZrB2 were added to SiC to form TiB2/SiC and ZrB2/SiC composites by sintering or reactive hot pressing to improve fracture strength over monolithic SiC[5–8]. However, sintering and hot pressing of the TiB2/SiC and ZrB2/SiC composites require high temperature (≥ 1700 oC)[5–8]. Moreover, it was reported that an amorphous phase was usually found at interfaces
in the sintered composite. The amorphous phase and voids at interfaces may reduce flexural strength at high temperature due to interface boundary sliding as reported by Waku, et al[9].
Mpa.m1/2) was produced via pulse plasma sintering and sintered at 1100oC[16]. Although the fracture toughness increases with increasing cobalt content, WC-Co composites have relatively low hardness, thermal stability, and oxidation resistance compared to monolithic WC.
An alternative route to forming WC-W2C composites has also studied[17–19]. In 1965, the WC-W2C eutectoid was firstly explored by Sara, et al[18]. The eutectoid reaction follows γ − WC1−𝑥 → 𝛽 − 𝑊2𝐶 + 𝛿 − 𝑊𝐶 at the composition of ~38 at% carbon and eutectoid
temperature of 2527oC. WC-W2C eutectoids offer a naturally formed composite microstructure[17,18], which may be a potential path for enhancing fracture toughness over monolithic WC and W2C while maintaining hardness and oxidation resistance, which are compromised with metallic phase additions.
1.2 Eutectic ceramic composites
example, LaB6-ZrB2 and LaB6-TiB2[26–32]. In addition, based materials, such as B4C-TiB2 and B4C-SiC34–38, were explored for their combination of low density and high hardness. Some of these studies have shown that DSE composites can have advantageous mechanical and thermal and chemical stability relative to their monolithic or traditional composite counterparts [37,38].
A variety of methods have been utilized for producing eutectics/eutectoids composite materials[23,39–41]. Arc melting is a convenient approach for preliminary studies of new eutectic systems, as the electric arc can provide temperatures exceeding 3000 oC[42,43] and the inert atmosphere is particularly well suited for non-oxide DSEs. Although the overall processing is not directional, locally oriented microstructures align with the propagation of the solid-liquid interface isotherms, and this approach can be quite useful for mapping out new eutectics or refining eutectic compositions[42–44]. Non-directional eutectic solidification has also been demonstrated in inert-atmosphere plasma spray processes[45], and may be a potential path for large-scale production of ceramic powders containing a eutectic composite microstructure.
Over the past 15 years, laser beams, which can be focused to very small focal points or lines with high beam intensities, have been used as the heating source in both laser float zone (LFZ) and laser surface melting methods[47–49]. Later, A geometrical modification to the LFZ method is capable of producing plate-shaped samples, where the thickness of the resolidified layer depends primarily on the laser power, the material absorptivity, laser scan rate and thermal boundary conditions[33,41]. The ceramic powders are usually hydraulically pressed into a pellet and placed in a graphite crucible before laser processing. Because the laser source can be highly focused, the laser-based methods offer larger thermal gradient (103-104 K/cm) than traditional techniques (below 102 K/cm) and allow for higher processing rates than traditional FZ and Bridgeman methods[41]. With the increased thermal gradient of laser heating sources, the stability of coupled eutectic growth increases to larger solidification rates, and the high processing rates provide the possibility of producing finer microstructures.
1.3 Objectives
laser processing rate. Additionally, the Vickers indentation hardness as the function of microstructural scale is investigated.
Chapter 3 introduces the processing technique for producing plate-shaped WC-W2C DSEs. Experimental procedures of ceramic powder processing and parameters for laser surface processing are presented. The design of the laser system is provided in Appendix A. The safety plan of the laser system is provided in Appendix B. The sequential phase transformation and microstructural evolution based on phase diagram and resulted microstructure will be discussed. Load-dependent Vickers indentation hardness is studied in all samples. Additionally, Vickers indentation hardness as function of microstructural scale is investigated.
In forced-velocity (directional) processing of eutectic/eutectoid composites, the microstructures tend to elongate anisotropically along the solidification direction, with the microstructural morphology (e.g. lamellae or rod) largely governed by reduction of interfacial energy[22,23]. Furthermore, most of DSEs grow along particular crystallographic directions[32,36,41,50], and adopt low-energy crystallographic orientation relationships between the two phases. Chapter 4 presents crystallographic orientation relationship between two phases, which is characterized via electron backscattered diffraction (EBSD) and transmission electron microscope (TEM). The interface analysis using EBSD data and scanning transmission electron microscope (STEM) is presented.
Chapter 2
Background
2.1 Hard ceramic and ceramic composite materials
example, low fracture toughness (2.4-3.5 MPa.m1/2) in ZrB2[56], which results in low fracture toughness and low thermal shock resistance[51].
Composites of these classes of materials have been developed to improve microstructure-engineered properties such as fracture toughness. For example, TiB2 and ZrB2 were added to SiC to form TiB2/SiC and ZrB2/SiC composites by sintering or reactive hot pressing to improve fracture strength over monolithic SiC[5–8]. However, sintering and hot pressing of the TiB2/SiC and ZrB2/SiC composites require high temperature (≥1700 oC)[5–8]. Moreover, it was reported that an amorphous phase was usually found at the interface of sintered composite. The amorphous phase and voids at interfaces may reduce flexural strength at high temperature due to interface boundary sliding as reported by Waku, et al[9]. As another approach, metals are added to carbides such as WC to form metal-carbide composites to improve and sintering fracture toughness kinetics over monolithic WC[1,10,11]. The WC-Co composites have been successfully utilized in industry as the cutting tools and drilling bits, although WC-Co composites have relatively low hardness, thermal stability, and oxidation resistance compared to monolithic WC.
2.2 Directionally solidification of eutectoid/eutectic (DSE) carbide and boride
2.2.1 Eutectoid reaction
In Fig. 2-1, a simple binary phase diagram showed a eutectoid reaction from a γ solid phase to 𝛼 and 𝛽 solid phases. The driving force of the eutectoid reaction is supercooling (∆𝑇), which is evaluated by the difference between eutectoid temperature (TE) and growth
temperature (T0). Eutectoid composition (CE) indicates the atom fraction of each phase in eutectoid. Eutectoid reaction is completely reversible and can be expressed as Equation (2-1): 𝛾 (𝑠𝑜𝑙𝑖𝑑) → 𝛼 (𝑠𝑜𝑙𝑖𝑑) + 𝛽(𝑠𝑜𝑙𝑖𝑑) (2-1)
2.2.2 Eutectoid growth
As shown in Fig. 2-2, coupled growth of a eutectoid is based on the lateral boundary diffusion of 𝛼 and 𝛽 atoms near the transformation front[64–68]. During coupled growth, 𝛼 phase tends to reject 𝑏 atoms but consumes 𝑎 atoms; 𝛽 phase tends to reject 𝑎 atoms but consumes 𝑏 atoms. The diffusion of atoms leads to concentration variant near the front. If the
concentration variant is very large (high growth rate) and thermal gradient between across transformation front is small enough, constitutional supercooling will occur[69]. The requirement for the eutectoid growth is evaluated by the ratio of thermal gradient (G) and growth rate (R), G/R[23]. Planer coupled growth may be interrupted and the off-eutectoid microstructure may formed when the value of G/R is small. It is noted that the eutectoid growth is similar to eutectic growth, although the initial phase in eutectic growth is liquid.
2.2.3 Eutectoid microstructure
Since the 1970s, the kinetics of eutectoid growth has been studied and understood to be a diffusion-limited coupled growth mechanism at the solid/solid interface[64,65,67,68]. As shown in Fig. 2-3, the typical eutectoid microstructures are either lamellar or rod-like (fiber) microstructures, which are similar to eutectic microstructures, and the morphology is largely determined by the contribution of interfacial energy to the total free energy of the system[22,23]. In eutectoids and eutectics, the microstructural scale can be defined as interlamellar or interfiber spacing and denoted as λ. Interlamellar spacing is the summation of the widths of two phases. Interfiber spacing is the distance between the centers of two rods.
2.2.4 DSE carbide and boride systems
With advances in processing techniques, a variety of classes of boride and carbide DSEs have been discovered or demonstrated. Table 2-1 presents a summary of the boride and carbide DSE composites that have been investigated to date.
Table 2-1 Temperature, composition, microstructure of developed boride and carbide eutectic systens
Eutectic systems Eutectic temperature
(˚C)
Composition (mol%)
Morphology Directional Solidification
ZrC-ZrB2[50] 2830 ± 15 52ZrC0.9, 48ZrB2 Lamellar Y
ZrC-TiB2[50] 2660 ± 40 58ZrC0.9, 42TiB2 Lamellar Y
ZrB2-SiC[44,70] 2297 41.5ZrB2, 58.5SiC Lamellar N
EuB6-ZrB2[71] 63EuB6, 37ZrB2 Rod Y
EuB6-HfB2[71] 79EuB6, 21HfB2 Rod Y
LaB6-(TixZr 1-x)B2[26]
66LaB6, 34(TixZr1-x)B2
63LaB6, 37(TixZr1-x)B2
Rod Rod
Y
LaB6-ZrB2[72] 2467 ± 40 68.8LaB6, 31.2ZrB2 Rod Y
LaB6-TiB2[28] 2977 66LaB6, 34TiB2 Rod Y
LaB6-HfB2[28,73] 3347 70LaB6, 30HfB2 Rod Y
LaB6-MoB2.2[74] 2160 75MoB2.2, 25LaB6 Rod N
TiB2-SiC[5,42] 2190 ± 40 40TiB2, 60SiC Lamellar N
TiB2-TiCxN1-x[75] 2327~2627 Multi-compositions Lamellar/
Rod
N
TiC0.92-TiB2[50] 2650 ± 15 65TiC0.92, 35TiB2 Lamellar Y
TiC-TiB2
-SiC[43,76]
34TiC, 22TiB2, 44SiC Lamellar N
B4C-TiB2[33–
35,77–79]
2310 75B4C, 25TiB2 Rod Y
B4C-SiC[24,35] 2300 47B4C, 53SiC Lamellar Y
B4C-TiB2
-SiC[80,81]
2047 ± 20 51.2B4C, 8.1TiB2,
40.7SiC
Fig. 2-4 Summary of experimentally observed boride and carbide eutectic microstructures as a function of the volume fraction of the minor phase. Most of the carbide and boride eutectics obey the predicted morphology based on relative interface
calculated preferential microstructural model have been found in several eutectic systems due to crystallographic anisotropy and orientation relationship[23,75]. For example, in TiB2-TiCxN1-x eutectic system, rod-like microstructure was maintained while the volume fraction of the dispersed phase was 63 %[75].
Fig. 2-5 Two typical morphologies of directionally solidified eutectic microstructures: (a) (a)
2.2.5 Microstructural scale vs processing rate relationship
DSEs have a well-controlled microstructural scale, which can be used to tailor mechanical properties[33,82,83]. The relationship between processing (transformation) rate (V) and interlamellar spacing in eutectoids and eutectics usually maintains the following relationship in Equation (2-2)[21,23,65,68]:
𝑉𝜆𝒏 = 𝑘 (2-2)
where 𝑛 is a constant depending on the predominant mechanism for diffusional control, and 𝑘 is a constant related to the thermal gradient across the solid-liquid interface. Values for n
have been derived theoretically and are usually found to be equal or greater than 2 in eutectoid solidification[21,22]. Zener[84] considered a volume diffusion ahead of the transformation front as the dominant mechanism for eutectoid solidification, which results in 𝑛 = 2, equivalent to eutectic transformation. Shapiro, et al[68] and Sundquist[66] derived the 𝜆 − 𝑉 relationship based on boundary diffusion along the transformation front, which leads to 𝑛 = 3. Furthermore, Carpay, et al[65] introduced the influence of supercooling (△ 𝑇)to the 𝜆 − 𝑉 −△ 𝑇 relationship for boundary diffusion mechanism and derived 𝑛 = 4. This
2.3 Processing techniques
Arc melting is a convenient approach for preliminary studies of new eutectic systems, as the electric arc can provide temperatures exceeding 3000 oC[42,43] and the inert atmosphere is particularly well suited for non-oxide DSEs. Although the overall processing is not directional, locally oriented microstructures align with the propagation of the solid-liquid interface isotherms, and this approach can be quite useful for mapping out new eutectics or refining eutectic compositions[42–44]. Non-directional eutectic solidification has also been demonstrated in inert-atmosphere plasma spray processes[45], and may be a potential path for large-scale production of ceramic powders containing a eutectic composite microstructure.
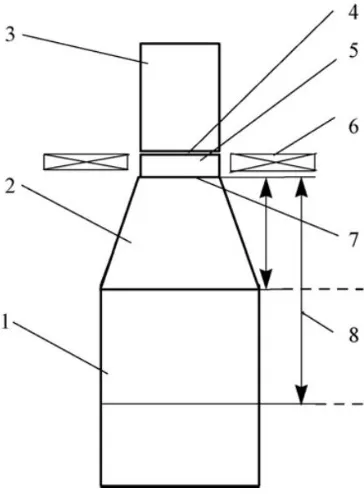
Fig. 2-7 Schematic diagram of crucibleless zone melting: 1-initial rod, 2-sintering zone, 3-crystal, 4-front of crystallization, 5-melting zone, 6-inductor, 7-front of melting, 8-zone of thermal influence[34]
larger thermal gradient (103-104 K/cm) than traditional techniques (below 102 K/cm) and allow for higher processing rates than traditional FZ and Bridgeman methods[41]. With the increased thermal gradient of laser heating sources, the stability of coupled eutectic growth increases to larger solidification rates, and the high processing rates provide the possibility of producing finer microstructures.
Fig. 2-8 Schematic diagram of laser surface processing method[48]
laser-solidification systems to suppress internal porosity, as reported in laser surface processing of B4C-TiB2 DSEs[33].
Another concern of laser surface-solidification techniques, which is of particular concern to boride and carbide eutectics because of their very high eutectic temperatures, is the generation of large thermal stresses within sample, which may lead to thermal shock during cooling. An approach to minimizing these large thermal gradients is to back-heat samples so that the temperature gradient between the resolidified layer and the underlying substrate are reduced[91].
2.4 Indentation hardness testing
The hardness of the material is defined as the resistance to plastic (permanent) deformation. In indentation hardness testing methods (Vickers, Knoops, Brinell, Rockwell, Berkovich), the surface of a material is loaded by an indenter with a specific geometry. Indentation hardness testing is not a measurement of a physical quantity, however, it provides an easy way to characterize the materials of all kinds. Mechanical testing techniques such as three pointing bending and tensile testing, require test samples in standard sizes and shapes. However, indentation hardness, specifically microindentation hardness, has an advantage of measuring the hardness of samples with small surface area.
performed on a small sample. However, the drawback of microindentation hardness may come up in coarse microstructures, for examples, large grain size materials and composite materials[92–94]. The indentation-induced destructed region at low load may not cover enough area to estimate an accurate indentation hardness, and hence, the errors between measurements may be large. Furthermore, the dimensions of the indentation imprints are measured using optical microscope, which require huge amount of human operation. Thus, human-induced errors may be generated during measurement and lead to the variation of the indentation hardness.
2.4.1 Vickers indentation testing
As shown in the Fig. 2-9(a), a Vickers indenter has a pyramidal diamond with 136o face angle on the tip. During loading, the tip is forced to a predetermined load into the surface of test sample, which results in a square indentation imprint, as shown in Fig. 2-9(b). The lengths of the indentation imprint diagonals (d1 and d2) are measured via a double crosshair measurement system in an optical microscope. The Vickers indentation hardness can be calculated by Equation (2-3)[95]:
𝐻𝑣 = 0.0018544 (𝑃/𝑑2) (2-3)
Fig. 2-9 Schematics of Vickers (a) indenter tip and (b) indentation imprint[95]
In general, to compare indentation hardness values between different samples, measurement should have the same load and same type of indenter. Indentation hardness values should be the average of at least 10 qualified measurements from acceptable indentation, as discussed in the ASTM standard[96].
2.4.2 Load-dependent indentation hardness
Load-dependent indentation hardness has been reported in some materials. As shown in Fig. 2-10, the indentation hardness increases with decreasing load, and extremely high hardness may be measured at low loads. Quinn, et al[97], made efforts on explaining the empirical load-hardness curve by fitting with Meyer law, which is originally used in Brinell
(a)
hardness testing to estimate work-hardening capacity of metals[98]. The Meyer law follows Equation (2-4):
𝑃 = 𝐶𝑑𝑛 (2-4)
, where P is the load, C is a constant, d is the measured indentation size, n is Meyer index, which generally indicates the relationship between hardness and load. A load-dependent hardness curve can be observed when n is less 2, while a constant hardness (plateau) region when n is equal to 2. Although Meyer law has a good fit with empirical load-hardness curve, there is no theoretical basis support for applying the law in Vickers indentation testing[97].
Fig. 2-10 Indentation hardness as function of load: dependent hardness (n<2) and load-independent hardness (n=2)
Fig. 2-11(a) Indentation hardness as function of load for NC 132 silicon nitride (b) Indentation in NC 132 silicon nitride. The indentation imprint was generated uner 98 N load.
2.4.3 Indentation-induced fracture profiles
A variety of research has been investigated the fracture behaviors, specifically cracking, associated with hardness indentation[93,94]. The type of indentation cracks, e.g., radial, median, and lateral, depends on the geometry and sharpness of the indenter[93,99]. In this research, we focus on the Vickers indentation which produces half-penny like crack or
(a)
Palmquist crack profiles. As shown in Fig. 2-12(a), half-penny like cracks have crack length to indentation diagonal ratio of (2-5):
𝑐/𝑎 ≥ 2.5 (2-5)
where c is the crack length measured from the center of the indentation to the end of the median-radial crack, and a is the half diagonal of the indentation. As shown in Fig. 2-12(b), Palmquist cracks have crack length to indentation ratio of (2-6):
0.25 ≤ 𝑙/𝑎 ≤ 2.5 (2-6) ,where 𝑙 is the length of the radial crack measured from the corner of the indentation to the
Fig. 2-12 Cross-section View of Vickers indentation induced (a) half-penny like crack (b) Palmquist crack profile.
Vickers indentation has been used to measure a material’s fracture toughness based on
the lengths of cracks induced during deformation. Different models have been developed to calculate indentation fracture toughness based on geometric features in different indentation induced crack profiles. Anstist, et al[99,100], and Niihara, et al[101], developed a fracture toughness model for half-penny like crack profile and Palmquist’s crack profile, repectively. Empirically, Spiegler, et al[11], applied Niihara’s equation to WC-Co composites and the results were found to agree with Charpy impact tests. Pena, et al[102], used Anstis’s and Niihara’s equations to calculate indentation fracture toughness of a directional solidified Al2O3–Y3Al5O12–ZrO2 ternary eutectic. In addition, Rios, et al[103], applied Niihara’s
equation to measure indentation fracture toughness of directionally solidified Al-Nb-Ni tenary eutectic.
However, the validity of indentation fracture toughness methods have been questioned in a comprehensive study by Quinn, et al[104]. The comparison of fracture toughness via standard measurement and Vickers indentation (Anstis, Niihara, and Miyoshi) showed diverse values in fracture toughness, which are generated by the constants used in each method. The study concludes that accurate and precise 𝐾𝐼𝐶 values can be reached only if a
specific empirical calibration constant for a material is used[104].
2.4.4 Indentation hardness and hardness scaling in carbide and boride DSE
Because of the small size of most laboratory-processed DSEs, indentation hardness is one of the most commonly measured mechanical properties. Most studies om eutectic materials have been conducted by either Vickers or Knoop indentation testing under the appropriate ASTM standards[95,96]. The indentation hardness of the DSEs should be reported with indentation type and indentation load, since the indentation hardness may be load dependent at low load, as found in B4C-TiB2 DSE (indentation load < 4 N and interlamellar spacing ≦ 1.0 um)[33,105]. Additionally, an acceptable value of indentation
hardness should be the value measured in constant indentation hardness (load-independent hardness) region, as discussed by Quinn, et al[104].
scale (interlamellar/interfiber spacing) dependent. As indicated in section 2.2.5, the microstructural scale can be controlled and predicted by equation (2-2) in each eutectic system under a reasonable growth rate (without constitutional supercooling). In general, indentation hardness of boride and carbide DSEs usually increases with decreasing increasing solidification rate and interlamellar/interfiber spacing. The microstructural scale dependent indentation hardness of studied boride and carbide DSEs are summarized in Fig. 2-13. White, et al[33], reported that Vickers indentation hardness of B4C-TiB2 is proportional to λ−1. Sorrell, et al[82], reported that Knoop indentation hardness in ZrB2 and
ZrC-TiB2 DSEs is proportional to λ−1/2, which may suggest dislocation impedance at interfaces
as described by Hall and Petch[106,107]. Moreover, anisotropy of hardness in ZrC-ZrB2 DSE was observed in longitudinal and transverse surfaces, which may be due to the difference in crystallographic orientations and the elongation of the colonies/grains[50,82]. In B4C-SiC DSE, Hong, et al[24], reported that Knoop indentation hardness at 1.96 N load increased with increasing solidification rate and decreasing interlamellar spacing. However, a contradiction was found in Gunjishima’s study[35], in which Knoop indentation hardness of
dendrite and cell at high growth rate. For instance, a decrease of indentation hardness in ZrC-ZrB2 DSE due to the microstructure breakdown (formation of dendrites and cells) was found in interlamellar spacing smaller than 1.85 um[82]. This points to the fact that not only the length scale, but also the morphology and possibly the crystallography are important to the hardness of the eutectics.
2.5 Crystallographic orientation relationships in carbide and boride DSEs
Directionally solidified eutectics, in general, tend to be highly textured (see the x-ray pole figures of LaB6-ZrB2 DSE in Fig. 2-14[32]) with preferred crystallographic orientation relationships (ORs) between the constituent phases. The ORs are believed to result in minima in the interfacial free energies. Although no rigorous methods have been developed for a priori prediction of these low-energy ORs, they nonetheless remain important to the overall anisotropic properties of the eutectic. Consequently, the crystallographic ORs have been characterized in most of the boride and carbide DSE, as shown in Table 2-2. Most of these eutectic systems are found to grow along low-index crystallographic directions and the interface plane orientations tend to also be low index.
Table 2-2 Crystallographic ORs of DSEs
Systems Orientation relationships
B4C-SiC[35] ORI : B4C[003]//SiC[111]
B4C(003)//SiC(220)//interface OR II: B4C[-1-21]//SiC[12-1] B4C(012)//SiC(3-11)//interface
B4C-TiB2-SiC[81] B4C[104]//TiB2[100]//SiC[111]//growth direction
B4C-TiB2[35,36] OR I[35]:
B4C[2-12]//TiB2[010] B4C(101)//TiB2 (001)//interface
OR II[36]:
B4C(10-1-2)//TiB2 (11-20) B4C(-12-10)//TiB2(0001)//interface
LaB6-ZrB2[26,30,32] OR I (major):
LaB6[001]//ZrB2[0001] LaB6(110)//ZrB2(11-20)//interface
OR II (minor): LaB6[111]//[0001]ZrB2 LaB6(1-10)//ZrB2(1-100) TiB2-TiCxN1-x[75,109] TiB2[0001]//TiB2-TiCxN1-x[111]
TiB2(11-20)//TiB2-TiCxN1-x (-202)
TiC-TiB2[50] TiC[01-1]//TiB2[01-10]
TiC(111)//TiB2(0001)//interface TiC-TiB2-SiC[76] TiC[011]//TiB2[-12-10]//SiC[112]
TiC(200)//TiB2(0001)//SiC(40-2) WC-W2C eutectoids[108] WC[1̅21̅0]//W2C[1̅21̅0]//growth direction
WC(0001)//W2C(0001)//interface ZrC-ZrB2[50] ZrC[01-1]//ZrB2[01-10]//growth direction
ZrC(111)//ZrB2(0001)//interface ZrC-TiB2[50] ZrC[01-1]//TiB2[01-10]//growth direction
ZrC(111)//TiB2(0001)//interface
criteria[110,111]. Additionally, edge-to-edge matching model and plane-on-plane matching model have been reported for crystallographic orientations with low interfacial energies[112,113].However, the prediction of preferred ORs via any of these geometric methods is found to not be rigorous. Low degree of coincidence resulting from the differences of the crystal symmetry and lattice parameters between two phases may lead to little potential for low energy interfaces. Thus, geometric methods may not be able to explain all of the observed preferred ORs.
Table 2-3: OR Matching models in DSE carbides and borides
Edge-on-edge matching Plane-on-plane matching Neither TiC-TiB2
ZrC-TiB2 ZrC-ZrB2
WC-W2C B4C-SiC
B4C-TiB2-SiC B4C-TiB2 LaB6-ZrB2 TiC-TiB2-SiC
which had the close-packed planes in two phases (ZrC: (111), ZrB2: (0001), TiC: (111), TiB2: (0001)) parallel to each other and perpendicular to the interface plane. Detailed characterization of crystallographic orientation in LaB6-ZrB2 DSE has been conducted and reported by several works[26,30,32], although the contradictions are presented in the crystal growth direction. Chen, et al[30], reported the growth direction of the eutectic had the crystallographic relationship of LaB6[001]//ZrB2[0001]; however, Deng, et al[32], performed pole figure analysis and reported that LaB6[001] is 29o and ZrB2[0001] is 25o off from growth direction, respectively. Deng further explained the difference may be due to a better homogenization by maintaining initial melt zone for several minutes before solidification in their processing[32]. Moreover, the geometry of the melt pool during solidification may result in discrepancy between local solidification direction and macroscopic crystal growth direction, which may lead to the difficulty in determining of the local velocity of the solid-liquid interface.
2.6 WC-W2C eutectoid
2.6.1 Phases and equilibria in W-C system
The W-C binary phase diagrams have been reported by a variety of pioneer works. However, different designations used in the phase diagrams lead to the confusion in the descriptions of the phases. A recently published generalized phase diagram constructed according to the results in the earlier literature[18,19,114,115] is showed in Fig.2-15[116].
Fig. 2-15 W-C binary phase diagram[116]
γ-WC1-x, β-W2C, β′-W2C, and β′′-W2C. It is noted that β′′-W2C shown in Fig. represents
α-W2C, which is used in the earlier literature[114]. The structural data of those compounds are showed in Table 2-4. Among all the compounds, δ-WC and β′′-W2C are room temperature
phases, and γ-WC1-x, β-W2C, β′-W2C are high temperature phases.
Table 2-4 Structural data of tungsten carbide compounds[19,114,115]
Phase Lattice parameter (nm)
Space group Structure
δ-WC γ-WC1-x β-W2C β′-W2C β′′-W2C a=0.2906, c=0.2837 a=0.4252 -0.4266 a=0.3002, c=0.475-0.476 a=0.4728, b=0.6009, c=0.5193 a=0.3001, c=0.4728 𝑃6̅𝑚2 𝐹𝑚3̅𝑚 𝑃63/𝑚𝑚𝑐
𝑃𝑏𝑐𝑛 𝑃3̅𝑚1 Hexagonal Cubic Hexagonal Orthorhombic Trigonal
2.6.2 Tungsten carbide (𝛅-WC)
Furthermore, WC has a high Young’s modulus (~ 700 GPa), which is higher than other transition metal carbides[118]. Compared to other transition metal carbides, WC has relatively low thermal expansion coefficient (~5.5 x 10⁻⁶ K-1)[118]. As the properties mentioned above, the advantages of WC make it a potential candidate material for using in wear-resistant application such as tool materials. However, the use of monolithic WC in tool materials is impossible due to its brittle nature.
The first WC was synthesized in the formed of powder in 1890s[118,119]. The process in the synthesis of WC includes the use of oxides and reactants, such as calcium carbide[119]. The development of the WC-based industrial material products began between 1910s ~1920s, which is ~ 20 years after the first discovery of synthesized WC. In recent decades, WC is of great interest in fields of science research and industrial applications, which are mainly focused on the development of new processing techniques for enhancing the mechanical properties. For example, the recently developed nanocrystalline WC-based materials showed excellent hardness and fracture toughness[16,120].
δ-WC is the most common form of tungsten carbide at the tungsten and carbon ratio of 1. δ-WC has excellent thermal stability, and is stable from room temperature to 2790 oC. As
shown in Table 4, δ-WC has the space group of 𝑃6̅𝑚2 (𝐷3ℎ1 ), which is a hexagonal crystal
Fig. 2-16 Crystal structure of δ-WC[118]
Pure WC has slow sintering kinetics. Thus, WC powder has to be sintered at very high temperature (> 1800 oC). Traditionally, fully dense WC ceramics can be pressure-sintered through hot pressing or hot isostatic pressing[125]. The sintering process is conducted at high temperature, which leads to grain growth, and hence, decrease the hardness of the ceramics. Recently developed spark plasma sintering combining high heating rates at the temperature ranged between 1200 oC ~ 1400 oC has successfully limited grain growth and produced WC ceramic in submicron- to nano- grain size (84 ~ 295 nm)[57].
2.6.3 Ditungsten carbide (𝛃′′-W2C)
W2C as a kind of lower tungsten carbide has the tungsten to carbon ratio of 2.
β′′-W2C is a room temperature phase and is stable up to 1250oC. β′′-W2C has the space group of 𝑃3̅𝑚1, which is a trigonal crystal structure with the lattice parameters of 𝑎 = 0.3001 nm and 𝑐 = 0.4728 nm. In the β′′-W2C structure, tungsten atoms occupy the coordinates of (0.333,
Fig. 2-17 Crystal structure of the β′′-W2C[118]
Fig. 2-18 Microstructure of fully dense monolithic W2C sintered at 1900oC[126]
Fig. 2-19 Vickers indentation hardness of polycrystalline W2C as function of load[126]
2.6.4 Microstructure of WC-W2C eutectoids
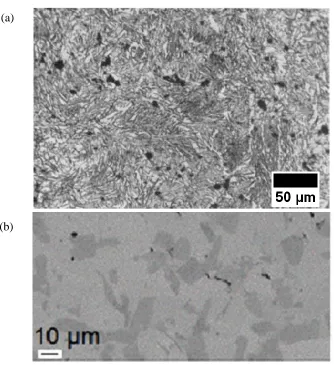
Fig. 2-20 SEM images of the microstructures of WC-W2C eutectoids produced via (a) furnace reaction and (b) arc melting[17,18]. The samples were prepared by mixing WC and W powders at eutectoid composition.
The first WC-W2C eutectoids was reported by Sara in 1965 as part of study of equilibria in W-C binary system[18]. WC-W2C eutectoids in this study were produced at the carbon composition of 38 atom % in a vacuum furnace. The furnace temperature was set at eutectoid temperature, 2525 oC, and cooled down by quickly cutting the heater power. As shown in Fig. 2-20(a), the microstructure of the WC-W2C eutectoid is lamellar-typed[18]. The recent
(a)
development of WC-W2C eutectoids was included in a study of microstructure and indentation hardness of multi-compositional WC-W2C composites reported by Dash, et al[17]. The arc melted WC-W2C eutectoids were produced at the carbon composition of 38
atom %. As shown in Fig. 2-20(b), primary WC phase was contained in the eutectoid microstructure, because liquid phase was formed and precipitation of primary WC phase occurred prior to the eutectoid reaction.
The experimental results on the mechanical properties of WC-W2C eutectoids are limited. Dash, et al[17], reported the Vickers indentation hardness and of arc-melted WC-W2C composites at the carbon compositions of 33.4, 38, 40, 45.4, and 48.6 atom %. The highest hardness of the studied WC-W2C composites, 27.12 ± 0.06 GPa (4.9 N load), was found at the eutectoid composition[17].
2.6.5 Deformation mechanisms in 𝜹-WC and 𝜷’’-W2C
Fig. 2-21 TEM image of slip in WC grain deformed by radial turning testing[128]
It has been reported that WC is capable of sustaining considerable plastic deformation without brittle fracture at room temperature[127]. Recent progress in TEM characterization of dislocation activity has provided a fundamental understanding of the deformation characteristics in WC[127–130]. As shown in Fig. 2-21, high density of unidirectional slip is observed in turning test induced deformed WC grains[128]. Based on the analysis of the slip traces induced by hardness indentation, the slip planes are of {101̅0} type and the slip
directions are <112̅0>, <112̅3>, and <0001>[131,132]. It has been suggested that the slip
plastic deformation prior to fracturing[129]. Dislocations with Burgers vectors of 1
3<112̅0>, 1
3<12̅13>, and <0001> have been observed via TEM techniques[133]. Furthermore, as shown
in Fig. 2-22, dissociation of the perfect dislocations into two identical partial dislocations is
observed on {101̅0} planes with the stacking fault displacement direction, 𝑅 =1
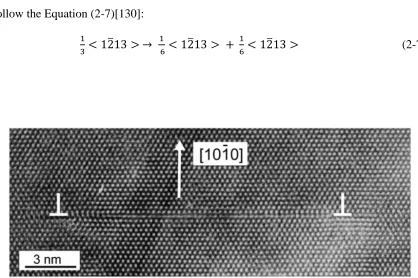
6< 12̅13 >
and follow the Equation (2-7)[130]:
1
3< 12̅13 > → 1
6 < 12̅13 > + 1
6< 12̅13 > (2-7)
Fig. 2-22 High resolution TEM (HRTEM) image of two dissociated partial dislocations in WC in the viewing direction of [0001], showing dissociation of the dislocation with the
Burgers vector of 1
3< 12̅13 >, with resulting stacking fault plane of (101̅0) and
displacement vector of 1
In addition, the dissociated dislocations may interact with each other. As shown in Fig. 2-23, three associated dislocations form a triangular array with three stair rock dislocations
with the Burgers vectors of 1
6<21̅1̅0>, 1
6<1̅1̅20>, and 1
6<1̅21̅0>, at A, B, and C,
respectively[130]. The interaction between dislocations may also lead to the nucleation of crack in WC[127]. A formation of a sessile dislocation acting as the nucleus of crack follows Equation (2-8)[127]:
1
6< 112̅3 > + 1
6< 2̅113 > → 1
6< 1̅21̅0 > (2-8)
Compared to the study of the deformation mechanisms of WC, less efforts has been made in W2C. As shown in Fig.2-24, Epicier, et al[134], examined the dislocation activities of W2C at high temperature (2100 oC) and reported the dissociation of dislocation follows Equation (2-9):
1
3< 21̅1̅0 > → 1
3 < 101̅0 > + 1
3< 11̅00 > (2-9)
Chapter 3
Growth and Microstructure-dependent Hardness of
Directionally Solidified WC-W
2C Eutectoid Ceramics
3.1 Experimental procedures 3.1.1 Sample preparation
Starting powders of W (4-6 μm, Inframat, CT) and WC (2-6 μm, Inframat, CT) were mixed at the eutectoid WC-W2C composition (C 40 at %). The mixed powders were milled with WC grinding media (Glen Mills Inc., NJ) in ethanol for 8 hours. The powders were then dried and pressed into pellets with a diameter of 25.4 mm and a thickness of 5mm using a Carver hydraulic press (Carver Inc, Wabash, IN) at 104 psi. Each pellet was further pressed in a cold isostatic press (CIP) at 6 x 10⁴ psi to achieve more isotropic particle distribution within each pellet and green densities of ~60 %. Arc melting experiments were first carried out at a pressure of 50 millitorr and Argon-purged environment to provide a comparison with prior literature8,10.Our study showed that the most homogeneous lamellar-type microstructures and highest hardness occurred at a composition of 40 at % carbon content, which was then used in forced-velocity processing experiments.
3.1.2 Laser surface processing
operated at 2000 W. The details of the laser system are provided in Appendix I. The laser beam was linearized via an oscillating mirror operated at 30 Hz to produce a line 12.7 mm long with a width of 5 mm at the focal point. The scanning distance of the laser beam was approximately 50 mm and laser scans were conducted at rates of 0.12, 0.36, 0.72, 1.08, and 3.24 mm/s.
Fig. 3-1 Image of Laser surface processing
Each resolidified sample was mounted in epoxy resin (PELCO, US, Part A & Part B) and were cut in the plane perpendicular to the laser scanning direction by a diamond saw and polished by diamond paste down to 1 m surface roughness. For phase identification, x-ray
investigated in a scanning electron microscope (SEM) (HITACHI 3200N, Japan) equipped with a backscattered electron (BSE) detector and operated at 20 kV. Interlamellar spacings within the eutectoid regions of each sample were measured from SEM images and presented as the average distance between lamellae along with a standard deviation.
Vickers microindentation (Mitutoyo Corporation, Japan) was conducted on the polished surfaces at indentation loads of 0.98, 2.94, 4.9, and 9.8 N, with the sample thicknesses at least 6 mm. The indenting direction was parallel to the solidification direction. Indentations were imaged by an optical microscope (CARL ZEISS, Germany) at a magnification of 50X for measuring the indentation diagonal lengths. Indentation hardness was calculated following the ASTM standard[95]. Each average hardness value and standard deviation was calculated from at least 10 qualified indentations.
While it was impracticable to produce standard notched test bars to evaluate the material fracture toughness, indentation techniques were utilized to evaluate qualitatively the fracture behavior of the materials as a function of microstructural scale. Subsurface damage under the indents was investigated via cross-sectional SEM imaging performed in a focused ion beam (FIB) microscope (FEI Quanta 3D, OR). A platinum bar (length: 15 μm, width: 1 μm, height: 1 μm) was deposited on the surface of the area of interest prior to material removal for
3.2 Results and Discussion 3.2.1 Microstructure Analysis
Fig. 3-2 presents XRD patterns of the arc-melted and laser-processed WC-W2C eutectoids at the 40 at% carbon composition. The diffraction data show the presence of the β′′-W2C and hcp δ-WC phases in arc-melted and laser-processed samples. (The analyses of
XRD spectra are based on the structural data provided in Table 2-4. Surprisingly, none of samples exhibited strong crystallographic texture, which is usually present in directionally solidified materials.
Fig. 3-4 Schematics predictions of the microstructures at (a) 3028 K prior to eutectic reaction (b) 3028 K at eutectic reaction (c) 2800 K at eutectoid reaction. The graphics scale with volume percentage of each phase. The regions included by dash lines in (c) indicate the original eutectic γ-WC1-x phase in (b).
Based on the W-C phase diagram[19] (Fig. 2-15), schematics of the expected equilibrium phase evolution during cooling from the liquid phase are presented in Fig. 3-4 and scaled by volume percentages to facilitate comparison with microstructural data. As shown in Fig. 3-4(a), 23 mol % of primary γ-WC phase precipitates prior to the liquid composition reaching the eutectic composition at 3028 K. In Fig. 3-4(b), the remaining eutectic liquid, at a phase fraction of 77 mol %, undergoes the eutectic reaction at 3028 K and forms 19.3 mol % β-W2C and 57.7 mol % γ-WC1-x. In Fig. 3-4(c), the γ-WC1-x subsequently decomposes to 36.1 mol % β-W2C and 21.6 mol % δ-WC in the eutectoid
reaction at 2800 K, in which the eutectoid lamellar structure forms. Additionally, the primary γ-WC phase transforms to δ-WC prior to the eutectoid reaction. The β-W2C then transforms
to β′-W2C at 2657 K and β′′-W2C at 2370 K with no microstructural change. The final
eutectoid δ-WC (15.1 vol %), and eutectoid β′′-W2C (44.8 vol %) as indicated in Fig. 3(a).
The total δ-WC and β′′-W2C phases have volume fractions of 31.2 % and 68.8 %, respectively.
W2C formed via the eutectic reaction, and the δ-WC and β′′-W2C formed via the subsequent eutectoid reaction. Since the size of each of these distinct regions may scale differently with solidification rate, a bimodal or trimodal microstructure may result. Such a multimodal microstructure is most evident in Fig. 3-3(c), in which a bimodal distribution of WC lamellae lengths is observed in the sample produced at the highest scan rate. The larger δ-WC lamellar structure most likely result from the precipitation of primary γ-WC from the
liquid phase above 3028 K (which later converts to δ-WC) since diffusion kinetics are fastest
Fig. 3-5 The relationship between interlamellar spacing and laser scan rate. Error bars represent one standard deviation of at least 15 measurements of interlamellar spacing.
Fig. 3-5 presents the interlamellar spacings in the WC-W2C eutectoid regions as a function of laser scan rates. The smallest and largest average interlamellar spacings were 331±36 nm and 770±64 nm measured at the highest scan rate (3.24 mm/s) and the slowest scan rate (0.12 mm/s), respectively. The relationship between interlamellar spacing and processing rate of WC-W2C eutectoids follows Equation (3-1):
𝑉𝜆𝒏 = 𝑘, 𝒏 = 3.8 (3-1)
𝜆 ∝ V−0.26 (𝑅2 = 0.998) (3-2)
3.2.2 Vickers indentation hardness
The Vickers microindentation hardness measured as a function of indentation load for arc-melted and laser-processed samples solidified at different scan rates are shown in Fig. 3-6. For each sample, the hardness decreases with increasing load with convergence to a limiting load-independent value at higher loads. As discussed by Quinn, et al[104], plasticity-based deformation mechanisms dominate at lower loads while fracture-based mechanisms become operative at higher loads; the former mechanisms are load dependent and the later mechanism leads to a constant hardness.
Fig. 3-7 presents optical microscope images of indentation imprints generated by 0.98, 2.97, 4.9, and 9.8 N loads. It is noted that the radial cracks are only observed at the load
equal or larger than 4.9 N load in all samples. The onset of radial crack formation at 4.9 N
load in all samples is consistent with the interpretation of the load-dependent hardness behavior in Fig. 3-6 in which the transition from plasticity to fracture-based deformation occurs around 4.9 N load. The values of indentation hardness at 4.9 and 9.8 N loads are
similar (in the range of the standard deviations) indicating that convergence to the load-independent value is achieved around 4.9 N.
Fig. 3-8 Vickers indentation hardness of WC-W2C eutectoids as a function of interlamellar spacing. Error bars represent one standard deviation of at least 15 measurements of interlamellar spacing and at least 10 measurements of indentation hardness.
As indicated in Fig. 3-8, the indentation hardness of WC-W2C eutectoids increase with decreasing interlamellar spacing, as is observed in most of the DSEs[33,82,83]. However, the best power law fitting is reached (𝑅2 = 0.98) when indentation hardness is proportional to 𝜆−2.4. How this proportionality relates to deformation mechanisms in WC-W2C is still
Chapter 4
Crystallographic Orientation and Interface Analysis in
WC-W
2C Eutectoids
4.1 Experimental procedures
Powder samples at the eutectoid composition were prepared by mixing W (4-6 μm, Inframat, CT) and WC (2-6 μm, Inframat, CT) at an equivalent 40 at % carbon composition, and green bodies (~60% theoretical density) were subsequently laser surface processed with a linearized beam. The experimental parameters and the procedures of laser surface processing were described in detail in our previous paper[108]. In this work, the WC-W2C eutectoid was produced at a laser scan rate of 0.12 mm/s and power of 2000 W. The average interlamellar spacing of WC-W2C eutectoids grown under these conditions was 770±64 nm. Samples were prepared for microstructural analysis both parallel (longitudinal) and perpendicular (transverse) to the laser processing direction (𝑣̂). The surfaces were polished
Microstructural and EBSD analyses were conducted in a dual-beam focused ion-beam/scanning electron microscope (FIB/SEM) microscope (FEI Quanta 3D, OR) equipped with an EBSD detector (Oxford Instrument, UK). For EBSD, the sample was tilted by 70o to reach the optimum angle for the maximum diffraction signal. EBSD maps were acquired at an electron beam accelerating voltage of 10 kV and bean current of 16 nA with a scanning step size of 65 nm. EBSD post-processing software, Mambo and Tango, were utilized to create pole figures (PF) and interface orientation maps, respectively, from the acquired orientation data.
The crystallographic ORs were determined by a combination of EBSD and selected area electron diffraction (SAED) performed in a transmission electron microscope (TEM). TEM samples of about 8 um x 8 um were lifted out from the polished surface via FIB. Sample thinning was carried out with a Ga ion beam at 30 kV, and subsequent milling at 2 kV removed damaged amorphous layers from the surface.
Interfaces in the WC-W2C eutectoids were also investigated via high-angle annular dark field (HAADF) imaging in an aberration-corrected scanning transmission electron microscope (STEM, FEI Titan, OR) operated at 200 kV. The atom column positions at the WC/W2C interface in the HAADF image were located through normalized cross-correlation using a two-dimentional Gaussian distribution[135]
4.2 Eutectoid microstructure
A, in Fig. 4-1), where a sintered powder (unmelted) region with high porosity can be observed to the left of the melt pool. After initiation of a steady-state melt pool, dense eutectic/eutectoid is produced. A curved liquid-solid front was formed during the processing, as a consequence of the thermal boundary conditions in laser surface processing[136], so the solid-liquid interface orientation will vary through the depth of the sample[78,137]. In general, the growth (crystallization) direction is normal to the liquid-solid interface, which may lead to variation of growth direction and rate through the depth of the sample.
As shown in Fig. 4-2, the laser-processed WC-W2C eutectoids have lamellar-type microstructure observed in both longitudinal (Fig. 4-2 (a)) and transverse (Fig. 4-2 (b)) planes relative to the processing direction (𝑣̂). The dark phase in the SEM images is WC, and
the light (matrix) phase is W2C. In Fig. 4-2 (a), a view from the top surface of the sample, the lamellae are generally oriented toward the processing direction (𝑣̂). Grain/colony sizes on the order of 10 m are observed from the orthogonal view and appear randomly oriented, as
shown in Fig. 4-2 (b), which should lead to an overall fiber texture in the sample. Moreover, the processing (out-of-plane) direction (𝑣̂) and growth direction have a ~20˚ misorientation
Fig. 4-2 SEM back scattered electron micrographs of WC-W2C eutectoids produced at the scan rate of 0.12 mm/s, with the processing directions (𝑣̂) indicated. The images were imaged
4.3 Crystallographic Texture
EBSD analysis was performed on transverse-section samples to assess the crystallographic texture of the WC and W2C phases. In this study, we performed experiments in regions ~300-500 um from the top surface of the melt pool, where the tilt angle between the processing and growth (crystallization) direction was about 20o. The EBSD data were acquired at several different locations on the polished surface, and all positions showed similar results. Fig. 4-3 (a) shows a representative EBSD phase map, revealing the spatial distribution of the phases in an area of about 28 m x 32 m, in which the blue phase is
δ-WC and the red phase is β′′- W2C. No other phases could be identified, consistent with the
previous x-ray diffraction data[108]. Fig. 4-3(b) and (c) show the crystallographic orientations of the WC and W2C phases, respectively, with respect to the laser processing direction (out-of-plane direction). The overall microstructure has grains on the order of 10 m in size, with WC and W2C lamellae that grow along similar crystallographic orientation.
Locally, the crystallographic orientations of the WC lamellae are similar to those of neighboring W2C lamellae, although slight misorientations can be observed from the variation in color. The dominant growth axes were close to [1̅21̅0]WC//[1̅21̅0]W2C, as shown in green, while a minor growth orientation close to [011̅0]WC//[011̅0]W2C was also
Fig. 4-3 EBSD (a) phase map image (b) WC (c) W2C orientation map image with viewing direction (z), parallel to processing direction(𝑣̂) (d) WC and W2C orientation map image with
structure. Complementary EBSD maps plotted with respect to an orthogonal direction, Fig. 4-3 (d), indicate that regardless of the growth direction, the overall nominal crystallographic orientation relationship is that of {0001}WC//{0001}W2C.
This epitaxial relationship is also evident in averaged pole figures (Fig. 4-4), in which similar intensity distributions are observed in the {0001}, {1̅21̅0}, and {101̅0} pole figures
from both WC and W2C. The pole figure intensities are dominated by the regions appearing green in Figs. 4-3 (b) and (c). As indicated by the {1̅21̅0} WC intensity distribution labeled
A in Fig. 4-4 (a), there is a misorientation of this low-index pole by 21.1˚ from the center of the stereographic projection, corresponding to the processing direction (𝑣̂). This results from
the curvature of the solid-liquid interface at that depth in the sample, which leads to an inclination of the growth ~20˚ from 𝑣̂ (see Fig. 4-1). Note that the other intensity clusters in
the {1̅21̅0} WC pole figure, labeled B and C in Fig. 4-4 (a), are associated with symmetrically equivalent poles in the hexagonal crystal structure, which are inclined by 60o. As expected, {101̅0} and {0001} poles are observed 30˚ and 90o away, respectively, from the
{1̅21̅0} poles. The local mosaicity was calculated from the full width at half maxima of the
In Fig. 4-4 (b), the pole figure intensity distributions from W2C generally overlap with those from WC, however, a mistilt angle of 2o is observed between all of the corresponding intensity maxima.

![Fig. 2-6 Vapor pressures of the elements at various temperatures[88,89]](https://thumb-us.123doks.com/thumbv2/123dok_us/1543835.1189388/29.612.169.462.396.634/fig-vapor-pressures-elements-various-temperatures.webp)
![Fig. 2-8 Schematic diagram of laser surface processing method[48]](https://thumb-us.123doks.com/thumbv2/123dok_us/1543835.1189388/32.612.150.472.257.469/fig-schematic-diagram-laser-surface-processing-method.webp)
![Fig. 2-21 TEM image of slip in WC grain deformed by radial turning testing[128]](https://thumb-us.123doks.com/thumbv2/123dok_us/1543835.1189388/58.612.218.435.69.329/fig-tem-image-grain-deformed-radial-turning-testing.webp)
![Fig. 2-23 HRTEM image of the triangular array of dislocations viewed along [0001][130]](https://thumb-us.123doks.com/thumbv2/123dok_us/1543835.1189388/60.612.179.478.237.582/fig-hrtem-image-triangular-array-dislocations-viewed.webp)