INVESTIGATION
Quantifying Population Genetic Differentiation
from Next-Generation Sequencing Data
Matteo Fumagalli,*,1Filipe G. Vieira,* Thorfinn Sand Korneliussen,†,‡Tyler Linderoth,* Emilia Huerta-Sánchez,* Anders Albrechtsen,‡and Rasmus Nielsen*,‡,§
*Department of Integrative Biology and§Department of Statistics, University of California, Berkeley, California 94720,†Centre for
GeoGenetics, Natural History Museum of Denmark, Copenhagen, Denmark 2100, and‡Department of Biology, University of
Copenhagen, Copenhagen, Denmark 2200
ABSTRACT Over the past few years, new high-throughput DNA sequencing technologies have dramatically increased speed and reduced sequencing costs. However, the use of these sequencing technologies is often challenged by errors and biases associated with the bioinformatical methods used for analyzing the data. In particular, the use of naïve methods to identify polymorphic sites and infer genotypes can inflate downstream analyses. Recently, explicit modeling of genotype probability distributions has been proposed as a method for taking genotype call uncertainty into account. Based on this idea, we propose a novel method for quantifying population genetic differentiation from next-generation sequencing data. In addition, we present a strategy for investigating population structure via principal components analysis. Through extensive simulations, we compare the new method herein proposed to approaches based on genotype calling and demonstrate a marked improvement in estimation accuracy for a wide range of conditions. We apply the method to a large-scale genomic data set of domesticated and wild silkworms sequenced at low coverage. Wefind that we can infer thefine-scale genetic structure of the sampled individuals, suggesting that employing this new method is useful for investigating the genetic relationships of populations sampled at low coverage.
D
ETERMINING the level of genetic variation within andbetween species or populations is necessary to study the effects of mutation, natural selection, and genetic drift. In the past few years, faster and cheaper high-throughput DNA sequencing technologies have provided us with an unprece-dented amount of large-scale genetic data. These next-gen-eration sequencing (NGS) technologies are now commonly used in population genetic studies and provide us with the perfect opportunity to investigate the evolutionary forces affecting genetic variation.
Currently, available NGS technologies differ in their protocol design (reviewed in Metzker 2010) but all produce
data with similar general features. Briefly, the sequencing
output consists of relatively short stretches (e.g., currently
about 50–100 bp for Illumina machines) of sequenced DNA,
commonly called“reads.”These small segments of DNA are
then aligned to a reference genome or assembled into
scaf-folds inde novo assembly when a reference genome is not
available.
These technologies have greatly improved sequencing efforts in both model and nonmodel organisms, but they have also introduced new challenges because many of the data sets produced using these methods are sequenced at low coverage (a position in the genome is covered by only few sequencing reads), and raw sequencing error rates are often higher than observed using Sanger sequencing. In
such circumstances, it is often difficult to distinguish
between a variable site and a sequencing error, making the
identification of variable sites in the sample (a procedure
known as“SNP calling”) nontrivial and prone to error. Also,
determining the genotype for each individual (“genotype
calling”) can be unreliable due to uncertainty about whether
both the parental chromosomes were sampled. Therefore, sequencing errors and uncertainty in the genotype calls may lead to a biased allele frequency distribution (Johnson and
Slatkin 2008; Hellmannet al.2008).
Accurate estimation of the site frequency spectrum (SFS), however, is important for population genetic inferences of demography, natural selection, and population structure.
Copyright © 2013 by the Genetics Society of America doi: 10.1534/genetics.113.154740
Manuscript received June 25, 2013; accepted for publication August 18, 2013 Supporting information is available online athttp://www.genetics.org/lookup/suppl/ doi:10.1534/genetics.113.154740/-/DC1
Indeed, many summary statistics for evolutionary inferences are functions of the sample allele frequencies (Nielsen 2005). Higher sequencing coverage lowers the uncertainty,
but with afixed budget, researchers need to choose between
sequencing fewer samples at higher coverage or sequencing more samples at low to medium coverage. The latter was the preferred option for many recent large-scale sequencing population genetic studies (1000 Genomes Project
Consor-tium 2010, 2012; Autonet al.2012; Huanget al.2012).
Naïve methods for estimating allele frequencies, which are primarily based on direct counting of sequencing reads, provide inaccurate estimates of local nucleotide diversity
(Nielsenet al.2011). Consequently, there have been
numer-ous efforts to use statistical models to analyze NGS data to provide more accurate estimates of allele frequencies. To this end, maximum-likelihood (ML) methods and Bayesian methods have been developed for estimating the allele fre-quency at any given site (Lynch 2009; Keightley and
Halli-gan 2011; Kimet al.2011) or the entire distribution of allele
frequencies jointly across multiple sites (Li 2011; Keightley
and Halligan 2011; Nielsen et al.2012). Bayesian methods
incorporate base quality scores and statistical uncertainty to obtain posterior probabilities associated with each genotype. Recent studies incorporate this probabilistic approach to es-timate population genetic parameters from NGS data (Yi
et al.2010; Gompert and Buerkle 2011; Kang and Marjoram
2011; Li 2011; Gompert et al.2012).
Thanks to these approaches, genome-wide scans of positive selection have been possible in samples sequenced
at moderate coverage. For example, in Yiet al.(2010), 50
Tibetan individuals were sequenced to identify the regions of the genome involved in the adaptation to high altitude.
Species of rice (Xuet al.2011), chicken (Rubinet al.2010),
and silkworm (Xiaet al.2009) have also been sequenced at
low coverage to identify functional differences between do-mesticated and wild populations.
In genome-wide scans for selection, it is often informative to summarize genetic variation using population
differentia-tion statistics, such asFST(Wright 1951), to identify particular
regions of the genome that are highly differentiated relative to
the rest of the genome.FSTcan also be informative about the
divergence time between two populations. Another powerful tool for the analysis of genetic data are principal component analysis (PCA). This data reduction method is a convenient way to visualize the data, derive corrections for population
stratification in association studies, and investigate specific
features of population history and differentiation. Both PCA
andFSThave been used extensively for the past 30 years and
continue to be valuable tools in summarizing genetic variation. However, as we show, traditional methods for computing
FSTand performing PCA result in biases when applied to
geno-type calls from low or moderate coverage NGS data. Therefore,
we propose a new method to estimateFSTfrom NGS data that
accounts for uncertainty in the genotype calls. Furthermore, we also show that population structure can be investigated with PCA under the proposed probabilistic framework that accounts
for sequencing errors. These new methods outperform previous approaches, especially in the case of low-coverage sequencing data as determined from simulated sequences. Finally, we dem-onstrate the power of the proposed methods by applying it to a previously published data set of wild and domesticated
sam-ples ofBombyx mori(Xiaet al.2009).
The methods developed in this study contribute to the current toolkit for population genetic analyses of next-generation sequencing data and can be applied to both model and nonmodel organisms.
Materials and Methods
Measuring genetic differentiation between populations
FSTis a measure of population genetic differentiation that
quantifies the proportion of variance in allele frequencies
among populations relative to the total variance (the sum of the variance within individuals, within populations, and
between populations). Several estimators of FST have been
proposed through the years (reviewed in Weir and Hill 2002; Holsinger and Weir 2009).
There is considerable debate about definitions ofFST. Some
researchers considerFSTto be a model parameter (e.g., Balding
and Nichols 1995; Nicholson et al. 2002; Holsinger et al.
2002), while others consider it to be a statistic (e.g., Reynolds
et al.1983; Weir and Cockerham 1984; Hudsonet al.1992).
Even when considering FSTas a parameter, there is
consider-able discussion about what model it is a parameter of and how it should be estimated (Marchini and Cardon 2002; Balding 2003). The objective of this article is not to compare these approaches, which differ both in what they estimate and in how the estimation procedure works. We remain agnostic with
regard to the debate on interpretation and definition ofFST,
although we use the word“estimator”throughout. Instead, we
show how some of the most commonly applied estimators of
FSTcan be modified in the presence of low- and
medium-cov-erage data to more accurately reflect what the original FST
estimators were intended to capture; i.e., the objective will
be to derive estimators applicable to NGS data that produce results similar to those that would have been obtained from the original estimator based on full genotype data without any errors. As a note, other estimators, not considered here, could
potentially be modified in a similar fashion.
Method-of-moments estimation: We start by considering
the most simple method-of-moments estimators ofFST. They
do not rely on any assumptions about the shape of the sam-pling distribution, beyond the moments used to estimate the parameters, and they are easy to implement through simple
algebraic expressions. For these reasons,
method-of-moments estimators are popular and often used.
Ourfirst aim is to extend the method-of-momentsFST
es-timator proposed by Reynolds et al.(1983), as this is one of
the most popular and well-motivated estimators ofFST, to take
into account genotyping uncertainty. Assuming a biallelic SNP,
^
pfor populationi,j, and pooled, the genetic variance between
and within populations at sitesis, respectively,
as¼
4ni
^
pði;sÞ2^ps
2
þ4nj
^
pðj;sÞ2^ps
2
2bs
22ninj=ðniþnj
(1)
and
bs¼
niaði;sÞþnjaðj;sÞ
niþnj21 ;
(2)
whereniandnjare the number of sampled individuals per
population, aði;sÞ¼2^pði;sÞð12^pði;sÞÞ, and aðj;sÞ¼
2^pðj;sÞð12^pðj;sÞÞ. Table 1 describes nomenclature used
throughout this manuscript.
The estimate ofFSTfor a single site is then
FST¼ as
asþbs (3)
while for a locusofmsites it is
FSTðlocusÞ¼
Pm s¼1as
Pm
s¼1ðasþbsÞ:
(4)
Maximum-likelihood estimation:ML methods for
estimat-ingFSTrequire the specification of a sampling probability
dis-tribution. Once this distribution is defined, one can maximize
a likelihood function to obtain ML estimators for the
parame-ters of the distribution. ML estimators ofFSThave been very
popular, particularly for detecting signatures of adaptive
nat-ural selection among populations (e.g., Beaumont and Balding
2004; Riebleret al.2008; Foll and Gaggiotti 2008).
Assuming a biallelic site s with beta-distributed allele
fre-quencies, the probability of the sample allele frequencies^pði;sÞ
at populationican be expressed as a beta-binomial distribution
with parameters 2ni(sample size),FST, andpanc,s, the ancestral
population allele frequency. This parameterization assumes di-vergence from a common ancestral population and that the subsequent divergence is well modeled by the
beta-distribu-tion. The marginal sampling distribution in populationiis then
given by (Balding and Nichols 1995; Balding 2003)
P
^
pði;sÞ¼
k
2ni
panc;s;FST
¼
2ni
k
Bðkþa;2ni2kþbÞ
Bða;bÞ ;
(5)
wherekis the count of the nonreference (or derived) allele,
Bis the Beta-function,
a¼panc;sð12FSTÞ
FST ; (6)
and
b¼
12panc;s
ð12FSTÞ
FST :
(7)
Table 1 Nomenclature used in the manuscript
Notation Description
p(i,s),ps Population allele frequency in populationiand pooled, respectively, at sites
panc,s Ancestral population allele frequency at sites
^
pði;sÞ,^ps Estimated population allele frequency from allele counts at populationiand pooled,
respectively, at sites
ni,n No. of sampled individuals at populationi, and pooled, respectively
m No. of sites
rs No. of sequencing reads at sites
vz,s Base at sequencing readzat sites
L(z,v,s) Likelihood of basevat readzand sites
G(w,s) Genotype at sitesfor individualw;G2{0, 1, 2}
X(w,s) Data (sequencing reads) at sitesfor individualw
Y(i,s) Data (sequencing reads) at sitesfor populationi
hððki;ÞsÞ Marginal likelihood ofat sites knonreference alleles for populationi
pðkÞ
ði;sÞ,pðskÞ Posterior probability ofknonreference alleles for populationiand pooled,
respectively, at sites
pðk;zÞ
ði;j;sÞ Joint posterior probability ofkandznonreference alleles for populationiandj,
respectively, at sites
aððki;;jzÞÞ,bððki;;jzÞÞ,cððki;j;zÞÞ Genetic variance between (a) and within (b) populations and total (c) assumingkandznonreference
alleles at populationiandj, respectively
Sððik;;jÞzÞ Joint allele proportions forkandznonreference alleles at populationiandj, respectively
C(w,y) Normalized matrix for PCA for individualwandy
s Index for sites
k Index for samples (allele frequencies)
w,y Indexes for individuals
z Index for sequencing reads
P() Probability function
The full-likelihood function is the product of this sam-pling distribution for all populations, as the populations are
independent conditional onpanc,s. For two populationsiand
j, we have
P
^
pði;sÞ¼2kn
i; ^
pðj;sÞ¼2zn
j
panc;s;FST
¼P
^
pði;sÞ¼
k
2ni
panc;s;FST
3P
^
pðj;sÞ¼2zn
j
panc;s;FST
;
(8)
where the subscripts onnand^pindicate population identity.
We numerically maximize Equation 8 using the Broyden–
Fletcher–Goldfarb–Shanno (BFGS) algorithm (Fletcher
1987; Presset al.2007).
Quantifying population genetic differentiation by calling genotypes
A naïve strategy for estimating sample allele frequencies and
FST is to first call genotypes at each site, and then simply
count the occurrence of nonreference or derived alleles among all individuals.
Wefirst assessed the accuracy of several genotype-calling
strategies (Supporting Information,File S1). These methods
include approaches based on direct counts of read bases, on genotype likelihoods, and on genotype posterior probabili-ties. One promising approach is to use Bayesian methods to assign individual genotypes by computing genotype
poste-rior probabilities P(G|X) from genotype likelihoods and
a specific priorP(G) on genotypeG. Bayes’theorem is used
to calculateP(G|X), the posterior probability of genotypeG
given the observed data X(1000 Genomes Project
Consor-tium 2010). The prior can be defined using extraneous data,
such as the reference sequence, sequences in a database, an
estimate of the allele frequency, and/or inbreeding coeffi
-cients, etc. (e.g., 1000 Genomes Project Consortium 2010;
Li 2011; Nielsenet al.2012).
We calculate genotype posterior probabilities at sitesfor
individual w,P(G(w,s)|X(w,s)) as
P
Gðw;sÞXðw;sÞ
¼ P
Xðw;sÞGðw;sÞ
PGðw;sÞ
P2
G¼0P
Xðw;sÞGðw;sÞ
P
Gðw;sÞ
; (9)
where P(X(w,s)|G(w,s)) are the genotype likelihoods and
P(G(w,s)) is the prior probability of genotypeGat sitesunder
Hardy–Weinberg Equilibrium (HWE). The prior is calculated
from estimates of the per-site population allele frequencies
using the method described in Kim et al. (2011). To call
genotypes, the genotype with the highest posterior proba-bility was chosen for each individual.
Results show that calling genotypes from genotype posterior probabilities provides the most stable and accurate genotype and SNP-calling accuracy at almost all tested experimental
scenarios (Table S1,Table S2, andTable S3). We adopted
this strategy to call genotypes throughout the rest of the
study. Specifically, we counted nonreference alleles from
these called genotypes to infer allele frequencies and
com-puted a method-of-moments estimator of FST, which we
labeledF^ST:GC (Equations 10 and 11). We adopted this
ge-notype calling strategy to compute a ML estimator of FST,
^
FST:ML:GC(Equations 5 and 8).
An alternative strategy for computing FSTis to avoid
ge-notype calling altogether so that inference is based directly on
the posterior probabilities (e.g., Yiet al.2010; Nielsenet al.
2012). We describe such methods in the following sections.
Quantifying population genetic differentiation without calling genotypes
Here we propose using a Bayesian probabilistic framework to
estimateFSTfrom posterior probabilities of sample allele
fre-quencies of each population at each site without calling
spe-cific genotypes. In our applications, we compute a
maximum-likelihood estimate of the site frequency spectrum from
geno-type likelihoods, as previously proposed by Nielsen et al.
(2012). Using this ML estimate of the SFS as a prior in an empirical Bayes approach, we estimate the posterior proba-bility for all possible allele frequencies at each site (Nielsen
et al.2012).
Method-of-moments estimation: Let pðikÞ¼Pðpbi¼
k=ð2niÞjYði;sÞÞbe the posterior probability that a site in
pop-ulationihas derived sample allele frequencypbi¼k=ð2niÞ, in
a sample ofnidiploid individuals, given the read dataY(i,s).
This probability can be calculated from the genotype
prob-abilities using the algorithm in Nielsenet al.(2012). Allele
labeling with respect to the derived allele is arbitrary and any other labeling of alleles could have been chosen if
iden-tification of the ancestral and derived state is not possible.
From these quantities, we compute the posterior expec-tation of the genetic variance between and within
popula-tions (see Equapopula-tions 1 and 2) at sitesas
E½asjYs ¼
X2ni
k¼0
X2nj
z¼0
aððki;;jzÞÞpððki;;zj;ÞsÞ (10)
and
E½bsjYs ¼
X2ni
k¼0
X2nj
z¼0
bððki;;jzÞÞpððik;;zj;ÞsÞ; (11)
where aððki;;jzÞÞ and bð
k;zÞ
ði;jÞ are genetic variances from Reynolds
et al.(1983) formula, withk- and z-derived alleles in
pop-ulationsiandj, respectively, andYsis the sequencing data at
site s. The total expected variance,E[cs|Ys], at each site, is
thenE[cs|Ys] =E[as|Ys] +E[bs|Ys].
The estimate ofFSTfor a single site is given by the ratio of
E[as|Ys] to E[cs|Ys] (Equation 3). However, since the two
using the delta method (Rice 2008; Rice and Papadopoulos
2009) to obtain the following estimator ofFSTat sites,
^
FST:Ev¼E
as
cs
cs6¼0;Ys
¼E½asjYs
E½csjYsþ
XN
u¼1
ð21ÞuE½asjYshcuiþha;cui
E½cjYsiþ1
; (12)
wherehcuiis theuth central moment ofcsandha,cuiis the
mixed central moment, which can be calculated as
hcui¼E ðcs2E½csÞujYs
¼X
2ni
k¼0
X2nj
z¼0
cððki;;jzÞÞ2E½csjYs
u
pðk;zÞ ði;j;sÞ
(13)
and
ha;cui ¼E ðas2E½asjYsÞðcs2E½csjYsÞujYs
¼X
2ni
k¼0
X2nj
z¼0
aððki;;jÞzÞ2E½asjYs
cððki;;jÞzÞ2E½csjYs
u
pðk;zÞ ði;j;sÞ;
(14)
wherecððki;;jzÞÞis the total genetic variance from Reynoldset al.
(1983) formula, withk- andz-derived alleles in populations
i and j, respectively. For computational purposes, we use
only thefirst central and mixed central moments.
pðk;zÞ
ði;j;sÞ can be calculated using maximum likelihood
simi-larly to the method used for calculating pððki;ÞsÞ for a single
population (Nielsenet al. 2012). However, this calculation
may not be desirable due to the high variance associated with the estimation of so many parameters.
An alternative approach is to compute an estimate of the
two-dimensional site frequency spectrum (2D-SFS),Sððki;;jzÞÞ, as
Sððki;;jzÞÞ¼P 1
m s¼0
P2ni
k¼0
P2nj
z¼0
hððki;ÞsÞhððzjÞ;sÞ
Xm
s¼0
hððki;ÞsÞhððzjÞ;sÞ; (15)
wherehððki;ÞsÞandhððzj;ÞsÞare the marginal likelihoods of
observ-ing k and z nonreference alleles at population i and j,
re-spectively, at sites, as presented in Nielsenet al.(2012).
Sððki;;jzÞÞ is then used as a prior to compute the posterior
probability of quantities of interest. For instance, the expec-tation of the genetic variance between populations (see Equation 10) can be computed as
E½asjYs ¼
X2ni
k¼0
X2nj
z¼0
aððki;;jzÞÞhððki;ÞsÞhððzjÞ;sÞSððki;;zjÞÞ: (16)
Finally, a method-of-moments estimator ofFSTovermsites
is given by Equation 4. When analyzing multiple sites, we do
not add the correction factor to the ratio ofE[a|X] toE[c|X]
at each site because, for a large number of sites, the error introduced by taking the ratio of two nonindependent
expectations will be minimal. We also tested the
perfor-mance of other methods to estimate FST from sequencing
data derived from the expectations of sample allele
frequen-cies (File S1).
These methods can be extended to nonpairwise defi
ni-tions of FST (Weir 1996). These formulations require the
estimation of a joint SFS among all populations, which can be estimated in a similar fashion as in Equation 15.
Maximum-likelihood estimation: We also extend the
pro-cedure for ML estimation of FST and panc under the
Beta-binomial distribution (Balding and Nichols 1995; Balding 2003) (Equation 8) to the case of unknown genotypes.
These estimates, which we callFST.ML, are obtained by
max-imizing the likelihood function
P
Yði;sÞ;Yðj;sÞpanc;s;FST
¼ P2ni
k¼0
P
2nj
z¼0
PYði;sÞp^ði;sÞ¼2kni
P^pði;sÞ¼ k
2ni
panc;s;FST
3P
Yðj;sÞ^pðj;sÞ¼2znj
P
^
pðj;sÞ¼2znj
panc;s;FST
¼ P2ni
k¼0
P
2nj
z¼0
hððki;ÞsÞP
^
pði;sÞ¼2kni
panc;s;FST
hððzj;ÞsÞ
3P
^
pðj;sÞ¼2znj
panc;s;FST
;
(17)
whereY(i,s)andY(j,s)are the observed read data at sitesfor
populationiandj, respectively, andhððki;ÞsÞandhððzj;ÞsÞare again
the marginal likelihoods of the sample allele frequency for
populationiandj, computed as in Nielsenet al.(2012).
Principal Components Analysis
A similar approach to the one used for correcting estimates
of FST can be used in PCA. The now-standard method for
calculation PCA in population genetics is based on Patterson
et al. (2006). For n individuals and m sites a normalized
covariance matrixCis calculated as
Cðw;yÞ¼m1 Xm
s¼1
Gðw;sÞ22^ps
Gðy;sÞ22^ps
^
psð12^psÞ
; (18)
wherepbiis the derived allele frequency at sites(the labeling
is again arbitrary) andG(w,s)is the number of derived alleles
for individualwat sites(G2{0, 1, 2} in the diploid case).
The denominator is inserted to account for genetic drift and normalizes the standardized allele frequencies to have the
same variance (Patterson et al.2006). However, other
nor-malizations can be chosen. An eigenvector decomposition of
C is then computed.
We propose computing an estimate ofC(w,y)by
integrat-ing over the posterior genotype probabilities at site s for
be calculated as in Equation 9. The prior is calculated using the
sample allele frequencies ^ps at sites as in Kimet al. (2011).
Therefore, PðGðw;sÞ¼2Þ ¼^p
2
s, PðGðw;sÞ¼1Þ ¼2^psð12^psÞ,
PðGðw;sÞ¼0Þ ¼ ð12^psÞ
2
, whereG(w,s)is the number of derived
alleles for individualiat sites. Missing genotype data are then
implicitly incorporated in a Bayesian manner using the prior from the sample allele frequencies.
Additionally, the Cmatrix is weighted by the probability
of each site being variable. This is motivated by the fact that, at low to medium sequencing coverage, sites that have
a small probability of being variable in the sample can have
a small but nonnegligible contribution to the matrix C. As
they are several orders of magnitude more invariable than variable sites, this can have a profound effect on the analy-ses, even when weighting with genotype probabilities. In-stead of using an arbitrary discrete SNP calling, or minor allele frequency, cut-off, we propose weighting sites accord-ing to their probability of beaccord-ing variable.
We, therefore, estimate the matrixCas (forw6¼y)
Cðw;yÞ¼
1
Pm s¼1Pvar;s
Xm
s¼1
P2
Gðw;sÞ¼0 P2
Gðy;sÞ¼0
Gðw;sÞ22^ps
Gðy;sÞ22^ps
P
Gðw;sÞXðw;sÞ
P
Gðy;sÞXðy;sÞ
Pvar;s ^
psð12^psÞ
; (19)
where the probability of sitesbeing variable,Pvar,s, is
com-puted as
Pvar;s¼12
pð0Þ
s þpðs2nÞ
: (20)
We emphasize that this approach does not provide a form of
Bayesian PCA analysis. Rather, it is a modification of the
Pat-tersonet al.(2006) approach for PCA analysis in the context
of population genetics, modified to incorporate uncertainty in
genotype calls by using an appropriate weighting of different genotypes using their respective posterior probabilities.
Note that we estimate the joint posterior of the genotype probabilities for the two individuals using the product of
their marginal genotype probabilities, i.e., we estimate
P(G(w,s), G(y,s)|X(w,s), X(y,s)) by P(G(w,s)|X(w,s))P(G(y,s)|X(y,s)).
P(G(w,s)|X(w,s)) and P(G(y,s)|X(y,s)) are not independent as
they are correlated through the underlying estimate of ge-notype frequencies affecting the prior. However, as these analyses are carried out conditional on an estimated allele frequency, the approximation is accurate, although it ignores the sampling variance in the estimate of the allele frequency.
Conditional on the allele frequency, P(G(w,s)|X(w,s)) and
P(G(y,s)|X(y,s)) are independent.
We also note that
E
2 4 X2
Gðw;sÞ¼0
X2
Gðy;sÞ¼0
Gðw;sÞ22^ps
Gðy;sÞ22^ps
PGðw;sÞXðw;sÞ
PGðy;sÞXðy;sÞ
3 5¼0
(21)
for unrelated individuals under HWE assuming known allele frequencies and a HWE-derived prior for the genotype probabilities. This shows that the covariance function for unrelated individuals is in fact expected to be zero using this estimator, a necessary and desirable property for the method
to perform well. Proof of Equation 21 is provided in the
Ap-pendix. As we argue, the resulting PCA is greatly improved over naïve methods using genotype calling under all the ex-plored scenarios.
This approach could be extended to different strategies to perform PCA from a matrix of genotype posterior
probabil-ities, for instance, ML methods that account for noise
contributions of each variable (Wentzell et al. 1997) or
Bayesian methods that use external information about the
data (Nounouet al.2002).
Simulating sequencing data for multiple populations
We performed simulations to compare the performance of these methods to estimate population genetic differentia-tion, as well as to quantify the genotyping and SNP calling accuracy, under a broad range of experimental conditions.
As in previous studies (Kimet al.2010, 2011), we simulated
sequencing data rather than raw sequencing reads for
com-putational efficiency. We treated sites as independent of
each other and simulated genotypes for each individual
as-suming HWE and a specific population allele frequency.
Spe-cifically, we repeated the following procedure for each site.
First, for each site, we drew an ancestral allele frequency
pancfrom a distribution in [531023, 12(531023)] with
density proportional to 1/x. This distribution is the expected
allele frequency distribution under a standard neutral infinite
sites model, truncated at the boundaries corresponding to
a population size of 200 individuals (see, e.g., Ewens
2004). We then simulated allele frequencies for two
popula-tions using the Balding–Nichols model (Balding and Nichols
1995) with mean equal topanc, as in previous studies
(Pritch-ard and Donnelly 2001; Priceet al.2006). We simulated two
independent samples, conditionally onFSTandpanc, from this
distribution to obtain allele frequencies for two populations (see Equation 5). From these population allele frequencies, we assigned genotypes according to HWE for each individual.
To simulate data from three populations, we first drew
population allele frequencies from the Balding–Nichols
model for two populations as described above. We then
assigned thefirst allele frequency to population 1 and used
the second allele frequency as the ancestral allele frequency for populations 2 and 3. We then drew two population allele
frequencies from the Balding–Nichols model for a different
value ofFSTand assigned these allele frequencies to
To simulate NGS data, the number of reads at each locus for each individual was simulated from a Poisson
distribu-tion as in Kimet al.(2010, 2011). Additionally, errors were
randomly introduced uniformly among nucleotides at a rate of 0.0075. This value is comparable to error rates found in previous studies (1000 Genomes Project Consortium 2010; Liet al.2010; Yiet al.2010). The probability of a site being
polymorphic, Pvar, was varied from 0.02 to 1.
We computed genotype likelihoods from simulated sequencing reads. Genotype likelihoods depend on both base calls and quality scores and are proportional to the
probability, P(X|G), of the observed read data,X, at a site
for each individual given a certain genotypeG. In the
sim-plest possible case, for read z at sites, we calculated the
genotype likelihood of a particular base v,L(z,v,s) withv 2
{A, C, G, T} asL(z,v,s)= (12e) ifvis the observed base at
readz, andL(z,v,s)=e/3 otherwise. Hereeis the
sequenc-ing error used in the simulation settsequenc-ing. There are many
other methods for estimating e, including methods for
es-timating it directly from the data (e.g., Kim et al. 2011).
Genotype likelihoods at site s for individual w are then
calculated by taking the product of the likelihoods over
allrreads:
PXðw;sÞGðw;sÞ¼v1v2
¼ 1
2r
Yr
z¼1
Lðz;v1;sÞþLðz;v2;sÞ
: (22)
Using this procedure, we computed genotype likelihoods for each individual at each site for all 10 possible genotypes. We then computed posterior probabilities of genotypes and sample allele frequencies, as previously described (see Equation 9).
When calling genotypes, we assigned genotypes with
a posterior probability ,0.90 as missing data. We removed
sites where more than half of the individuals had missing
genotypes. With this procedure, wefiltered25% of the total
sites at 23sequencing coverage. We computedFSTonly on
nonmissing genotypes, while for PCA we imputed missing data with genotypes with the highest posterior probability.
To assess the accuracy of the per-site estimates ofFST, we
simulated two data sets of 10k and 1k sites for each exper-imental scenario to evaluate method-of-moments and ML
estimates, respectively, with FST varying from 0.01 to 0.4,
and withPvar= 1. We verified convergence of optimization
algorithms for ML estimators of FST and discarded sites
where this condition was not met. We also simulated 1M sites by concatenating 100 sets of 10k simulated sites with
FST values drawn from a Normal distribution N(0.2, 0.2)
truncated at 0.02 and 0.90, and Pvar= 0.10 to assess the
accuracy of multiple-sites estimates ofFST. We simulated 20
individuals per population at low (23), medium (63), and
high (203) sequencing coverage.
To evaluate the performance of different methods for
estimating FST, we calculated two measures of deviation
from the trueFSTovermsites: the root-mean-square
devia-tion (RMSD), RMSD¼ ffiffiffiffiffiffiffiffiffiffiffiffiffiffiffiffiffiffiffiffiffiffiffiffiffiffiffiffiffiffiffiffiffiffiffiffiffiffiffiffiffi 1 m Xm
s¼1
^
Fð
sÞ
ST2F
ðsÞ
ST 2 v u u t (23)
and mean bias
Mean bias¼1
m
Xm
s¼1
^
FðSTsÞ2FðSTsÞ; (24)
whereFSTðsÞand^F
ðsÞ
STis the estimatedFSTat sitesfrom the case
of known genotypes and sequencing data, respectively. To evaluate the accuracy of the PCA method, we
simulated 10k sites for each scenario with values of FST
ranging from 0.02 to 0.4 and with Pvar= 0.02, 0.1, or 1.
We simulated three populations with 20 individuals each at
23, 63, and 203sequencing coverage. We performed 10
distinct simulations for each experimental condition to as-sure robustness of our results. We assessed the accuracy of
inferred PCA plots using Procrustes analysis (Wang et al.
2010). Briefly, we measured the deviation of PC1 and PC2
computed from the case of known genotypes and the case of unknown genotypes using sum-of-squares (SS), where SS
values closer to 0 indicate betterfits.
Applications to real data
We analyzed a data set of wild and domesticated species of
silkworm,B. mori(Xiaet al.2009). The data consisted of 40
samples representing 29 domesticated lineages and 11 wild lineages. Domesticated lineages are phenotypically and geo-graphically separated into subgroups while all wild lineages are from China. Samples were sequenced at an approximate
mean per-site coverage of 33. We analyzed chromosome 2
using the original genotype likelihoods by removing sites where we had no information for at least one individual. Details on the calculation of genotype likelihoods can be
found in the original article (Xiaet al.2009). Approximately,
200,000 sites were analyzed in total.
We computed posterior probabilities of sample allele frequencies and genotypes using ANGSD software (available at http://www.popgen.dk/angsd). We then performed PCA
and estimated FST using the new proposed methods
imple-mented in a set of C/C++ programs (available at https://
github.com/mfumagalli/ngstools). All statistical analyses were
performed in the R environment (http://www.r-project.org).
Results
Quantifying population genetic differentiation from sequencing data
We performed extensive simulations to evaluate the
accu-racy of estimating FST using different methods and under
different conditions. We first evaluated the accuracy of
method-of-moments estimates of per-site FST based on
called genotypes. Specifically, we assign genotypes for each
individual based on the the highest genotype posterior
representative of strategies currently used for genotype call-ing, and it provides better genotype and SNP calling accu-racies than other genotype calling strategies examined here (Table S1,Table S2, andTable S3).
We then obtain a method-of-moments estimator of FST
from NGS data without calling genotypes by using posterior probabilities of sample allele frequencies, which allows us to compute expected genetic variance components between
and within populations (see Materials and Methods). Here,
we employ Equation 15 to estimate the 2D-SFS and use it as
a prior as in Equation 16. We call this estimator^FST:Ev.
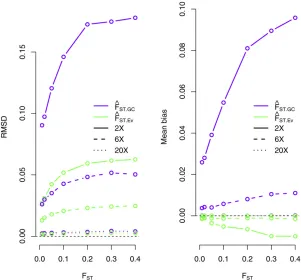
Results show that this new method performs substan-tially better than the method based on genotype calling under the experimental conditions explored in this study,
especially at low sequencing coverage (Figure 1). ^FST:Ev
tends to underestimate the true value ofFSTat 23coverage,
but this bias is reduced at 63coverage (Figure 1). We
ob-serve accuracy in our estimates that are comparable to that of methods based on genotype calling for high coverage sequencing data. We obtain similar results when using the
true 2D-SFS as a prior (Figure S1). We also observe that at
23coverage,^FST:Evis more accurate for estimatingFSTthan
estimators based on computing the expected allele
fre-quency for each population (see File S1 and Table S4),
which overestimatesFST(Figure S2).
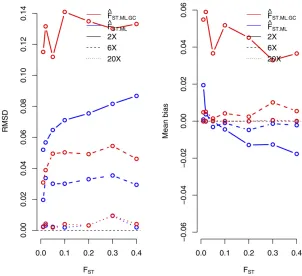
Next, we compared the accuracy of a ML estimator ofFST
from called genotypes under the Balding–Nichols model,
FST.ML.GC, to the proposed estimator based on the full
likeli-hood under the same model while taking genotype calling
uncertainty into account, FST.ML (see Materials and
Meth-ods). The results show thatFST.MLoutperforms the method
based on calling genotypes at 23and 63coverage (Figure
2). For higher sequencing coverage, both methods perform very similarly. We also observe that ML estimates of the ancestral population allele frequency are highly correlated
with the true values (Figure S3).
We also test the accuracy of estimating multiple-sitesFST
on 10k sites from a larger set of 1M simulated positions where only 10% of the sites are variable in the population (seeMaterials and Methods). For this particular analysis we chose the method-of-moments estimator because of its nat-ural extension to multiple-sites estimation (Equation 4). At
23 sequencing coverage we underestimate the true FST
(Figure S4). This bias diminishes at 63and disappears at
203. When we use the true 2D-SFS as a prior at 23
se-quencing coverage, we underestimate the trueFSTwhen this
value is above the whole-region average (approximately
equal to 0.25), while we overestimate the true FST when
this value is below the whole-region average (Figure S4).
This bias is derived from using the 2D-SFS estimated from
the entire region as a prior. At 63 and 203 sequencing
coverage we observed unbiased estimates using the true
2D-SFS as a prior (Figure S4).
Principal components analysis
In traditional PCA, genotypes are called at each site for each individual. We explore an alternative approach based on the genotype posterior probabilities for each individual at each
site (seeMaterials and Methods).
At low sequencing coverage, the new method, which does not rely on SNP or genotype calling, produces PCA plot results that are essentially identical to those that use known
Figure 1 RMSD (left) and mean bias (right) for
method-of-moments estimates ofFSTunder different sequencing
coverage (23, 63, and 203). We compared the accuracy
of the new method, which does not rely on genotype
callingð^FST:EvÞ, and a method based on allele frequencies
estimated from called genotypesð^FST:GCÞ(seeMaterials
genotypes (Figure 3). By contrast, direct genotype calling at low sequencing coverage generally leads to a loss in the ability to cluster individuals according to populations, which is a problem that may persist even after removing outlier individuals (Figure 3).
We replicated thesefindings under many different
exper-imental conditions and for multiple independent simulations and assessed the accuracy of PCA plots using SS values from
PC1 and PC2 computed from known genotypes (seeMaterials
and Methods). The new method provides better accuracy than the method based on genotype calling for all tested scenarios,
even at medium sequencing coverage (Figure S5). Generally,
we obtain lower SS values without normalization of the stan-dardized allele frequencies (see Equation 18), and the new method still outperforms an approach based on called
geno-types at low sequencing coverage (Figure S6). We next
sim-ulated only variable sites data at high sequencing coverage to produce an ideal scenario for genotype calling. As expected, procedures based on calling genotypes lead to accurate PCA
results under these conditions (Figure S7).
Notably, weighting each site by its probability of being variable gives higher accuracy than simply weighing all sites equally, especially when there are only a few variable sites in
the sample (Figure S8). This proposed method also performs
better than an approach based on computing expected
gen-otypes from genotype posterior probabilities (Skotte et al.
2012; Gompert et al.2012) for low coverage data (Figure
S9). We also simulated one population with no genetic
structure but where half of the individuals were sequenced
at low coverage (23) while the rest were sequenced at high
coverage (203). We still observe an improvement in the
accuracy of the inferred PCA plots (Figure S10).
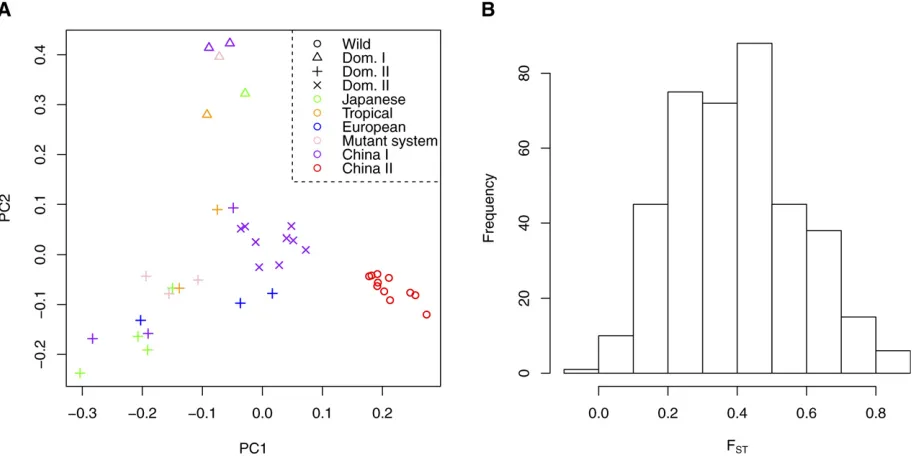
Analysis of real data
To illustrate the performance of the herein proposed methods, we applied them to a data set of low-coverage
sequencing data. Specifically, we investigate the population
structure of wild and domesticated silkworm samples (Xia
et al.2009). Despite using only a single chromosome of the
entire silkworm data set, we were able to detect fine-scale
population genetic structure. Indeed, thefirst component of
the PCA plot generated using the new method, which takes statistical uncertainty in genotype calling into account, shows a clear separation between wild and domesticated lineages (Figure 4A). Moreover, the second component divides the different lineages of domesticated silkworms into
their subgroups (Figure 4A). Thefirst two principal
compo-nents explain 6.8 and 5.2% of the total genetic variation, respectively. Of note is that we achieve a better separation among the subgroups than in the original study using whole-genome sequence data, where several subgroups
ap-pear to be intermixed (Xiaet al.2009).
We then applied naïve strategies of performing PCA based on called genotypes using the maximum genotype likelihood or genotype posterior probability at each site for each individual. Results show several outlier individuals, which may be the effect of systematically misassigned
het-erozygous sites (Figure S11). However, when including only
sites with estimated allele frequency greater or equal to two, and using genotype calling based on genotype posterior
Figure 2 RMSD (left) and mean bias (right) for
maximum-likelihood estimates ofFSTunder different sequencing
cov-erage (23, 63, and 203). We compared accuracy of the
new method, which does not rely on genotype calling
ð^FST:MLÞ, and the standard method applied to called
gen-otypes.ð^FST:ML:GCÞ(seeMaterials and Methods). We
probabilities, we see a more accurate representation of the
genetic structure. (Figure S11). A similar result using this
allele frequency-filtered data set is obtained using the new
proposed method that does not rely on genotype calling (Figure S11). Nonetheless, the new method applied to all of the data provides larger fractions of explained variance
than the method based on genotype calling (Figure S12).
Finally, we estimatedFSTbetween wild and domesticated
samples for 20-kb nonoverlapping genomic windows. We used the folded 2D-SFS due to uncertainty in assigning the ancestral and derived state of alleles. The distribution
of the estimated FST values in 20-kb windows has mode
around 0.4 (Figure 4B), which is larger than what was found
in the original study (Xiaet al.2009).
Discussion
NGS technologies are now an essential tool for population genetic studies. However, genotyping uncertainty associated with low sequencing coverage and high sequencing error
can drastically bias downstream analyses (Nielsen et al.
2011). A recent study assessed the power to detect selective events and infer demographic scenarios as a function of sequencing coverage and error (Crawford and Lazzaro 2012). The results of the study show that weak selective events are hardly detectable, and inferences of population
size changes are systematically biased for low-coverage data
(,103) (Crawford and Lazzaro 2012). Interestingly, the
authors determined that population genetic differentiation was underestimated, even at medium to high sequencing coverage, suggesting that multipopulation analyses are even more sensitive to inaccuracy of NGS data (Crawford and Lazzaro 2012).
In this study, we take full advantage of a recently proposed Bayesian approach to taking sequencing data
uncertainty into account (Li 2011; Nielsenet al.2012). This
method involves computing posterior probabilities for each genotype and all possible sample allele frequencies from genotype likelihoods. Estimation of classic population ge-netic parameters within this new probabilistic framework
has previously been suggested (Yiet al.2010; Li 2011;
Niel-sen et al.2012) and in some cases implemented (Yi et al.
2010; Gompert and Buerkle 2011; Kang and Marjoram 2011). For instance, Gompert and Buerkle (2011) proposed a hierarchical Bayes model for genomic population struc-ture. Their method accounts for uncertainty in sampling sequencing reads and measured population differentiation
in terms of haplotype distances. Also, Skotte et al. (2012)
and Gompert et al. (2012) used genotype expectations
rather than called genotypes for the analysis of population structure. Here, we developed new methods for quantifying
population genetic differentiation in terms of FST without
Figure 3 PCA plots from known genotypes, called genotypes using genotype posterior probabilities with or without outlier individuals, and using the new method without calling
genotypes (see Materials and Methods). We
simulated three populations of 20 individuals
each at 23sequencing coverage. Colors are
coded according to each simulated population. Purple and green/red populations are
differen-tiated by anFST of 0.4 while green and red
populations are differentiated by an FST of
relying on SNP or genotype calling. We simulated NGS data to assess the accuracy of these new estimators under a wide range of experimental scenarios.
Herein proposed methods for computing
method-of-moments FSTestimators, based on computing the posterior
expected genetic variance components (see Materials and
Methods), offer a solution to the lack of accuracy for low coverage data and outperform other examined estimators under all tested conditions (Figure 1). While the improve-ment offered by the new method is greatest and most notice-able at low coverage, even at medium sequencing coverage,
it results in less biased estimates ofFST(Figure 1). Similarly,
ML estimation ofFSTthat accounts for uncertainty in
geno-type calls outperforms a method based on genogeno-type calling
at low and medium coverage (Figure 2). These findings
suggest that the framework presented in this study can be
easily extended to other FST estimators. Overall, these
results highlight the importance of taking statistical uncer-tainty into account when computing population genetic dif-ferentiation from NGS data. The great improvement in accuracy for low coverage data can be explained by the fact that we do not call SNPs or genotypes. We can thus avoid introducing errors during these processes, which can be par-ticularly problematic for downstream analyses.
Errors introduced by calling SNPs and genotypes for low coverage and quality data can be even more evident when investigating population structure with PCA. Simple geno-type calling provides very little ability to accurately identify structure using PCA for low coverage data. However, the new method based on genotype posterior probabilities provides PCA plots that are almost identical to cases in which true genotypes are known (Figure 3). Accuracy in identifying population structure can be recovered when
call-ing genotypes by removcall-ing outlier individuals, low-quality sites, and low-frequency variants, but at the price of losing potential important information. Skoglund and Jakobsson (2011) investigated population structure by randomly sam-pled one read from each individual at each position. In this way they could compare modern, high-quality data with the low-pass ancient data. A disadvantage of this method is the loss of information associated with using only a single read from each individual, especially in the presence of sequenc-ing errors.
We applied methods proposed in this study to a data set comprising 40 silkworm samples sequenced at low coverage (Xiaet al.2009). We used only a single chromosome of the original data set and we did not apply any criteria for SNP
calling. Despite this, we were able to obtain afine-scale map
of population genetic structure, clearly separating wild and domesticated lineages of silkworm samples (Figure 4A). The
first principal component separates domesticated and wild
varieties, while the second component accurately divides the domesticated lineage into subgroups. Genotype calling from genotype posterior probabilities can provide an overall sim-ilar representation of the genetic structure when using a
con-servative initial filtering of data.
Genotype calling using stringent datafiltering and a
con-servative approach for SNP calling and rare variants removal
may be sufficient to give an overall picture of the genetic
population structure, for example, a reasonably
representa-tive PCA. Other analyses, such as estimation ofFST, that rely
on accurate estimates of allele frequencies may be more
dif-ficult to rescue by conservativefiltering because afixed
cut-off for SNP calling cannot provide unbiased estimates of allele
frequencies (e.g., Johnson and Slatkin 2008). Furthermore,
the accuracy of genotype calling can be improved for human
Figure 4 (A) PCA plot for wild and domesticatedB. morisamples using the method proposed in this study. (B) Distribution ofFSTbetween wild and
data by using imputation or haplotype-based genotype-calling
methods (e.g., Zhiet al.2012), although such approaches are
not as easily applicable to most other species. The poor per-formance of PCA after calling genotypes may largely be a re-sult of inaccuracies in SNP calling rather than a consequence of erroneous genotype calls at variable sites. However, when simulating sequences with a larger proportion of polymor-phic sites the new method still outperforms traditional methods, even in the case of an uneven sequencing
cover-age among individuals (Figure S10). While more sophisticated
approaches have been developed to perform accurate SNP
calling (e.g., Kimet al.2011), calling polymorphic sites using
all individuals may result in ascertainment biases, which can
influence estimates of population structure and divergence
(Albrechtsenet al.2010). Additionally, a stringent
SNP-call-ing strategy implies that a large amount of data is discarded from the analyses, potentially leading to loss of important features of the data. For example, low-frequency variants, which are more likely to be removed in a conservative SNP calling strategy, can effectively distinguish closely related pop-ulations. Moreover, highly differentiated SNPs among popula-tions, which may be related to genetic adaptation, might be lost in some analyses.
Like any other method for SNP-calling and allele-frequency estimation, the approach herein discussed is sensitive to the underlying base-calling algorithm and to the accuracy of quality scores. By improving accuracy and quality scores, current and future base callers can both reduce sequencing costs and increase accuracy of all downstream analyses of genetic variation. Furthermore,
data filtering is a complex procedure when sequencing
quality is low (e.g., Minocheet al.2011). Many other
pro-tocols, other than the ones used in this article, can be adop-ted to minimize the genotypes assignment bias.
We implemented the new proposed methods for
estimat-ingFSTand perform PCA from NGS data in a fast, portable,
and memory-efficient set of C/C++ programs and
distrib-uted on a public repository for shared development. These
programs are directly integrated with ANGSD (http://www.
popgen.dk/angsd), a software for the analysis of NGS data and easily integrable with other common software such as
SAMtools (Li et al.2009) or GATK (Mckenna et al.2010).
The computational cost associated with the new methods is
slightly higher than that of standard approaches (Table S5
and Table S6). However, the increased computational bur-den is mostly associated with the computation of sample allele frequency posterior probabilities, which can be used for additional analyses. Notably, the computational cost should not be prohibitive for any existing data sets.
As NGS technologies become more ubiquitous and affordable, the frequency of large-scale population genetic and quantitative studies will certainly increase. The methods presented in this article provide tools for investigating genetic variation for multiple populations at large scales directly from high-throughput sequencing data.
Acknowledgments
We are grateful to Michael DeGiorgio and Gaston Sanchez at the University of California, Berkeley, CA, for helpful discussions. We thank Shiping Liu and Zengli Yan at Beijing Genomics Institute, Shenzhen, China, for testing previous versions of the programs, and three anonymous reviewers for insightful comments on the manuscript. M.F. is sup-ported by EMBO Long-Term Post-doctoral Fellowship (ALTF 229-2011). T.L. is supported by National Institutes of Health (NIH) Genomics Training Grant (Grant T32HG000047-13). E.H.S. is supported by National Science Foundation grant DBI-0906065 and NIH grant 3R01HG03229-08S2. R.N. is supported by NIH grant 3R01HG03229-07.
Literature Cited
1000 Genomes Project Consortium, 2010 A map of human
ge-nome variation from population-scale sequencing. Nature 467 (7319): 1061–1073.
1000 Genomes Project Consortium, 2012 An integrated map of
genetic variation from 1,092 human genomes. Nature 491 (7422): 56–65.
Albrechtsen, A., F. C. Nielsen, and R. Nielsen,
2010 Ascertainment biases in snp chips affect measures of
population divergence. Mol. Biol. Evol. 27(11): 2534–2547. Auton, A., A. Fledel-Alon, S. Pfeifer, O. Venn, L. Segurel et al.,
2012 A fine-scale chimpanzee genetic map from population
sequencing. Science 336(6078): 193–198.
Balding, D. J., 2003 Likelihood-based inference for genetic corre-lation coefficients. Theor. Popul. Biol. 63(3): 221–230.
Balding, D. J., and R. A. Nichols, 1995 A method for quantifying
differentiation between populations at multi-allelic loci and its implications for investigating identity and paternity. Genetica 96 (1–2): 3–12.
Beaumont, M. A., and D. J. Balding, 2004 Identifying adaptive
genetic divergence among populations from genome scans. Mol. Ecol. 13(4): 969–980.
Crawford,, J. E.,, and B. P. Lazzaro, 2012 Assessing the accuracy and power of population genetic inference from low-pass next-generation sequencing data. Frontiers Genet. 3: 66.
Ewens, W., 2004 Mathematical Population Genetics: Theoretical
Introduction. Springer-Verlag, New York.
Fletcher, R., 1987 Practical Methods of Optimization, Ed. 2. Wiley-Interscience, New York.
Foll, M., and O. Gaggiotti, 2008 A genome-scan method to
iden-tify selected loci appropriate for both dominant and codominant markers: a Bayesian perspective. Genetics 180: 977–993.
Gompert, Z., and C. A. Buerkle, 2011 A hierarchical bayesian
model for next-generation population genomics. Genetics 187: 903–917.
Gompert, Z., L. K. Lucas, C. C. Nice, J. A. Fordyce, M. L. Forister
et al., 2012 Genomic regions with a history of divergent
selec-tion affectfitness of hybrids between two butterfly species. Evo-lution 66(7): 2167–2181.
Hellmann, I., Y. Mang, Z. Gu, P. Li, F. M. de la Vega et al.,
2008 Population genetic analysis of shotgun assemblies of
ge-nomic sequences from multiple individuals. Genome Res. 18(7): 1020–1029.
Holsinger, K. E.,, P. O. Lewis, and D. K. Dey, 2002 A Bayesian approach to inferring population structure from dominant markers. Mol. Ecol. 11(7):1157–1164.
Huang, X., N. Kurata, X. Wei, Z. X. Wang, A. Wanget al., 2012 A map of rice genome variation reveals the origin of cultivated rice. Nature 490(7421): 497–501.
Hudson, R. R., M. Slatkin, and W. P. Maddison, 1992 Estimation
of levels of geneflow from dna sequence data. Genetics 132:
583–589.
Johnson, P. L., and M. Slatkin, 2008 Accounting for bias from
sequencing error in population genetic estimates. Mol. Biol. Evol. 25(1): 199–206.
Kang, C. J., and P. Marjoram, 2011 Inference of population
mu-tation rate and detection of segregating sites from next-genera-tion sequence data. Genetics 189: 595–605.
Keightley, P. D., and D. L. Halligan, 2011 Inference of site
fre-quency spectra from high-throughput sequence data: quantifi
-cation of selection on nonsynonymous and synonymous sites in humans. Genetics 188: 931–940.
Kim, S. Y., Y. Li, Y. Guo, R. Li, J. Holmkvistet al., 2010 Design of association studies with pooled or un-pooled next-generation sequencing data. Genet. Epidemiol. 34(5): 479–491.
Kim, S. Y., K. E. Lohmueller, A. Albrechtsen, Y. Li, T. Korneliussen
et al., 2011 Estimation of allele frequency and association
mapping using next-generation sequencing data. BMC Bioinfor-matics 12: 231.
Li, H., 2011 A statistical framework for snp calling, mutation discov-ery, association mapping and population genetical parameter esti-mation from sequencing data. Bioinformatics 27(21): 2987–2993.
Li, H., B. Handsaker, A. Wysoker, T. Fennell, J. Ruan et al.,
2009 The sequence alignment/map format and samtools.
Bio-informatics 25(16): 2078–2079.
Li, Y., N. Vinckenbosch, G. Tian, E. Huerta-Sanchez, T. Jianget al.,
2010 Resequencing of 200 human exomes identifies an excess
of low-frequency non-synonymous coding variants. Nat. Genet. 42(11): 969–972.
Lynch, M., 2009 Estimation of allele frequencies from high-cover-age genome-sequencing projects. Genetics 182: 295–301. Marchini, J. L., and L. Cardon, 2002 Discussion on the meeting on
statistical modelling and analysis of genetic data. J. R. Stat. Soc. Series B Stat. Methodol. 64(4): 737–775.
McKenna, A., M. Hanna, E. Banks, A. Sivachenko, K. Cibulskiset al.,
2010 The genome analysis toolkit: a mapreduce framework
for analyzing next-generation dna sequencing data. Genome Res. 20(9): 1297–1303.
Metzker, M. L., 2010 Sequencing technologies: the next
genera-tion. Nat. Rev. Genet. 11(1): 31–46.
Minoche, A. E., J. C. Dohm, and H. Himmelbauer,
2011 Evaluation of genomic high-throughput sequencing data
generated on illumina hiseq and genome analyzer systems. Ge-nome Biol. 12(11): R112.
Nicholson, G., A. V. Smith, F. Jonsson, O. Gustafsson, K. Stefansson
et al., 2002 Assessing population differentiation and isolation
from single-nucleotide polymorphism data. J. R. Stat. Soc. Se-ries B Stat. Methodol. 64: 695–715.
Nielsen, R., 2005 Molecular signatures of natural selection. Annu. Rev. Genet. 39: 197–218.
Nielsen, R., J. S. Paul, A. Albrechtsen, and Y. S. Song,
2011 Genotype and snp calling from next-generation
sequenc-ing data. Nat. Rev. Genet. 12(6): 443–451.
Nielsen, R., T. Korneliussen, A. Albrechtsen, Y. Li, and J. Wang,
2012 Snp calling, genotype calling, and sample allele
fre-quency estimation from new-generation sequencing data. PLoS ONE 7(7): e37558.
Nounou, M. N., B. R. Bakshi, P. K. Goel, and X. Shen, 2002 Bayesian principal component analysis. J. Chemometr. 16: 576–595. Patterson, N., A. L. Price, and D. Reich, 2006 Population structure
and eigenanalysis. PLoS Genet. 2(12): e190.
Press, W., S. Teukolsky, W. Vetterling, and B. Flannery,
2007 Numerical Recipes: The Art of Scientific Computing, Ed.
3. Cambridge University Press, Cambridge, UK.
Price, A. L., N. J. Patterson, R. M. Plenge, M. E. Weinblatt, N. A. Shadicket al., 2006 Principal components analysis corrects for stratification in genome-wide association studies. Nat. Genet. 38 (8): 904–909.
Pritchard, J. K., and P. Donnelly, 2001 Case-control studies of
association in structured or admixed populations. Theor. Popul. Biol. 60(3): 227–237.
Reynolds, J., B. S. Weir, and C. C. Cockerham, 1983 Estimation of the coancestry coefficient: basis for a short-term genetic dis-tance. Genetics 105: 767–779.
Rice, S. H., 2008 A stochastic version of the price equation reveals the interplay of deterministic and stochastic processes in evolu-tion. BMC Evol. Biol. 8: 262.
Rice, S. H., and A. Papadopoulos, 2009 Evolution with stochastic
fitness and stochastic migration. PLoS ONE 4(10): e7130.
Riebler, A., L. Held, and W. Stephan, 2008 Bayesian variable
se-lection for detecting adaptive genomic differences among pop-ulations. Genetics 178: 1817–1829.
Rubin, C. J., M. C. Zody, J. Eriksson, J. R. Meadows, E. Sherwood
et al., 2010 Whole-genome resequencing reveals loci under
selection during chicken domestication. Nature 464(7288): 587–591.
Skoglund, P., and M. Jakobsson, 2011 Archaic human ancestry in
East Asia. Proc. Natl. Acad. Sci. USA 108(45): 18301–18306. Skotte, L., T. S. Korneliussen, and A. Albrechtsen, 2012 Association
testing for next-generation sequencing data using score statistics. Genet. Epidemiol. 36(5): 430–437.
Wang, C., Z. A. Szpiech, J. H. Degnan, M. Jakobsson, T. J.
Pember-tonet al., 2010 Comparing spatial maps of human
population-genetic variation using procrustes analysis. Stat. Appl. Genet. Mol. Biol. 9(1): 13.
Weir, B. S., 1996 Genetic Data Analysis II. Sinauer Associates,
Sunderland, MA.
Weir, B. S., and C. C. Cockerham, 1984 Estimating f-statistics for the analysis of population structure. Evolution 38: 1358–1370. Weir, B. S., and W. G. Hill, 2002 Estimating f-statistics. Annu. Rev.
Genet. 36: 721–750.
Wentzell, P. D., D. Andrews, D. C. Hamilton, F. Faber, and B. R.
Kowalski, 1997 Maximum likelihood principal component
analysis. J. Chemometr. 11: 339–366.
Wright, S. 1951 The genetical structure of populations. Ann.
Eu-genics 15: 323–354.
Xia, Q., Y. Guo, Z. Zhang, D. Li, Z. Xuanet al., 2009 Complete
resequencing of 40 genomes reveals domestication events and
genes in silkworm (bombyx). Science 326(5951): 433–436.
Xu, X., X. Liu, S. Ge, J. D. Jensen, F. Huet al., 2011 Resequencing 50 accessions of cultivated and wild rice yields markers for identifying agronomically important genes. Nat. Biotechnol. 30(1): 105–111.
Yi, X., Y. Liang, E. Huerta-Sanchez, X. Jin, Z. X. Cuo et al.,
2010 Sequencing of 50 human exomes reveals adaptation to
high altitude. Science 329(5987): 75–78.
Zhi, D., J. Wu, N. Liu, and K. Zhang, 2012 Genotype calling from
next-generation sequencing data using haplotype information of reads. Bioinformatics 28(7): 938–946.
Appendix
LetGiandXibe random variables representing the genotype and read data, respectively, from individuali. Likewise, letgibe
a realization ofGi, and letxibe a realization ofXi,i= 1, 2. We then wish to prove that
EX1;X2 "
X
g1 X
g2
ðg12E½G1Þðg22E½G2Þpðg1jx1Þpðg2jx2Þ
#
¼0; (A1)
where the sums, here and in the following, are over all supported values of the variable under the summation sign. We use
a simplified notation so that expectation operators implicitly are taken with respect to the random variable(s) inside the
argument of the expectation operator, except when otherwise indicated by the use of subscripts. Also, we use the short-hand
notation p(gi) for the probability of the random variableGitaken on the valuegi.
First note that, for unrelated individuals,G1andG2are independent and thatX1andX2are independent assuming afixed
known allele frequency and assuming random mating. Next also note that
EXi½gipðgijxiÞ¼gipðgiÞ (A2)
and
EXi½pðgijxiÞ ¼pðgiÞ: (A3)
Then
EX1;X2 "
P
g1 P
g2
ðg12E½G1Þðg22E½G2Þpðg1jx1Þpðg2jx2Þ
#
¼P
g1 P
g2
EX1;X2½g1g2pðg1jx1Þpðg2jx2Þ2EX1;X2½g1E½G2pðg1jx1Þpðg2jx2Þ
þEX1;X2½g2E½G1pðg1jx1Þpðg2jx2Þ þEX1;X2½g1g2pðg1jx1Þpðg2jx2Þ
¼P
g1 P
g2
ðEX1½g1pðg1jx1ÞEX2½g2pðg2jx2Þ2EX1½g1pðg1jx1ÞEX2½E½G2pðg2jx2Þ 2EX2½g2pðg2jx2ÞEX1½E½G1pðg1jx1Þ þEX1½g1pðg1jx1ÞEX2½g2pðg2jx2ÞÞ
¼P
g1 P
g2
ðg1g2pðg1Þpðg2Þ2g1pðg1ÞE½G2pðg2Þ2g2pðg2ÞE½G1pðg1ÞþE½G1E½G2pðg1Þpðg2ÞÞ
¼E½G1E½G22E½G1E½G22E½G2E½G1þE½G1E½G2
¼0:
The interchange of summations in thefirst step is justified because all sums arefinite. The second equality is true because
of the independence assumption. The third equality is verified by substitution of the expressions in (A2) and (A3). The fourth
GENETICS
Supporting Information
http://www.genetics.org/lookup/suppl/doi:10.1534/genetics.113.154740/-/DC1
Quantifying Population Genetic Differentiation
from Next-Generation Sequencing Data
Matteo Fumagalli, Filipe G. Vieira, Thorfinn Sand Korneliussen, Tyler Linderoth,
Emilia Huerta-Sánchez, Anders Albrechtsen, and Rasmus Nielsen