ABSTRACT
O’JANPA, JOHN VICTOR. Lateral Pressures of Fresh Concrete on Wall Formwork under
High Rates of Placement (Under the direction of Dr. David W. Johnston).
Current ACI guidelines for the design of formwork contain equations for the prediction of the
lateral pressure of concrete exerted on the form which consider the rate of vertical rise of the
concrete in the form, the temperature of the concrete, and the effect of various admixtures.
These equations contain limitations on the acceptable slump of the concrete and the
maximum rate of vertical rise during placement. However, in an ever increasing effort to
increase productivity in the construction field, many concrete contractors place concrete in
wall forms under conditions that exceed the equation limitations. The focus of this study is
to create a field measurement system that can be used by future researchers to accurately
measure formwork pressures in a wide range of applications and to gain a better
understanding of the lateral pressure behavior of fresh concrete.
For the experiment, two different data collection systems were created, one utilizing
center-hole load cells which could measure tension forces in a variety of form ties, and the other
consisting of a group of pressure cells that can easily be screwed into many concrete form
facings. A total of nine forms were instrumented in the field with some combination of this
data collecting equipment and lateral pressures were monitored during the concrete
placement.
A lateral pressure distribution was plotted for each placement based on the field
measurements, noting the rate of vertical rise, slump, and temperature of the concrete
mixture. Measured pressures were then compared to those that would be predicted by
various ACI and other equations ignoring the limitations on rate of placement, to test the
Lateral Pressures of Fresh Concrete on Wall Formwork under High Rates of Placement
by:
John Victor O’Janpa III
A Thesis submitted to the Graduate Faculty of North Carolina State University in partial fulfillment of the
requirements for the degree of Master of Science
CIVIL ENGINEERING
Raleigh, North Carolina
August, 2005
Approved by:
_________________________ _________________________ James Nau Michael L. Leming
BIOGRAPHY
John “Vic” O’Janpa was born in Wilmington, North Carolina on February 26th, 1980. He graduated from Topsail High School in 1998. He attended the University of North
Carolina at Wilmington from 1998 to 2000 and transferred to North Carolina State
University where, in 2003, he received his BS in Civil Engineering. While completing his
undergraduate degree requirements, Vic gained coop work experience as an estimator and
assistant project manager for Choate Construction Company.
In January of 2004, he enrolled in the graduate program in the Department of Civil,
Construction, and Environmental Engineering focusing on Construction Engineering and
Management. While also completing classes towards his Master of Science degree, he
worked on a project which investigated the lateral pressures of concrete exerted on concrete
ACKNOWLEDGEMENTS
First and foremost, I would like to express my gratitude to my advisor and principal
investigator, Dr. David W. Johnston. The advice and guidance was invaluable in helping me
to complete this thesis. In addition, I truly appreciate the help in the field with the collection
of data.
Next, I would like to thank the other members of my thesis committee, Dr. Michael
Leming, and Dr. James Nau.
For their help in completing this study, I would like to thank Brett McMahon, Paul
Higgins, and Joe Burns of Miller and Long Concrete Construction. In addition, I would like
to thank Matt Fields and Rick Dunn, Jr. of TriCity Contractors in Raleigh, NC for their
efforts and accommodations in collecting valuable data for this research.
On a personal note, I would like to recognize all of my friends that have supported me
throughout my graduate studies. The advice and opinions of my colleagues in the
Construction Engineering program, namely David Lewis, Michele Inserny, Luis Mata, and
Juan Jose Recalde have been critical to the successful completion of both my class work and
my research. I also appreciate the love and support of my close friends outside of the
program: Lindsay Docherty, Terry Clelland, Josh Lambert, and Chris Breinich.
Finally, I want to express my extreme heart-felt appreciation to my mother and my
father for the love and support that they have given me not only while completing my
graduate studies, but throughout my entire life. I would not be where I am today if I had not
had the foundation of such a wonderful family, and I am thankful for every sacrifice that my
TABLE OF CONTENTS
Page
List of Tables……….. vi
List of Figures……… vii
1. Introduction………. 1
1.1 Background……… 1
1.2 Objective……… 2
1.3 Problem Statement………. 3
2. Review of Literature………... 4
2.1 Early Research………... 4
2.2 Laboratory Experiments……….4
2.2.1 Effects of Form Dimensions and Rate of Placement………. 4
2.2.2 Effects of other Placement Variables………. 6
2.3 Field Experiments in Recent Decades………... 8
2.3.1 Effects of Rate of Placement………..8
2.3.2 Applicability to Walls of Larger Dimensions……… 10
2.3.3 Effects of Extended Set Concrete and Admixtures……… 11
2.4 Results of Recent Studies of Historical Data………..………... 12
2.4.1 Research of Barnes and Johnston……….. 12
2.4.2 Research of Yu and Johnston……… 14
2.5 Current Recommendations of ACI-347………. 15
2.6 Recent Studies in Self-Consolidating Concrete……… 18
3. Research and Testing Equipment………. 25
3.1 Instrumentation Objective………. 25
3.2 Center-Hole Load Cells………. 25
3.3 Flush Diaphragm Pressure Cells……… 29
4. Experimental Procedures……….. 33
4.1 General………... 33
4.2 Modified Aluminum Form Panel………... 33
4.3 Testing of Batch Properties……… 34
4.4 Field Constructed Wooden Formwork………...35
4.4.1 Foundation Wall………. 36
4.4.2 Basement Column………... 38
4.5 Manufactured Aluminum Formwork System………... 40
4.5.1 Specific Conditions for Individual Casting Operations………. 41
4.5.2 Material Properties for Individual Casting Operations………. 46
5. Results………. 48
5.1 Summary of Measured Pressures………..……… 48
5.2 Lateral Pressure Distributions……… 51
6. Discussion and Conclusions……….. 61
6.1 General……….. 61
6.2 Lateral Pressure Distributions……… 61
6.3 Relationship between Placement Conditions and Lateral Pressure……….. 63
6.4 Applicability of Predictive Equations……… 63
6.5 Effects of this Study on Future Research………... 64
6.6 Conclusions……… 65
7. References………...68
8. Appendix………. 71
8.1 Condition Relationship Plots………. 71
8.2 Data Collection Worksheets……….. 79
8.3 Concrete Mixture Proportions………108
8.4 Pressure Cell Calibration………... 111
LIST OF TABLES
Table Page
2.1 Values of Yu and Johnston’s admixture coefficient Cc………. 15
2.2 Values of Yu and Johnston’s form type coefficient Cf………... 15
2.3 Unit weight coefficient Cw……….. 17
2.4 Chemistry coefficient Cc………. 18
3.1 Load cell gage factor log………...………. 27
3.2 Load cell calibration data log………... 27
3.3 Pressure cell gage factor log………... 31
3.4 Pressure cell calibration data log………... 32
4.1 Casting data for wooden form operations………... 40
4.2 Data for wall placements with aluminum forms – in-lb units……….. 46
4.3 Data for wall placements with aluminum forms – SI units ……….. 47
5.1 Summary of data from lateral pressure measurements ……… 49
LIST OF FIGURES
Figure Page
1.1 Typical lateral pressure distribution………... 2
3.1 Center-hole load cell construction………... 26
3.2 Load cell with spacer………. 28
3.3 Center-hole load cell applied in the field………... ………29
3.4 Pressure cell construction………….………... 30
3.5 Pressure cell calibration………... 31
3.6 Pressure cell installation in form………32
4.1 Form panel layout……….. 35
4.2 Wall formwork system………... 37
4.3 Load cell and pressure cell installation………... 37
4.4 Column formwork layout………... 39
4.5 Water seepage from bottom of formwork……….. 40
4.6 Aluminum panel form system………... 41
4.7 Formwork and experimental setup on Foundation Wall #4………... 45
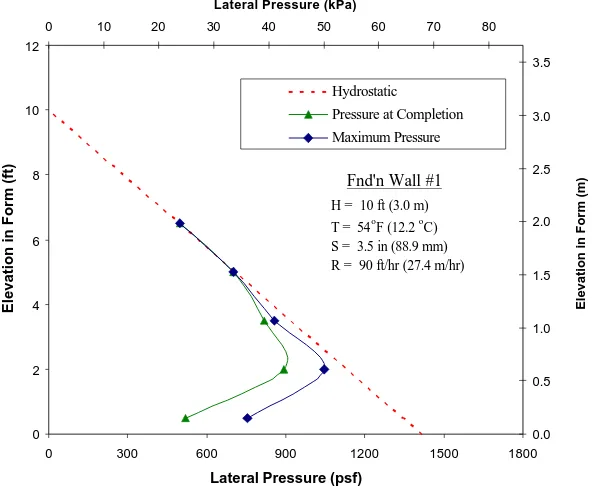
5.1 Lateral pressure distribution – Foundation Wall #1………... 51
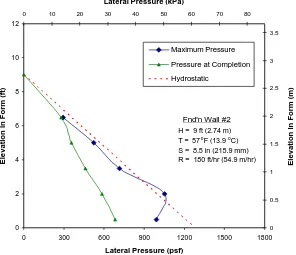
5.2 Lateral pressure distribution – Foundation Wall #2………... 52
5.3 Lateral pressure distribution – Foundation Wall #3………... 53
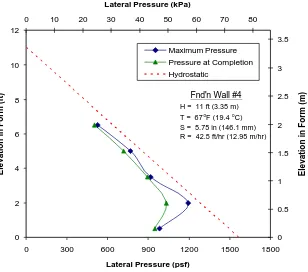
5.4 Lateral pressure distribution – Foundation Wall #4………... 53
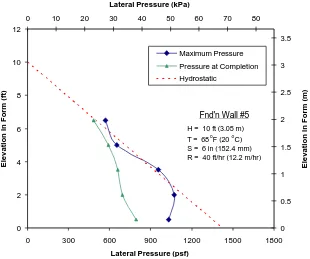
5.5 Lateral pressure distribution – Foundation Wall #5………... 54
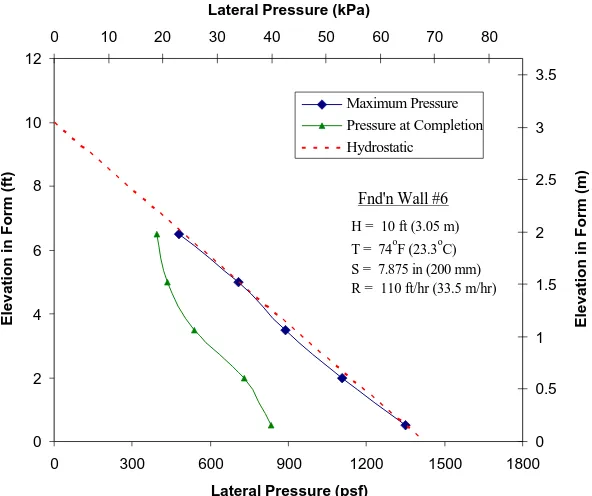
5.6 Lateral pressure distribution – Foundation Wall #6……….….……… 55
Figure Page
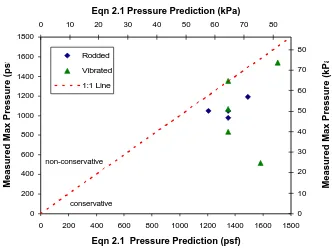
5.9 Measured pressure vs. ACI Eqn 2.1 prediction………. 58
5.10 Measured pressure vs. ACI Eqn 2.3 prediction………... 59
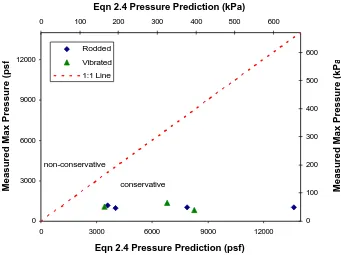
5.11 Measured pressure vs. ACI Eqn 2.4 prediction………... 59
5.12 Measured pressure vs. Yu and Johnston prediction………. 60
8.1 Slump vs. percent ACI Eqn 2.1 Prediction………. 73
8.2 Slump vs. percent ACI Eqn 2.3 Prediction………... 73
8.3 Temperature vs. percent ACI Eqn 2.1 Prediction………... 74
8.4 Temperature vs. percent ACI Eqn 2.3 Prediction………... 74
8.5 Rate of Placement vs. percent ACI Eqn 2.1 Prediction………... 75
8.6 Rate of Placement vs. percent ACI Eqn 2.3 Prediction……….. 75
8.7 R/T vs. percent ACI Eqn 2.1 Prediction………. 76
8.8 R/T vs. percent ACI Eqn 2.3 Prediction………. 76
8.9 (R*S)/T vs. percent ACI Eqn 2.1 Prediction………... 77
8.10 (R*S)/T vs. percent ACI Eqn 2.3 Prediction……… 77
8.11 R/(T*S) vs. percent ACI Eqn 2.1 Prediction……… 78
8.12 R/(T*S) vs. percent ACI Eqn 2.3 Prediction……… 78
8.13 T/S vs. percent ACI Eqn 2.1 Prediction……… 79
8.14 T/S vs. percent ACI Eqn 2.3 Prediction……… 79
8.15 Pressure cell #1 calibration………... 113
8.16 Pressure cell #2 calibration………... 113
8.17 Pressure cell #3 calibration………... 114
Figure Page
8.19 Pressure cell #5 calibration………... 115
8.20 Load cell #1 calibration……… 118
8.21 Load cell #2 calibration……… 118
8.22 Load cell #3 calibration……… 119
8.23 Load cell #4 calibration……… 119
8.24 Load cell #5 calibration……… 120
8.25 Load cell #6 calibration……… 120
8.26 Load cell #7 calibration……… 121
8.27 Load cell #8 calibration……… 121
8.28 Load cell #9 calibration……… 122
8.29 Load cell #10 calibration……….. 122
8.30 Load cell #11 calibration……….. 123
1. INTRODUCTION
1.1 Background
Concrete is an attractive construction material because of its strength, durability, and
ability to be formed into many shapes. Consequently, it is one of the most widely used
structural materials in the world today. During cast-in-place concrete construction,
temporary forms must be erected to shape the fresh concrete and to support the weight of the
fresh concrete until it gains sufficient strength to support its own weight. The construction of
formwork can be very labor and material intensive, often accounting for 40 to 60 of the cost
of a concrete construction project (Hurd, 2005). Therefore, it is important to understand the
loads that a form is subjected to during a concrete placing operation so that engineers can
design the forms as safe, yet economical, temporary structures.
Since about 1900 various researchers have studied the lateral pressures exerted on
wall formwork by fresh concrete. The earliest experiments measured formwork pressures
using normal weight concrete with Type I cement and no admixtures. Most experiments
since the 1960’s have tested different concretes that may or may not have contained chemical
admixtures or supplementary cementitious materials.
It has come to be widely accepted by researchers that concrete, when placed in a
vertical form, exerts a lateral pressure on the formwork as illustrated in Figure 1.1. Initially,
the pressure is hydrostatic from the top downward, then increases at a lower rate until it
reaches a maximum lateral pressure, at which point the pressure remains relatively constant,
but finally gradually decreases somewhat near the bottom of the form. A typical design
Figure 1.1 Typical lateral pressure distribution
The American Concrete Institute Committee on Formwork for Concrete first
published recommendations on lateral pressures in the early 1960s (ACI 622) The
committee, now ACI 347, periodically reviewed the experimental data and results of research
by others and adjusted limitations on one of the original equations but they evolved little
through the 1994 edition (ACI 347R-94). More major revisions were made in 2001 (ACI
347-01) and in 2004 (ACI 347-04) to incorporate the effects of various admixtures, cement
types, and concrete unit weights based on a study by Barnes and Johnston (1999).
1.2 Problem Statement
The limited data available remains a concern and improved understanding of the
lateral formwork pressures created by today’s modern concrete mixtures and construction
techniques is needed. The introduction of Self-Consolidating concrete as well as an ever
increasing focus on efficiency and speed of placement in the construction industry has h
p max
Design
majority of recent studies have found that this pressure can be a function of many different
concrete qualities which may include the rate of placement, presence and type of admixtures,
type of cement, temperature of concrete, etc. Because of our limited understanding of the
behavior of concrete with very high slump or placed at rapid rates, formwork
recommendations provide for a form design assuming full hydrostatic pressure when certain
slump and placement rates are exceeded. However, this approach might be
overly-conservative.
There is a need to collect more data from field placements so that the lateral
prediction equations can be verified or improved. In order to collect the data, measurement
systems need to be developed that are flexible in application and offer alternate approaches
for comparison.
1.3 Objectives
The objective of this research is to develop a measurement system that uses pressure
cells for direct measurement of lateral concrete pressures and to develop a system that uses
load cells to determine tie forces which can be applied to a wide range of ties sizes and types
of form ties. Once the system has been developed, another objective is to perform trial
measurements in the field to evaluate the effectiveness of the measurement system as well as
the applicability of ACI predictive equations. Rather than testing concrete form pressures in
a laboratory environment, this project seeks to identify conditions and properties that affect
lateral formwork pressures by collecting data from actual field experiments. This thesis
includes a review of pertinent literature and previous studies, an outline of the testing
2. REVIEW OF LITERATURE
2.1 Early Research
Since the first study on the lateral pressure exerted by fresh concrete on formwork in
the late 1890’s, many researchers have performed experiments to refine the understanding of
the factors that affect such pressures. It has come to be widely accepted by researchers that
concrete, when placed in a vertical form, behaves generally as shown in Figure 1.1.
Consequently, design recommendations have adopted a model for design where pressure
follows the hydrostatic line to the point of maximum pressure and then remains constant.
Research suggests, however, that a number of factors may affect the lateral pressures
exerted on formwork. Previous studies have found such variables as method of vibration,
concrete temperature, slump, form dimensions, rate of placement, and type of admixtures all
may have an effect. Previous research on this topic suggests that the lateral pressure exerted
on formwork by fresh concrete is extremely complicated.
2.2 Laboratory Experiments
2.2.1 Effects of Form Dimensions and Rate of Placement
To test the then-current recommendations of ACI 347-78 and CERA Report Number
1 (1965), Gardner and Ho (1979) performed laboratory experiments in which they measured
the lateral force exerted on vertical formwork by fresh concrete. The experimenters
constructed a form measuring approximately 3 feet wide by 6 inches thick, although this
geometry may be better defined as a column than a wall, and 15 feet tall with a form face that
to them in their commentary as load cells. Their testing equipment consisted of plexiglass
cylinder load cells that were placed inside the form at varying elevations. By measuring the
axial strain on the cylinders due to the force of the concrete head, the researchers could
estimate a lateral pressure. The major difficulty is that the load cells, which are placed inside
the form, cannot be easily retrieved once the concrete has cured.
Normal weight concrete made with Type I cement was placed into the form directly
from a truck at a specified rate in 2.5 ft lifts. Each lift was then vibrated using a poker type
internal vibrator immersed 2 feet. After lateral pressure measurements were taken, the face
of the form was moved outward slightly to simulate yielding of the form and measurements
were taken again. In addition, researchers performed slump tests on the fresh concrete every
15 minutes throughout the duration of the experiment.
After plotting the lateral pressure versus depth, the researchers found that the lateral
pressure increased hydrostatically to a maximum value, and then decreased towards the
bottom of the form. By plotting their recorded data versus the CERA Report Number 1
(1965) and ACI 347-78 recommendations, they found that both recommendations
significantly overestimated the pressure. Other conclusions of the study were:
• As the form dimension increases, so does the pressure probably due to the ‘arching
limit’ outlined by CERA. No predictions of when arching becomes insignificant
were reported;
• Maximum aggregate size and concrete strength do not have a great impact on the
• Yielding of the formwork significantly reduces the lateral pressure of the fresh
concrete. Results showed that moving the form face 1/10 of an inch could reduce the
zero movement pressure by up to 40%;
• The lateral pressure on the formwork increases as slump and rate of placement
increase. High slump mixes with a high rate of pour exhibited up to 35% higher
pressure than low slump, low rate of pour concrete.
Because all of their experiments were performed at a constant temperature, thermal
effects on lateral pressure could not be measured. The experimenters also noted, however,
that concrete temperature cannot be ignored in the prediction of the maximum lateral
pressure of concrete. While the authors did not suggest any changes to the ACI and CERA
recommendations, their research helped to gain a better insight into the many variables that
affect lateral pressure of concrete on formwork (Gardner and Ho, 1979).
2.2.2 Effects of other Placement Variables
N. J. Gardner (1980) performed experiments at the University of Ottawa with a large
instrumented form to examine the equations suggested by the ACI and CERA for the
prediction of lateral pressure on formwork. The researchers constructed a steel open-ended
box form measuring 4.6 m. deep, and 0.28 or 0.29 m. wide. Five earth pressure cells were
mounted at varying heights within the form. Concrete was then discharged into the form in
lifts of specified heights and each lift was internally vibrated. The mixture composition of
and the slump of the concrete were tracked throughout the placement phase. The pressure
cells used in this experiment gave a pressure reading directly. However, once cast in the
concrete, these pressure cells cannot be retrieved for later use unless the fresh concrete is
dumped from the form before setting, making the system somewhat inflexible for field use.
The lateral pressure versus head relationship was plotted and compared to the profiles
predicted by ACI and CERA. This study considered the variables thought to contribute
considerably to the lateral pressure, namely characteristics of vibration, slump, size of the
member being formed, temperature, rate of placement, and addition of superplasticizer.
Based on previous experimental work by others, and the recommendations of ACI
and CERA, Gardner also proposed a new equation for the prediction of lateral formwork
pressure which is beyond the scope of this report. The equation combines the findings from
the several experiments to determine the effects of rate of placement and includes a provision
for the size of the member being formed.
In his conclusions, Gardner suggested that a minimum value of 47.9 kN/m2 (1000 psf) be used for low rates of placement (less than 1 m/hr). The findings also seemed to show that
both the ACI and CERA stiffening equation, as well as the proposed equations,
overestimated the actual maximum pressures measured in the formwork, and the CERA
arching equation was inappropriate for low-friction forms. By comparing the results,
however, the proposed equation seemed to estimate the values a little more closely for this
particular experiment. With the exception of two tests, all of the recorded pressures fell
within 1.65 standard deviations of the mean predicted by the proposed equation (Gardner,
2.3 Field Experiments in Recent Decades 2.3.1 Effects of Rate of Placement
Douglas et al, (1981) performed experiments to determine the lateral pressures
produced on wall forms being used on an actual jobsite. By constraining all other variables,
experimenters collected data concerning the relationship between rate of placement and
lateral pressure.
The test specimen used to collect data was a cast-in-place, rectangular concrete water
tank measuring 150 x 75 x 20 ft. Because the contractor designed the formwork to be
stripped and used numerous times, the researchers were able to collect data on more than one
occasion and, because the structural variables of the wall were fixed, data could be
compared. Pressure data was collected by instrumenting five form ties nearest the center of
the form. Each form tie had a pair of electric resistance strain gages attached. Concrete of a
specified mixture was placed in the wall at varying rates while temperature was held constant
at 74 F. Researchers monitored the axial forces in the form ties throughout the casting
operation.
Rather than utilize a tributary area calculation to infer lateral pressure from the stress
in the form tie, the experimenters assumed that the pressure diagram followed a polynomial
distribution with depth. By setting pressure equal to zero at the top of the wall, and
deflection equal to zero at the wales, a system of 6 equations and 6 unknowns could be
developed and solved for the constants of integration. Finally, the pressure could be
determined using these equations and the pressure versus head could be plotted.
• The hydrostatic pressure distribution required by ACI constraints because of the
high rate of placement appeared to greatly overestimate the maximum pressure for
rates of placement between 10 and 13 ft/hr. The suggested equations for rates
between 7 and 10 ft/hr actually underestimated the pressure when extrapolated into
the higher range.
• Laboratory experiments and field studies do not necessarily give the same data, and
caution should be used when extrapolating laboratory results to field operations.
• The ACI hydrostatic equations also greatly overestimated the maximum lateral
pressure even at rates as high as 16 to 18 ft/hr. Equations for lower rates of
placement extrapolated to higher rates significantly underestimated the lateral
pressure. This would suggest that more accurate predictive equations could be
created.
Douglas et al also suggested further field studies to determine the relationship between
rate of placement and lateral form pressure. In performing this field study, the researchers
showed a clear need for more research to refine the equations of ACI 347-78 to facilitate the
more efficient design of concrete formwork.
This study appears to be one of the earlier published field studies where the lateral
pressures in the form are inferred from the tensile forces measured in the form ties. In certain
applications, this assumption seems reasonable. By constructing tensile load cells through
the application of electrical resistance strain gages, the researchers created a system to collect
their data. The exact design of the load cells is unclear. However, by instrumenting specific
form ties, the use of these load cells in the field is limited to specific form systems that
2.3.2 Applicability to Walls of Larger Dimensions
Johnston et al. (1989) evaluated the lateral pressures exerted on formwork in tall and
thick concrete walls in an effort to test the recommendations of CIRIA Report 108 (Clear and
Harrison, 1985), and ACI 347-78. The concrete mixtures used in the experiment all
contained Type II portland cement and admixtures including a retarding water reducing
admixture and an air entraining admixture. The concrete was placed in 12 to 16 inch lifts by
pumping, at a rate ranging from 5.1 ft/hr to 11.0 ft/hr. Each lift was vibrated internally with
2.5 in. diameter, motor-in-head type vibrators. The completed height of the two walls tested
was 20.5 feet. A total of 14 she-bolt form ties were instrumented, each with a full-bridge of
temperature-compensated strain gages. Measurements of tensile strain were taken at five
minute intervals as the walls were cast. Similar to the work of Douglas, Johnston et al
designed the test methodology and experimental equipment with the assumption that the
lateral pressure on the formwork could be estimated using the assumed tributary area for each
individual form tie. The maximum lateral pressures recorded at each level were averaged and
plotted versus depth to create a graphical representation of the lateral pressure envelope.
Because only two walls were tested, the results of the experiment could not be used to
draw broad conclusions. Comparison with three previously suggested methods of pressure
estimation yielded mixed results. A critical finding was that Gardner’s equation substantially
overestimated the lateral pressure in both walls because of the extreme thickness of the walls,
which was considered as a parameter in his equation. The authors suggested that an upper
limit be imposed on the term in Gardner’s equation for wall thickness. All three theories
cases and underestimation in others, indicating limited reliability in those equations. It
should be noted, however, that the concrete used in the experiment contained admixtures that
did not conform to the limitations of the ACI provisions at the time, perhaps suggesting that
revisions should be made to those equations considering a wider range of concrete mixtures
(Johnston et al., 1989).
The experimental procedures used in this research assume that the lateral pressure
exerted on the formwork by the concrete can be estimated from the tensile forces in the form
ties. Because they instrumented only she-bolt form ties, the application of those load cells is
limited only to projects that utilize that specific tie in the form design, limiting the flexibility
and the applications of the data collection system.
2.3.3 Effects of Extended Set Concrete and Admixtures
In a study at North Carolina State University, Dunston et al. (1994), evaluated the
lateral pressures exerted on formwork in tall walls by extended set concrete. The concrete
mixtures used in the experiment all contained Type II portland cement and an assortment of
mineral and chemical admixtures including granulated blast furnace slag, fly ash, and
high-range water-reducing admixtures. The concrete was placed in two foot lifts by pumping at a
rate ranging from 5.5 ft/hr to 11.0 ft/hr. Each lift was vibrated internally with 2 in. diameter,
air-powered vibrators. The completed height of the walls varied slightly, but all were about
28 ft in height.
Collection of data was very similar to the previous study by Johnston et al. However,
in this case, 2-1/2 vertical rows of ties were instrumented, each with a full bridge of
to ten minute intervals as the walls were cast. A finite element model was then created to
iterate a stepped loading that approximated the tie reactions measured at each level while
seeking uniformity and maintaining the sum of all tie reactions equal to the total reaction
measured. Approximate pressure diagrams were created from the output.
The investigators once again acknowledged that the limited number of test specimens
and variation in concrete mixture limited the ability to draw broad conclusions. In
comparison to ACI and CIRIA equations for predicting formwork pressure, the results
seemed to indicate that designing the formwork for full hydrostatic head (suggested at the
time by ACI because of the use of type II cement and HRWRA) was overly conservative.
However, if the limitations on the admixtures were ignored, the ACI equation yielded
inadequate results which resulted in an underestimation of the pressure. On the other hand,
the CIRIA equations, involving more variable parameters, reasonably approximated the
pressures measured in the field experiment (Dunston, et al., 1994).
2.4 Results of Recent Studies of Historical Data
2.4.1 Research of Barnes and Johnston
Partly in response to previous research that suggested inadequacies in the ACI
provisions for formwork design, Barnes and Johnston (1999, 2003) performed research to
refine the equations and allow for the use of different types of cements and chemical
admixtures. The researchers noted that, because of numerous additions to the limitations on
the applicability of ACI 347R-94 equations for formwork pressure, and the increased use of
Barnes and Johnston extracted data from many experimental studies conducted over
the previous twenty-five years, which involved variables such as chemical admixtures,
concrete temperature, cement type, and rate of placement. For the first step, lateral pressures
at varying depths were predicted using the then-current ACI 347R-94 equations, ignoring all
limitations, and the results were plotted. The figures were compared to measured data from
the previous studies. They found that if the limitations were ignored, the equations presented
in ACI were insufficient.
The researchers then analyzed the data collected from previous experiments to
determine a relationship between the composition of the concrete, and the lateral pressure
placed on vertical formwork. Coefficients for chemistry (Cc) and unit weight (Cw) were
suggested as follows:
Chemistry Coefficient:
Category A: includes any Type I and Type III cement with or without any admixture
except a retarder. Cc = 1.0
Category B: includes any Type I and Type III cement with a retarder, or other types
containing less than 70% slag or 40% fly ash with or without any admixture except
a retarder. Cc = 1.2
Category C: includes concretes with other than Type I and Type III cements and with
a retarder or concretes with greater than 70% slag or 40% fly ash. Cc = 1.4
Unit Weight Coefficient:
Less than 140 pcf: Cw = 0.5 [ 1 + (w /145 pcf)], but not less than 0.80
More than 150 pcf: Cw = w / 145 pcf
The authors then suggested a change to the ACI equations to utilize these coefficients
in predicting the lateral load on the form.
2.4.2 Research of Yu and Johnston
By compiling all available historical data on formwork lateral pressure, research by
Yu and Johnston (2003) produced equations for the prediction of lateral formwork pressure
based on material and placement variables. Through the use of multiple linear regression
techniques, Yu and Johnston created a statistical model that could be used to predict the
lateral pressure of concrete with or without admixtures. The equation proposed is:
P = CcCf [ 650 + 50H – 6T + 90(S)1/2 – 310 log(t)]
or
WH, whichever is less
where: P = maximum design pressure (psf);
Cc = coefficient dependent on the constituent materials of
the concrete;
Cf = coefficient dependent on the size and shape of the formwork;
H = vertical concrete height (ft);
T = concrete temperature at placing (oF); S = concrete slump (in);
Table 2.1 Values of Yu and Johnston’s Admixture Coefficient Cc
Concrete Value of Cc
Type I and Type III with any admixtures except superplasticizers or
retarders or without admixtures 1.0
Type I and Type III with a superplasticizer and without a retarder
1.1
Type I and Type III with a retarder
X Other types or blends containing less than 50% GGBFS or 30% fly ash
without superplasticizers or retarders
1.2
Other types or blends containing less than 50% GGBFS or 30% fly ash
with a superplasticizer and without a retarder 1.3
Other types or blends containing less than 50% GGBFS or 30% fly ash
with a retarder Blends containing more than 50% GGBFS or 30% fly ash 1.4
Table 2.2 Values of Yu and Johnston’s Form Type Coefficient Cf
Form type Value of Cf
Walls 1.0
Columns 1.2
2.5 Current Recommendations of ACI-347
The findings and recommendations of Barnes and Johnston are represented in the
current revision of ACI 347. Provisions of ACI 347-04 give equations for the maximum
pressure for design as follows:
Unless the conditions below are met, formwork should be designed for the lateral
pressure of the newly placed concrete given in ACI Eq. (2.1a) or (2.1b). Minimum values
given for other pressure formulas do not apply to ACI Eq. (2.1a) and (2.1b).
p = wh (lb/ft2) (ACI 2.1a)
where:
p = lateral pressure, lb/ft2 (kPa); w = unit weight of concrete, lb/ft3;
ρ = density of concrete, kg/m3;
g = gravitational constant, 9.91 N/kg; and
h = depth of fluid or plastic concrete from top of placement to point of consideration in form, ft (m).
For concrete having a slump of 7 in. or less (175 mm) and placed with normal
internal vibration to a depth of 4 ft (1.2 m) or less, formwork can be designed for a lateral
pressure as follows where pmax = maximum lateral pressure, lb/ft2 (kPa); R = rate of
placement, ft/h (m/h); T = temperature of concrete during placing, oF (oC); Cw = unit weight
coefficient; and Cc = chemistry coefficient
Inch-pound version-
For columns:
pmax = CwCc [150 + 9000R/T] (ACI 2.2)
with a minimum of 600 Cw lb/ft2, but in no case greater than wh.
For walls with a rate of placement of less than 7 ft/h and a placement height not exceeding 14 ft
pmax = CwCc [150 + 9000R/T] (ACI 2.3)
with a minimum of 600Cw lb/ft2, but in no case greater than wh.
For walls with a placement rate less than 7 ft/h where placement height exceeds 14 ft, and for all walls with a placement rate of 7 to 15 ft/h
pmax = CwCc [150 + 43400/T +2800R/T] (ACI 2.4)
SI version-
For columns:
pmax = CwCc
+ + 8 . 17 785 2 . 7 T R (ACI 2.2)
with a minimum of 30Cw kPa, but in no case greater than ρgh.
For walls with a rate of placement of less than 2.1 m/h and a placement height not exceeding 4.2 m
pmax = CwCc
+ + 8 . 17 785 2 . 7 T R (ACI 2.3)
with a minimum of 30Cw kPa, but in no case greater than ρgh.
For walls with a placement rate less than 2.1 m/h where placement height exceeds 4.2 m ft, and for all walls with a placement rate of 2.1 to 4.5 m/h
pmax = CwCc
+ + + + 8 . 17 244 8 . 17 1156 2 . 7 T R
T (ACI 2.4)
with a minimum of 30Cw kPa, but in no case greater than ρgh.
Table 2.3 Unit weight coefficient Cw
Inch-pound version SI verrsion
Unit weight of
concrete Cw Density of concrete Cw
Less than 140 lb/ft3
Cw = 0.5[1 + (w/145
lb/ft3)] but not less than
0.80
Less than 2240 kg/m3
Cw = 0.5[1 + (w/2320
kg/m3)] but not less than 0.80
140 to 150 lb/ft3 1.0 2240 to 2400 kN/m3 1.0
More than 150 lb/ft3
Cw = w/145 lb/ft
3 More than 2400
kg/m3 Cw = w/2320 kg/m
Table 2.4 Chemistry coefficient Cc
Cement type or blend Cc
Types I, II, and III without retarders 1.0
Types I, II, and III with a retarder 1.2 Other types or blends containing less than 70%
slag or 40% fly ash without retarders 1.2 Other types or blends containing less than 70%
slag or 40% fly ash with a retarder 1.4 Blends containing more than 70% slag or 40% fly
ash 1.4
2.6 Recent Studies in Self-Consolidating Concrete
Asssad et al. (2003) evaluated the influence of thixotropy of self-consolidating
concrete on formwork pressure. The researchers instrumented a 200 mm inside diameter
polyvinyl chloride (PVC) tube with five diaphragm earth pressure cells to collect data at
varying heights in the tube. These pressure cells had a capacity of 100 kPa (2088 psf) and
were sealed in the form to support the pressure exerted by the concrete without any leakage.
Following the rheological tests of the concrete, and a 60 minute storage period with agitation
intended to simulate transport to a construction site, the fresh mixtures were tested for air
content and slump flow. High range water reducing admixtures were then added to adjust
consistency, and the concrete was discharged into the tube without vibration.
The experimental equipment attempted to directly measure the pressure exerted on
the formwork through the use of pressure cells. Whether or not the PVC tube form
adequately simulates field conditions that could affect the lateral pressures exerted is subject
to debate and outside the scope of this study. Assuming that the inside of the tube is treated
The results indicated that all of the mixtures exhibited similar lateral pressures
initially, approaching full hydrostatic head, but that the rate of decrease of this pressure over
time varied greatly with the proportioning of the mixture. Those made with a ternary cement
showed a faster reduction in pressure over time than those containing a binary cement. In
addition, the presence of a set accelerating admixture also created an increase in this rate of
pressure drop over time. The study also found that the rate of pressure drop with time of the
different mixtures was independent of the loss of slump flow as measured before placing.
They concluded that the time dependent drop in lateral pressure of self-consolidating
concrete cannot simply be predicted by the degree of loss of slump flow, but rather is a
function of the type of cement and admixtures used in the batching of the concrete mixture
(Assaad et al., 2003).
Assaad and Khayat (2004) studied the effects of internal friction and cohesion in
self-consolidating concrete on formwork pressure. They used the same form and pressure cell
set-up (polyvinyl tube with earth pressure cells) as in the previous study. It was assumed that
the internal friction in the concrete is created by aggregate interlock, and is therefore directly
related to the quantity of coarse aggregate in the mixture. Consequently, the experimenters
proportioned batches with several different sand to total aggregate ratios (R). For these
batches, the water-cement ratio and cement type were held constant. The researchers
assumed that cohesion of the concrete paste is a function of the quantity and type of cement
employed in the mix and any set-modifying admixtures also included. A type 10 Canadian
cement as well as three different blended cements with varying quantities of silica fume and
fly ash were used. Mixtures with varying binder quantities were also tested to identify the
concrete. In addition, set retarding admixtures or set accelerating admixtures were added to
certain batches. The basic procedure of the test consisted of filling the form with each batch
at a rate of rise of approximately 10 m/hr and taking pressure measurements at varying
heights.
In their conclusions, Assaad and Khayat state that the initial pressure in formwork
exerted by self-consolidating concrete is a function of the internal friction of the mixture and
that reduced pressures can be obtained by using a high content of coarse aggregate and/or
blended cements. They concluded that the rate of pressure drop thereafter is mainly
dependent on the development of cohesion with time; the type of cement, binder content, and
the addition of set-modifying admixtures all play a role in this characteristic (Assaad and
Khayat, 2004).
Addressing the concerns that had arisen in Switzerland after the failure of several
concrete forms during the placement of self-consolidating concrete in wall construction,
Leeman and Hoffman (2003) performed a two-phase experiment to study the vertical
distribution of lateral pressure of self-consolidating concrete that is either placed from above,
or pumped from the bottom of the form. For the laboratory portion of the experiment,
researchers mixed four different self-consolidating batches, each with varying cement,
mineral filler, aggregate, and admixture proportions. For a control, a conventional concrete
mixture was also created. For the experiment, a wall form with interior dimensions of 270 x
75 x 20 cm was constructed, and pressure sensors were placed in holes drilled into the form.
After recording the slump flow of each batch, each was poured into the wall in two lifts. The
were taken at each of the sensors at placement and over time. In the field, experimenters
instrumented formwork measuring 470 x 490 x 25 cm and recorded pressure readings as the
SCC concrete was pumped into the formwork through a valve located 60 cm above the base.
The rate of pumping for this phase of the experiment corresponded to a rate of rise of
approximately 62 ft/hr. Data for this phase was collected in a similar manner to the
laboratory phase.
The results of the laboratory study showed that, even at an extremely high rate of
placement, the maximum lateral pressure experienced by the formwork was only between 87
and 90% of full hydrostatic pressure for the self-consolidating concrete. Examination of a
plot of pressure versus depth showed that the maximum pressure was at the bottom of the
form as the line of lateral pressure measured almost followed the linear hydrostatic line.
Further pressure readings showed that the pressures decreased over time, taking
approximately 2 hours for pressures in 3 of the four mixtures to reach half of their initial
value. Field data recorded as one of the batches of SCC was pumped from the bottom of the
form indicated, as expected, that the pressures exerted on the formwork were in excess of full
hydrostatic pressure by as much as 10%.
After analyzing the data, researchers concluded that the workability of a
self-consolidating concrete mixture did not have an effect on the maximum lateral pressure
measured shortly after placing. In addition, the rate of pressure decrease with time did not
appear to be related to the workability of the mix. In contrast, the authors suggested that an
increased volume of fly ash, higher amounts of coarse aggregate, and set accelerating
admixtures increased the rate of pressure reduction with time. When comparing their results
that the variation in the mixture properties and the rate of placement could produce
significantly different pressures.
In a Swedish study, Billberg (2003) attempted to relate the rate of placement and
batch properties of self-compacting concrete to the lateral form pressure. Because of its flow
characteristics permitting placement without consolidation, it is very tempting for
construction crews to cast as quickly as possible, sometimes generating extremely high rates
of placement. In theory, this practice can be very dangerous if the formwork is not designed
for full hydrostatic head, as such high placement rates should result in extremely high lateral
pressures. The experiment attempted to verify this pre-drawn conclusion and to examine the
pressures at lower rates of placement.
The self-compacting concrete mixtures used were proportioned to meet the
requirements of the SNRA Bridge Code 94, containing limestone filler, an air entraining
admixture, a superplasticizer, and a standard cement. Three mixtures were created, two
self-compacting and one normal concrete as a control. The two SCC blends differed in their W/C
ratio and mineral filler content, but were the same in all other aspects. The experimental
formwork was a standard wall form system consisting of an inner layer of plywood, timber
beams, steel wales for structural support, 16mm form ties, washers, and nuts. To measure the
pressure exerted on the form, load cells were placed between the horizontal wales and the
washers, which could thereby measure the tensile load in each form tie. For each batch, the
slump or slump flow was measured and the concrete was placed in the form at a designated
rate. When placement was complete, pressure readings at each height were recorded. The
each other, as well as to an equation used to predict lateral pressure in a 1968 Swedish
research paper.
When comparing the plots of the pressures versus height for each of the mixtures and
rates of placement, it was obvious that the rate of placement played a significant role in the
lateral formwork pressure. While the two SCC batches placed at an equal rate exhibited
slightly higher pressures, the two placed at a lower rate produced significantly less pressure
than the normal concrete. After viewing these results, the researchers created a plot of form
pressure versus casting rate and found that the relationship was relatively linear. The only
exception to this pattern was casting number 5, which exhibited significantly higher
pressures than any other cast. The author stated that this was because the concrete in this
batch was placed directly in the form after mixing and was both younger and more flowable
than the other 6 mixtures. This finding seems to be a clear indicator that batch properties
such as slump flow and age can play a significant role in formwork pressures in addition to
the rate of placement, but these properties were not studied significantly in this particular
study. The data also indicated that the mixture composition could not be correlated with a
higher or lower form pressure.
The author’s description of the load cell set-up is limited, but the method seems to
lend itself to flexibility and re-use in the field. It appears from the description, that flat load
cells were placed between the tie washer and tie nut on form ties at various elevations in the
form. By determining the compressive force between the wale and the tie nut, the tensile
force in the tie is known, which can be used to estimate a lateral formwork pressure.
Pressure measurements in this experiment were recorded only at the completion of
pressures could be exerted at certain locations during the placement of the concrete, rather
than at completion. The report indicates that the rate of placement is an important factor in
the magnitude of lateral formwork pressure but the mixture proportion of the batch was not a
significant determining factor. However, with the large variation produced by a younger
mix, the research also suggests that the time-related effects of the SCC admixture used in
3. RESEARCH AND TESTING EQUIPMENT
3.1 Instrumentation Objectives
Because an important objective of this research project was to obtain data from actual
field applications, it was important that the design and construction of the individual forms
not be affected by the research. Each specimen can vary with construction and layout, and
the experimental equipment should be flexible enough in application to accommodate a wide
range of form systems. Two different types of load sensing devices were developed.
3.2 Center-Hole Load Cells
One of the load sensing devices utilized in this project was a center-hole load cell.
The intended purpose of this cell was to slide over the projecting end of a reuseable form tie
between the steel plate bearing on the wales and the tie nut and washer. Because the form tie
and load cell are not bonded and can move independently, the cell would be placed in
compression at a magnitude equal to the tension in the tie. Consequently, it was important
that the dimensions of the load cells accommodate the most common types of forms and ties.
None available commercially were found to suit this requirement, so the load cells were
fabricated specifically for this study.
A total of twelve load cells were fabricated in the lab. Each load cell was made from
solid aluminum rod with an outer diameter of 2-1/4”. A center hole with an inner diameter of
1-15/32” was drilled through the length of 4”. These tube sections were then instrumented
and lead wires were then encapsulated and further bonded to the tube with RTV 3140
silicone rubber. An abrasion resistant PVC heat-shrink sleeve was then applied to each cell
to prevent damage in the field and supply a secondary waterproofing measure. Figure 3.1
shows an image of a load cell before the protective outer coating was applied.
Figure 3.1 Center-hole load cell construction
Once fabrication was complete, each load cell was individually calibrated with a
3500 strain indicator using known loads ranging in magnitude from 0 to 30 kips so that the
P-3500 read-out would directly indicate load rather than strain. To perform the calibration, a
center-hole hydraulic jack and a tension load cell of known calibration were used. The load
cell under consideration was slipped over the projecting end of a steel coil rod which was
attached to an instrumented she-bolt form tie. A steel plate and a large wing nut were placed
at each end, one on the coil rod, and the other on the she-bolt. Loads up to the 30,000 lb.
and noting any non-linearities for each cell was then created and that data is provided in
Tables 3.1 and 3.2.
Table 3.1 Load cell gage factor log
Load Cell Gage Factor
ID 1000 lb 5000 lb 18,000 lb 30,000 lb Average
1 2.2360 2.3060 2.3840 2.4270 2.3383
2 2.1540 2.2650 2.3820 2.4070 2.3020
3 2.1140 2.2300 2.3640 2.3980 2.2765
4 2.0870 2.2860 2.4040 2.4260 2.3008
5 1.9520 2.1800 2.3410 2.3790 2.2130
6 2.1860 2.2450 2.3520 2.3730 2.2890
7 2.2840 2.2840 2.3960 2.4200 2.3460
8 2.2430 2.4100 2.4860 2.4990 2.4095
9 2.0340 2.2790 2.4160 2.4750 2.3010
10 2.2660 2.3140 2.4120 2.4310 2.3558 11 2.0880 2.2520 2.3890 2.4160 2.2863
12 2.1850 2.3060 2.4540 2.4890 2.3585
Average 1000 5000 18000 30000 2.4000
Table 3.2 Load cell calibration data log
Cell Output with Average Gage Factor Correction Multiplier ID 1000 lb 5000 lb 18,000 lb 30,000 lb 1000 lb 5000 lb 18,000 lb 30,000 lb AVG
1 770 4260 17240 29560 1.2987 1.1737 1.0441 1.0149 1.1328
2 890 4670 18080 30440 1.1236 1.0707 0.9956 0.9855 1.0438
3 740 4340 17280 29660 1.3514 1.1521 1.0417 1.0115 1.1391
4 900 4790 18230 30620 1.1111 1.0438 0.9874 0.9798 1.0305
5 750 4450 17650 29880 1.3333 1.1236 1.0198 1.0040 1.1202
6 870 4640 17620 29630 1.1494 1.0776 1.0216 1.0125 1.0653
7 790 4610 17920 30410 1.2658 1.0846 1.0045 0.9865 1.0854
8 1060 5320 19190 31660 0.9434 0.9398 0.9380 0.9476 0.9422
9 760 4370 17540 29910 1.3158 1.1442 1.0262 1.0030 1.1223
10 890 4760 18250 30680 1.1236 1.0504 0.9863 0.9778 1.0345
11 840 4610 17850 30220 1.1905 1.0846 1.0084 0.9927 1.0690
In order to create the flexibility for the load cells to work with a wide range of form
tie diameters, 60 nylon inserts were machined to slide into the aluminum tubes with a close,
but loose fit. These 4” long nylon rods can then be drilled to fit the job-specific dimensions
of the form ties that are to be instrumented and act as a centering spacer for the center-hold
load cells. Figure 3.2 shows a spacer partially inserted in the center-hole load cell. Note
also, the protective heat-shrink covering on the cell. Figure 3.3 shows a completed load cell
installed in the field to a 1 in. taper tie. Because of the inner diameter of the load cell, it can
be installed on formwork ties with a maximum diameter up to 1-7/16”
Figure 3.3 Center-hole load cell applied in the field
3.3 Flush Diaphragm Pressure Cells
In addition to load cells, 5 flush diaphragm pressure transducers were utilized in this
study. Omega PX102-025GV pressure cells were chosen because of their pressure range and
their shape which allowed fabrication of adapters for different applications. According to the
manufacturer’s information, the gauges have a maximum load range of 3600 psf with 0.25%
accuracy with virtually no thermal effects on precision.
Each cell had a face diameter of 19 millimeters (approximately ¾”) and a shoulder
behind the face that measured 23.7 millimeters. They were fitted with two-part PVC pipe
adapters to allow them to be screwed into a tapped hole in the form and mounted flush. The
adapters fabricated consisted of a ¾” plug (with a hole drilled for the lead wires) and a ¾” to
adapter to allow for insertion of the pressure cell. Figure 3.4 shows a pressure cell before
and after the addition of the PVC adapter.
(a) Pressure cell (b) Presssure cell in adapter
Figure 3.4 Pressure cell construction
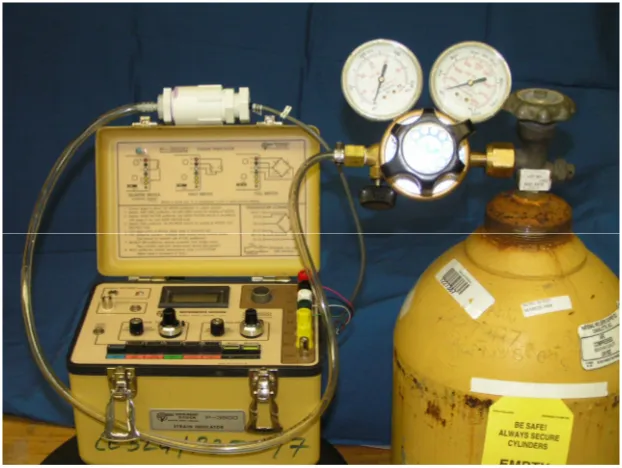
Using PVC attachments, a compressed air tank, and a pressure regulator, each cell
was loaded through its range up to 30 psig and its calibration determined using a P-3500
strain indicator. Pressures were recorded at given intervals and a log was created to compare
the known air pressure to the pressure cell output with the objective of determining a gage
factor that would allow the P-3500 to provide a direct read-out in psf. The calibration was
plotted for each pressure cell and used to create an equation to more accurately identify the
pressure on the cell. To verify that the pressure cells behaved similarly for liquid versus air
pressure, this procedure was repeated using a PVC attachment filled with water and
pressurized with air from the compressed air tank. The devices exhibited acceptable
Figure 3.5 Pressure cell calibration
Table 3.3 Pressure cell gage factor log
Cell Gage Factor
ID 20 psi 15 psi 10 psi 5 psi Average
(2880 psf) (2160 psf) (1440 psf) (720 psf)
1 2.1180 2.1300 2.1300 2.1690 2.1368
2 2.1880 2.1880 2.1760 2.3160 2.2170
3 2.1880 2.2300 2.2300 2.3210 2.2423
4 2.1980 2.2050 2.2250 2.2480 2.2190
5 2.1470 2.1520 2.1890 2.2880 2.1940
Table 3.4 Pressure cell calibration data log
Cell Output with Average Gage Factor Correction Multiplier ID 20 psi 15 psi 10 psi 5 psi 20 psi 15 psi 10 psi 5 psi Avg.
2880 psf 2160 psf 1440 psf 720 psf 2880 psf) 2160 psf 1440 psf 720 psf 1 2833 2132 1451 767 1.0166 1.0131 0.9924 0.9387 0.9902
2 2855 2161 1440 750 1.0088 0.9995 1.0000 0.9600 0.9921
3 2878 2162 1465 771 1.0007 0.9991 0.9829 0.9339 0.9791
4 2875 2145 1456 752 1.0017 1.0070 0.9890 0.9574 0.9888
5 2810 2106 1444 759 1.0249 1.0256 0.9972 0.9486 0.9991
The design of the pressure cells and the PVC adapters allowed them to be screwed
into a 1-1/8” hole drilled and then tapped (1 in. NPT) into a 5/8” plywood form face and
mounted flush on the inside face. The intended installation of the pressure cells is shown in
Figure 3.6.
Figure 3.6 Pressure cell installation in form
5/8” 1-1/8”
Plywood/Metal Form
4. EXPERIMENTAL PROCEDURES
4.1 General
This chapter describes the field experimental procedures, test set-ups, and parameters
measured. Lateral pressures exerted on wall formwork by various types of concrete mixtures
and utilizing different placement rates were measured in several cast-in-place concrete
placements on actual jobsites. The dimensional layout of wall and column forms was
documented; concrete properties such as slump, temperature, and loss of plasticity were
recorded, and the rate and method of placement were monitored throughout the duration of
the casting operation. Using pressure cells and center-hole load cells, the lateral pressure
exerted on the formwork was monitored and recorded.
To obtain a variety of data, tests were performed on several jobsites. The data
collection occurred on projects with two types of formwork: the first consisting of
field-constructed wood formwork, and the second consisting manufactured aluminum form panels.
4.2 Modified Aluminum Form Panel
An aluminum form panel was modified to receive the flush mount pressure cells and
allow them to easily be installed. Tri-City Contractors, the concrete contractor, donated one
of their form panels for use in the experiments.
The contractor’s forming system consisted of standard 8-8/8-24 aluminum form
panels manufactured by Wall Ties and Forms, Inc. The panel was made with a 1/8”
aluminum plate inside face and extruded aluminum horizontal and vertical ribs welded to the
panel could easily be combined with other standard modules to create the formwork system
on many projects. Five 7/16 in thick aluminum plates were welded to the back of the panel
plate at heights of 6, 24, 42, 60, and 78 inches, and 1-1/8 in holes were drilled and tapped
with a standard 1” NPT thread through the plate and the form panel. Each cell was then
screwed into the form panel so that the pressure cell face was flush with the inside face of the
form. The form panel layout is shown in Figure 4.1.
4.3 Testing of Batch Properties
As part of the testing program, concrete slump, temperature, unit weight, and rate of
plasticity loss were recorded for each independent batch. Unless otherwise noted, the
following basic procedure was followed on each jobsite during each casting operation.
After placing the first lift of fresh concrete for each specimen, the construction crew
placed approximately 2 cubic feet into a container for these tests. All mixtures were
classified as normal concrete (as opposed to flowable), so slump tests were performed in
accordance with ASTM C 172 immediately after placement into the testing container. In
addition, temperature was recorded immediately and monitored throughout the duration of
the casting operation and data collection. Plasticity loss of the mixture was tested using the
“K” test procedure described in ASTM C 1362. Plasticity of the concrete was recorded at ten
minute intervals until the flow gauge could not be inserted into the cylinder. The unit weight
of the concrete was determined using the test report of an independent testing firm that was
provided by the concrete supplier. This test report was used to supplement the slump and
Figure 4.1 Form panel layout
4.4 Field Constructed Wooden Formwork
Measurements were also performed on a construction site located on North Carolina
State University’s Centennial Campus. On this jobsite, data was collected during the casting
of a concrete wall, and later, a column. Miller and Long Construction, the concrete
subcontractor, worked with the researchers to instrument their field-built forms and allow for
18 in (457 mm) typical
6 in (152 mm)
Horizontal Ribs
Vertical Ribs
Pressure Cell Mounting Hole
3 ft (0.914 m) 8 ft
data collection, but the design and construction of the forms was not controlled or affected by
the research team.
Testing of the concrete mixture itself included the batch property tests described in
Section 4.3. In addition, the concrete subcontractor provided the batch mixture design and
test reports for all concrete batches. During the casting operation, the rate of rise of the
concrete was monitored, and the lateral pressures at the levels of the instrumentation were
recorded at specified time intervals.
4.4.1 Foundation Wall
The wall tested was being cast as a foundation wall for the Alumni Hall Project. The
wall was 156 inches and 12 in thick. The formwork system constructed by the contractor
prior to the researchers’ arrival on site consisted of an inner layer of 5/8 in thick plywood,
2x4 studs at a spacing of approximately 6 in, double 2x4 or 4x4 wales with a vertical spacing
of approximately 1 ft near the base of the wall, and snap ties installed on a 1 ft (305 mm)
vertical x 2 ft (610 mm) horizontal grid. It was determined that the intricacy of the formwork
layout and the use of snap ties on such a tight grid would make the collection of data with the
Figure 4.2 Wall formwork system
Holes were drilled through the form plywood face and 1 in diameter taper ties were
inserted to replace snap ties at heights of 12 (305), 24 (610), 40(1016), 56 (1422), 80(2032),
92 (2337), and 104 (2642) inches (millimeters) from the base of the form. These ties were
instrumented with the through-hole load cells. In addition, five 1-1/8 in holes were drilled
and tapped into the face of the plywood form and pressure cells were inserted at heights of 6
(152), 30 (762), 60 (1524), 84 (2134), and 108 (2743) inches (millimeters).
The contractor utilized a concrete pump to place the fresh concrete into the wall
formwork from the top. Throughout the casting process, the concrete was consolidated using
a 2 in diameter stinger type vibrator in approximately 4 ft lifts. Pressures and tie loads were
recorded in one minute intervals. During casting, it was noted that a significant delay
occurred between the arrival of the first and second concrete trucks. The height of the fresh
concrete in the form at the time of the delay remained at approximately 4.5 feet for about 20
minutes. A total of 160 minutes elapsed during the placement of the 13 ft wall. Relevant
batch and placement data are summarized in Table 4.1.
4.4.2 Basement Column
Measurements were also performed during the casting of a 12 ft (3.66 m) tall
basement column on the Alumni Hall project. The column formwork was constructed with a
5/8 in class B-B Plyform inner face, vertical 2x4 studs and horizontal 2x4 wales, both
bending in the weak direction, and ½ in steel band strapping around the entire system at a
vertical spacing of approximately 1 ft as shown in Figure 4.4.
Because no form ties were used in the column, only pressure cells were used for data
collection during this placement. Five pressure cells were inserted in tapped holes in the face
of the formwork at elevations of 6 (152), 30 (762), 48 (1219), 72 (1829), and 100 (2540)
inches (millimeters) from the bottom. Similar to the procedure followed in the wall
placement, pressures were measured at 1 minute intervals throughout the duration of the
Figure 4.4 Column formwork layout
and consolidated by vibration at the end. Due to this different procedure, the rate of rise of
the fresh concrete was significantly higher than that observed in the wall. After casting was
complete, a decline in pressure was observed over the next 2 hours. It was theorized that the
decline was due to the reduction in pore-water pressure as a result of water leaking out of the
bottom of the form, as shown in Figure 4.5, and the beginning of the hydration process.
Batch and placement data is summarized in Table 4.1.
4.5 Manufactured Aluminum Formwork System
The second concrete contractor that participated in the research utilized a
manufactured aluminum panel formwork system for forming and casting of residential
foundation walls. A description of the modified form panel used in this experiment can be
Figure 4.5 Water seepage from bottom of formwork
Wall Column
Ambient Temperature 52oF (11.1oC) 62oF (16.7oC)
Concrete Temperature 60oF (15.6oC) 62oF (16.7oC)
Average Slump 5 in (127 mm) 8.5 in (216 mm)
Rate of Rise (Avg) 4.9 ft/hr (1.49 m/hr) 80 ft/hr (24.38 m/hr)
Cement Type Type II Type II
Unit Weight 142 pcf (2274 kg/m3) 142 pcf (2274 kg/m3)
Consolidation Internal vibration Internal vibration
For each of the casting operations, the modified panel was set in the formwork system
for a residential basement wall. Five flush-mount pressure cells were then screwed into the
panel to monitor form pressures throughout the duration of the placement. The rate of rise of