JOSHI, PRATIK. High-Temperature Deformation Characteristics of Cladding Materials for Nuclear Reactors: HANA-4 and FeCrAl. (Under the direction of Dr. KL Murty).
Zr-Nb alloys are used as cladding materials to encapsulate radioactive fuel in nuclear reactors. They possess excellent corrosion resistance at high temperatures making it possible to achieve high fuel burn-up directly increasing the thermal efficiency of the reactor. While they are commonly used in recrystallized (Rx) form in boiling water reactors, there is a need to understand the effect of cold work and stress relief (CWSR) on biaxial creep characteristics of these materials due to their use in pressurized water reactor during operation, these alloys experience multiaxial loading conditions. In this study, the biaxial creep behavior of as-received Zr-Nb alloy commonly referred to as HANA-4 has been investigated at 500 °C. The crystallographic textures and creep loci of the as-received HANA-4 have been evaluated. Later, these have been compared with the previous study done on recrystallized HANA-4. Biaxial creep tests were performed using internally pressurized tubing superimposed with the axial load under varied hoop (σ θ ) to axial (σ z ) stress ratios of 0 to 2 while monitoring both the axial and hoop strains using an LVDT and a laser telemetric extensometer respectively. The creep loci of HANA-4 was found to be not greatly affected by initial state (CWSR or Rx) and R&P values were evaluated to be 1.5 and 0.95 respectively. The simulated creep loci using crystallite orientation distribution functions (CODFs) showed excellent agreement with experimental results.
HANA-4 and FeCrAl
by Pratik Joshi
A thesis submitted to the Graduate Faculty of North Carolina State University
in partial fulfillment of the requirements for the degree of
Master of Science
Nuclear Engineering
Raleigh, North Carolina 2019
APPROVED BY:
_______________________________ _______________________________ Dr. KL Murty Dr. Ron Scattergood
Committee Chair
ii DEDICATION
iii BIOGRAPHY
iv ACKNOWLEDGEMENTS
I am deeply grateful to Dr. K.L. Murty for his constant guidance and support throughout my time at the Nuclear Materials group. He always provided a healthy and conducive atmosphere for learning and research where creativity and innovation was rewarded.
I would like to extend my thankfulness to my committee members Prof. Mohamad Bourham, Prof. Ge Yang and Prof. Ronald Scattergood for their valuable time and thought-provoking critiques.
I would like to thank Dr. Jacob Eapen and Dr. Robert Hayes. I was a teaching assistant for their class and this helped me with my teaching skills and provided me with financial support.
I am very grateful to Dr. Nilesh Kumar, Dr. Abdullah Alomari and Dr. Boopathy Kombiah who acted as my mentors. They helped me hone my experimental skills. I thank Dr. Nedim Cinbiz of ORNL who provided me with the necessary materials, guidance and support when needed.
My thanks are due to Mr. Ervin Miller of Nuclear engineering for helping in solving issues with our instruments to run my experiments smoothly especially the burst testing experiments.
My collegues at the nuclear materials group were special. I would like to thank Leonardi, Zeinab, Micah and Mahmoud. They helped me relax and maintain my calm when somethings didn’t turn out the way they were supposed to be.
I would like to thank Jamison (Undergraduate student) for polishing some of my samples which saved my time and work. Guiding him helped improve my leadership skill.
My stay in Raleigh is one of the best parts in my life thanks to my friends Vikram, Sumit, Nikhil, Pushkar, and Hermab.
v TABLE OF CONTENTS
LIST OF TABLES ... ix
LIST OF FIGURES ... x
CHAPTER 1- THESIS OVERVIEW ... 1
1.1. Introduction ... 1
1.2. Cladding Materials in Nuclear Reactors ... 1
1.2.1. High Fuel Burnup ... 1
1.2.2. Accident Tolerant Cladding ... 2
1.3. Motivation ... 2
1.4. Goals... 2
1.5. Biaxial Creep behavior of HANA-4... 3
1.5.1. Uniaxial and Biaxial Creep Tests of CWSR HANA-4 ... 3
1.5.2. Texture Analysis ... 3
1.5.3. CODF calculation and plasticity modeling ... 3
1.6. Creep Characteristics of FeCrAl ... 3
1.6.1. Burst Test of FeCrAl-C26M2 (12% Cr, 6% Al) ... 3
CHAPTER 2- LITERATURE REVIEW ... 4
2.1. Fundamentals of Creep... 4
2.1.1. Definition ... 4
vi
2.1.2.1. Dislocation glide & climb ... 6
2.1.2.2. Grain Boundary Sliding/ Superplastic flow ... 8
2.1.2.3. Coble and Nabarro-Herring (N-H) creep ... 8
2.2. Zirconium alloys ... 9
2.2.1. Slip systems in Zirconium ... 9
2.2.2. Nb-modified Zr alloys ... 10
2.2.3. Plastic Anisotropy in hcp metals ... 11
2.2.4. Crystalline Orientation Distribution Function ... 13
2.3. Accident Tolerant Fuel Cladding ... 14
2.3.1. Fukushima Accident ... 14
2.3.2. Desirable Properties of fuel and Cladding Materials ... 15
2.3.3. Candidates for accident tolerant cladding materials ... 17
2.3.4 Fe-based cladding materials ... 19
2.3.5. FeCrAl ... 20
2.3.6. Oxidation Behavior of FeCrAl ... 21
2.3.7. Manufacturing of FeCrAl tubes ... 23
2.3.8. Burst behavior of Zr and FeCrAl under LOCA ... 24
2.4. Creep Studies on FeCrAl... 25
CHAPTER 3- EXPERIMENTAL PROCEDURE ... 28
vii
3.1.1. Materials and methods ... 28
3.1.2. Creep Test Specimen ... 28
3.1.3. Creep Testing Equipment ... 28
3.1.4. Creep Test data Acquisition ... 30
3.1.5. Electro-polishing ... 31
3.1.6. Equipment for EBSD/FIB ... 32
3.2. FeCrAl ... 33
3.2.1. Burst test specimen ... 33
CHAPTER 4- CALCULATIONS ... 35
4.1. Stresses in a thin-walled tube ... 36
4.2. Creep strain calculation ... 36
4.3. Grain shape calculations... 37
4.4. Generating creep loci from texture coefficients ... 37
4.5. Burst Test Strain Calculations & Procedure ... 38
CHAPTER 5- RESULTS & DISCUSSIONS ... 39
5.1. Creep curves ... 39
5.2. Evaluation of Creep Anisotropy Parameters ... 44
5.3. Creep loci of HANA-4 ... 46
5.4. Comparison of current experimental creep results with other alloys ... 48
viii
FeCrAl ... 52
5.6. Stress vs rupture time ... 55
5.7. Monkmann-Grant relation ... 56
5.8. Larson-Miller Parameter ... 57
5.9. Activation Energy ... 57
5.10. BMD plot... 59
5.11. Microstructural features of the samples ... 61
5.12. Summary of burst test results ... 62
ACKNOWLEDGEMENTS ... 64
ix
LIST OF TABLES Table 2.1. Constants in equation (1.1) for various creep mechanisms [4] ...19
Table 2.2. The composition of various selected Zr-Nb alloys (in wt. %) [17,18] ...11
Table 2.3. The contribution of the decay heat (in bold) to the total heat produced in the reactor [25]. ...15
Table 2.4. Desirable properties of fuel and cladding materials under different conditions, NR: Normal Reactor, PO: operational Power ramps, H stands for High and L for Low [26] ...16
Table 2.5. Summary of relevant data for cladding material options [27] ...18
Table 2.6. Curie temperature of various FeCrAl grades [46] ...26
Table 2.7. Compilation of creep activation energy for FeCrAl (UNS: unspecified) ...27
Table 3.1. Composition of HANA-4...28
Table 3.2. Chemical composition of FeCrAl-C26M2 tubes ...33
Table 5.1. Summary of the creep rates obtained from biaxial creep tests of HANA-4 from stress ratio of 0-2 at various stresses ...59
Table 5.2. Summary of R & P values obtained...53
x
LIST OF FIGURES Figure 2.1. Schematic of a typical creep curve [1] ...4
Figure 2.2. Depiction of a) Pill-Box Model b) Dislocation Climb ...7
Figure 2.3. Illustration of differences between N-H and Coble creep [7] 8 Figure 2.4. General creep behavior of class M alloys ...9
Figure 2.5. Illustration of various slip systems in hcp metals a) prism b) basal c) pyramidal [7] ...10
Figure 2.6. Versatile oxide layers present in FeCrAl to help cope with LOCA [39] ...21
Figure 2.7. Auger electron spectroscopy (AES) of various elements present in the oxide layers [40] ...22
Figure 2.8. Two major tube drawing process a. Tube drawing [55], b. Pilgering [56] ...23
Figure 2.9. Post burst photographs of Fe-13Cr-5Al for three different burst conditions [42]. ...25
Figure 2.10. Transition in activation energy at Curie temperature for fecralloy stainless steel [45] ...26
Figure 3.1. Biaxial creep sample along with brass mandrel ...28
Figure 3.2. Biaxial creep test setup ...29
Figure 3.3. Schematic of diameter measurement by non-contact laser extensometer ...30
Figure 3.4. Electro-polishing equipment used to prepare a sample for characterization ...31
Figure 3.5. Samples used for FIB-SEM, EBSD (left) and optical microscopy (right) ...32
xi
Figure 3.7. FeCrAl sample used for burst testing ...33
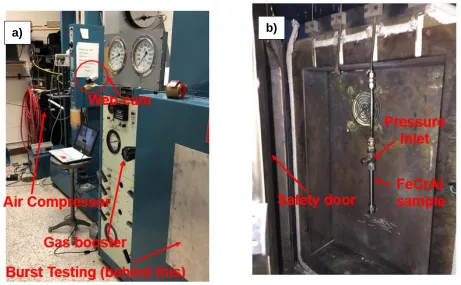
Figure 3.8. Burst testing equipment a) From front, b) From back ...35
Figure 3.9. a) Image captured by webcam during a sample rupture and b) Furnace used for burst test ...35
Figure 5.1. Creep curves from uniaxial creep test of HANA 4 at 500 0C ...39
Figure 5.2. Creep curves from biaxial creep test of HANA 4 at 500 0C at stress ratio of 1 ...39
Figure 5.3. Strain rate vs time at various stresses at 500 0C for stress ratio of 1 ...40
Figure 5.4. Comparison of hoop and axial strains at various stresses for stress ratio of 1 at 500 0 C ...41
Figure 5.5. Creep curves from biaxial creep test of HANA 4 at 500 0C at stress ratio of 2 ...42
Figure 5.6. Creep curves from biaxial creep test of HANA 4 at 500 0C at stress ratio of 1.5 ...42
Figure 5.7. Creep curves from biaxial creep test of HANA 4 at 500 0C at stress ratio of 1.5 ...43
Figure 5.8. Creep curves from biaxial creep test of HANA 4 at 500 0C at various stresses and stress ratios ...43
Figure 5.9. a. EBSD Micrograph, b. Grain size distribution in CWSR condition, c.{0002} basal pole figure and d. intensity vs angle for basal pole peak angle determination ...44
Figure 5.10. Strain-rate ratio versus stress ratio for biaxial creep of HANA-4 alloy ...46
xii
Figure. 5.12. a. FIB micrograph, b. Quantitative measure of elongated grains in r-z plane for as-received HANA-4...51
Figure 5.13. Comparison of creep loci of CWSR Zircaloy-4, Rx and CWSR HANA-4 ...52
Figure 5.14. Creep Loci of CWSR HANA-4 with model prediction assuming prismatic or basal slip ...53
Figure 5.15. Plot depicting stress against rupture time for various temperatures ...55
Figure 5.16. Plot depicting the agreement of Monkman-Grant Relation ...56
Figure 5.17. Effect of stress on Larson Miller Parameter ...57
Figure 5.18. Plot of strain rate vs normalized stress at various temperatures for C26M2-FeCrAl in temperature range of 480-570 0C...58
Figure 5.19. Plot depicting determination of activation energy at constant normalized stress ...58
Figure 5.20. BMD relation for C26M2 in temperature range of 480-570 0C ...59
Figure 5.21. A plot of normalized time against normalized stress illustrating a transition in creep mechanism in temperature range of 480-570 0C ...60
Figure 5.22. Optical Micrograph of a,b) FeCrAl-C26M2 (courtesy: ORNL), and c) FeCrAl- B136Y...61
1 CHAPTER 1- THESIS OVERVIEW
1.1. Introduction
Growing cities, rise in population, and the desire for a modern lifestyle has made the use of sophisticated gadgets inevitable. These gadgets demand a great deal of energy giving rise to the fear of an energy crisis. To combat this problem, most countries rely heavily on power from coal and natural gas. This has resulted in increasing CO2 emissions, responsible for climate change. The issues such as rising air pollution, limited land area, large variations in wind and sunlight make nuclear energy the most attractive option to overcome the shortage of energy in a sustainable way. The major issue faced by nuclear energy is safety during plant operation. This issue can be tackled by continuous innovation in nuclear materials. The presence of severe conditions acting in tandem such as radiation of varying energy, high temperature, highly corrosive environments, and mechanical and thermal stresses make this task challenging.
1.2. Cladding Materials in Nuclear Reactors
The major components of Nuclear reactors are fuel, metal cladding, the reflector, control rods, the moderator, reactor pressure vessel, and structural materials to provide support. The fuel in LWRs is ceramic UO2 in the form of pellets. These ceramic pellets are enclosed in a metal cladding. The metal cladding should be transparent to neutrons so that these neutrons can cause fission of the UO2 fuel.
To make nuclear power more competitive and safe there are two major requirements: 1.2.1. High Fuel Burnup
2 as high fuel burnup. This leads to better plant economics, placing additional demands on fuel cladding most common being high corrosion resistance.
1.2.2. Accident Tolerant Cladding
The release of radioactivity to the environment is a major threat to people’s health in case of a nuclear accident. The most critical barrier to the release of radioactivity to the environment is the cladding material. The innovation of materials in the nuclear sector has been rather slow compared to other sectors. The conventional Zircaloys discovered in the 1950s with some modifications are still being used as cladding materials in current generation reactors. Efforts are underway to find and test the alternative cladding materials better than Zircaloy, this has gained momentum after the recent Fukushima accident since, zirconium doesn’t show high oxidation resistance above 1200 0C. The current candidates to replace Zircaloy are FeCrAl, SiC-SiC Composites, and Chromium-coated Zircaloy.
1.3. Motivation
There is a need to understand creep behavior of cladding materials especially those that are designed to have optimum properties during high fuel burnup (Zirconium based HANA-4) and loss of coolant accidents (Iron based FeCrAl) since this data is scarce or doesn’t exist.
1.4. Goals
This study has two goals:
a) To generate creep loci of as-received HANA-4 by performing biaxial creep tests and to verify the active slip system by using Crystalline Orientation Distribution function (CODF)
3 1.5. Biaxial Creep behavior of HANA 4
This study involved the following:
1.5.1. Uniaxial and Biaxial Creep Tests of CWSR HANA 4
Creep tests were carried out for different axial stresses and hoop stresses, which produced different stress ratios (0, 0.5, 1, 1.5 and 2) at 500 °C. The purpose of the creep tests was to determine the strain-rate, strain ratios vs stress ratios, the anisotropy parameters (R and P), and to generate the creep loci of as-received HANA-4.
1.5.2. Texture Analysis
Texture measurements were carried out on CWSR HANA 4 tubes. The textures were represented in the forms of inverse pole figures and direct pole figures using Electron Backscattered Diffraction (EBSD).
1.5.3. CODF calculation and plasticity modeling
Crystallite Orientation Distribution Function (CODF) is a quantitative measure of crystallographic texture. Anisotropic parameters (R and P), creep strain-rate ratios vs stress ratios and creep loci were predicted from CODF combined with a lower-bound deformation model. 1.6. Creep Characteristics of FeCrAl
This study involved:
1.6.1. Burst Test of FeCrAl-C26M2 (12% Cr, 6% Al)
4 CHAPTER 2- LITERATURE REVIEW
2.1. Fundamentals of Creep 2.1.1. Definition
Creep is time-dependent strain occurring at constant stress (below the yield stress) when the material is subjected to temperatures above 0.4 Tm, where Tm is the absolute melting temperature.
Figure 2.1. Schematic of a typical creep curve [1].
5 2.1.2. Creep Mechanisms
It has been observed that the factors which affect diffusion also affect creep. Hence, creep is a diffusion controlled process [1]. The basic mechanisms in creep can involve not only dislocation motion but also diffusion of vacancies or atoms. Creep becomes generally more pronounced at high temperatures where diffusion of vacancies is considerably faster. However, some materials can creep even at room temperature or sub-zero temperatures [2]. Creep tests at low normalized stresses and low homologous temperatures are time-consuming since the strain rate can be pretty low. Hence, creep tests are usually carried out at high homologous temperatures and normalized stresses to measure steady-state creep rate in short duration. However, carrying out tests at too high stresses can result in Power Law breakdown (PLB). Additionally, blindly extrapolating these results to low temperature and stresses can lead to erroneous results as there can be transitions in creep mechanisms. A general equation representing the steady-state creep rate controlled by any of the creep mechanisms can be stated as follows in the form of BMD equation [3],
where 𝜀̇ is the steady state creep rate, D the diffusion coefficient that characterizes a particular creep mechanism, E the elastic modulus, b the burger’s vector, kb the Boltzmann Constant, T the temperature, d the grain size, 𝜎 the applied shear stress, A the pre-factor, p the inverse grain size exponent and n the stress exponent. Table 2.1 shows the values of the constants predicted for various creep mechanisms
𝜀̇𝑘𝑏𝑇 𝐷𝐸𝑏 = 𝐴 (
𝑏 𝑑)
𝑝 (𝜎
𝐸)
6 Table 2.1. Constants in equation (1.1) for various creep mechanisms [4].
Creep Mechanisms A p n
Coble 100 3 1
Nabarro-Herring 12 2 1
Grain boundary sliding 200 1-2 2
Dislocation glide 6 0 3
Dislocation climb 6 x 10⁷ 0 4-7
2.1.2.1. Dislocation glide & climb
The rate controlling mechanism for creep in power-law region can be either dislocation glide or climb depending on the applied stress, temperature and metal class (Class A- alloy class or Class M -pure metal). In general, for class A alloys, dislocation glide becomes slower than climb owing to the interaction of solutes with dislocations and therefore acts as the rate-controlling mechanism. For Class M alloys the opposite is true. Weertman proposed his model to predict the creep rate for glide mechanism. He assumed the dislocation velocity is proportional to the stress acting on them [5].
The average dislocation velocity [6] is given by,
v = 𝐴𝜎2𝑏2𝐿 (2.2)
where A is a constant decided by the type of viscous-glide mechanism. If the dislocation source density is assumed to be M and the dislocation line length is taken to be Λ, the creep rate can then be written as,
𝜀̇𝑠𝑠 𝛼 𝐴 ΛMb𝜎2𝑏2𝐿 (2.3)
Weertman obtained values of Λ and 𝐿 to be 3𝐿 and (2𝜎/(𝐺𝑏𝑀))0.5
7
(𝜀̇𝑠𝑘𝑏𝑇
𝐷𝐸𝑏 ) = 6 ( 𝜎 𝐸)
3 (2.6)
Dislocation climb is well explained by Weertman pill-box model [7,8]
Figure 2.2. Depiction of a) Pill-Box Model b) Dislocation Climb.
This model is referred to as a pill-box model, whose schematic is given in Figure 1.12. In this model, the M number of dislocation sources per unit volume is assumed to be operative. The dislocations generated from the sources glide for a distance of L before climbing up or down to get annihilated with the dislocations approaching in parallel planes. The climbing height is assigned to be h. As seen in Figure 1.12, each dislocation source generates a constant number of dislocation loops on the glide plane. Once the leading dislocation gets annihilated, a dislocation will be released from the source. Based on these initial settings, Weertman has obtained the following relation for the creep rate,
𝜀̇ = 𝛼 ( 𝐷𝑙 𝑏3.5𝑀0.5) (
𝜎 𝐺)
4.5 (𝐺𝛺
𝑘𝐵𝑇)
(2.7)
G is the shear modulus, Ω is the atomic volume,is a constant whose values are in the range
0.15 𝛼 <0.33, and 𝐷𝑙 = 𝐷0exp (
−𝑄𝑙
8 2.1.2.2. Grain Boundary Sliding/ Superplastic flow
Grain boundary sliding can also cause plastic deformation under certain conditions. The strain caused by grain boundary sliding is due to the relative motion between the grains resulting from shear stress at the boundaries. This is particularly true at moderate temperatures and low stresses in fine-grained materials [9]. The creep rate obtained by Mukherjee for superplastic flow is as follows [10],
𝜀̇ = 2 (𝐷𝑔𝑏𝐸𝑏 𝑘𝐵𝑇 ) (
𝜎 𝐸)
2 (𝑏
𝑑)
2 (2.8)
2.1.2.3. Coble and Nabarro-Herring (N-H) creep
Coble creep and N-H creep are diffusion creep mechanisms. The major difference between the two is N-H creep is volume diffusive whereas coble creep is grain boundary diffusive as shown in figure 2.3. In N-H creep the creep rate is inversely proportional to the square of grain diameter and in Coble the creep rate is inversely proportional to the cube of grain diameter.
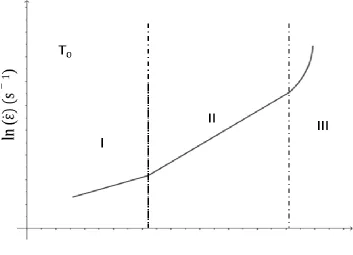
9 Figure 2.4. General creep behavior of class M alloys.
For Class M alloys in the region I diffusion creep is dominant followed by dislocation climb in region II. PLB takes place at (𝜎
𝐸)>10
-3 and (𝜀̇
𝐷)>10
13 m-2 which is region III. The
equation for creep rate used in Power law breakdown is:
𝜀̇
𝐷𝐿 = 𝐴 𝑒𝑥𝑝 ( 𝐵𝜎 𝑘𝐵𝑇)
(2.9)
Where B is related to the activation area for creep. 2.2. Zirconium alloys
2.2.1. Slip systems in Zirconium
10 vector. In short, slip takes place on the planes having the lowest critical resolved shear stress (CRSS). In Zr, the pyramidal slip system has the least Critical Resolved Shear Stress (CRSS) and is dominant [11]. Basal slip has been observed at Room Temperatures, at very high strain rates [12]. Akhtar [13] observed basal slip in pure Zr single crystals above 577oC. At 700oC he reported its CRSS to be ~4 MPa and the CRSS for prismatic slip ~2.5 MPa. In contrast, Wu et al [14] have predicted easy activation of basal slip at room temperature (RT) in Zircaloy-2.
Figure 2.5. Illustration of various slip systems in hcp metals a) prism b) basal c) pyramidal [7].
2.2.2. Nb-modified Zr alloys
11 second Russian alloy for VVER application was E635, which contained both Sn and Nb [15]. The research and developments of the advanced fuel for a high burn-up was started in 1997 by Korea Atomic Energy Research Institute (KAERI) in collaboration with Korea Nuclear Fuel Company (KNFC) and several universities in order to meet the global demand for an extension of the fuel discharge burn-up to more than 70 GWd/MtU. As a result of the extensive research activities, KAERI had developed six kinds of advanced Zr alloy claddings named HANA (High-performance Alloy for Nuclear Application) [16].
Table 2.2. The composition of various selected Zr-Nb alloys (in wt. %) [17,18].
Materials Country of Origin
Nb Sn Fe Cr Cu O
E110 Russia 0.95-1.05 - 0.006-0.012 - - ≤ 0.1
E110K Russia 0.95-1.05 - 0.006-0.012 - - 0.12-0.16
E365 Russia 0.95-1.05 1.1-1.3 0.3-0.4 - - 0.05-0.12
M5 France/USA 0.8-1.2 - 0.015-0.06 - - 0.09-0.13
ZIRLO® USA 0.9-1.13 0.9-1.2 0.1 - - 0.09-0.15
MDA Japan 0.5 0.8 0.2 0.1 - -
HANA-3 Korea 1.5 0.4 0.1 - 0.1
HANA-4 Korea 1.5 0.4 0.2 0.1 - 0.12
HANA-5 Korea 0.5 0.8 0.35 0.15 0.1
HANA-6 Korea 1.1 - - - 0.05
2.2.3. Plastic Anisotropy in hcp metals
12 Due to a limited number of slip systems present, mechanical working or thermal treatment is sufficient to make these materials anisotropic.
The Hill’s equation for anisotropic material is given as follows:
𝐹(𝜎𝑦− 𝜎𝑧)2+ 𝐺(𝜎𝑧− 𝜎𝑥)2+ 𝐻(𝜎𝑥− 𝜎𝑦)2+ 2𝐿𝜏𝑦𝑧 2 + 2𝑀𝜏𝑧𝑥 2 + 2𝑁𝜏𝑥𝑦 2 = 1
where F, G and H are functions of material yield strengths and 𝜎𝑥 , 𝜎𝑦 and 𝜎𝑧 are principal stresses along normal, transverse and rolling directions respectively . This is also the generalized form of Von-Mises criterion. Later, this equation was modified by Backofen by defining
R=𝐹
𝐻 and P= 𝐹 𝐺
Following the convention adopted by Woods and Duncombe [19], a generalized stress is defined as the uniaxial yield stress along the rolling direction which is as follows:
𝜎𝑔 =𝑅(𝜎𝑟− 𝜎𝜃)
2+ 𝑅𝑃(𝜎
𝜃− 𝜎𝑧)2+ 𝑃(𝜎𝑧− 𝜎𝑟)2 𝑃(𝑅 + 1)
For thin tube, radial stress can be assumed to be zero,
The degree of anisotropy can be quantitatively known by R and P parameters which are defined as:
Where, 𝜀̇𝜃 and 𝜀̇𝑟 are strain rates in hoop and radial directions respectively [20].
𝜎𝑔 = (𝑅𝛼
2+ (𝛼 − 1)2𝑅𝑃 + 𝑃
𝑃(𝑅 + 1) )
1/2 𝜎𝑧
(2.10)
R= (𝜀̇𝜃
𝜀̇𝑟)𝜀 𝑧
,𝜎𝜃 = 𝜎𝑟 = 0 (2.11)
P=(𝜀̇𝑧 𝜀̇𝑟)𝜀
𝜃
13 These parameters also define the wall thinning resistance of an isotropic material and thus control the formability. Formability of these textured materials is characterized by the Backofen formability parameter (B) [21] defined as:
B=√(𝑅+1)(𝑅+4𝑅𝑃+𝑃)4𝑅(𝑅+𝑃+1) (2.13)
2.2.4. Crystalline Orientation Distribution Function
Macroscopic texture can be used to qualitatively describe the anisotropic mechanical properties of hcp metals. ODF describes the volume fraction of crystallites having the orientation of the crystal axis with reference to a fixed coordinate system (RD, TD, and ND). ODF can be fitted by a series expansion with suitable mathematical functions. These functions are spherical harmonic functions [22].
𝜔(𝜃, 𝜓, 𝜑) = ∑ ∑ ∑ 𝑊𝑙𝑚𝑛𝑍𝑙𝑚𝑛(cos 𝜃)𝑒−𝑖𝑚∅𝑒−𝑖𝑛∅ 𝑙
𝑛=−𝑙 𝑙
𝑚=−𝑙 ∞
𝑙=0
(2.14)
Where, Wlmn and Zlmn are termed as series coefficients and augmented Jacobi polynomials, respectively.
The average property of a polycrystalline aggregate is given as
< 𝜌(𝜃, 𝜓, 𝜑)>=∫02𝜋∫02𝜋∫ 𝜌(𝜃, 𝜓, 𝜑)−11 𝜔(𝜃, 𝜓, 𝜑)𝑑(cos 𝜃)𝑑𝜓𝑑𝜑 (2.15)
14 The creep rate in power-law region is given by:
𝛾̇𝑘= 𝐴 (𝜏 𝜏0)
𝑛 (2.16)
Here, A is the reference shear stress, 𝜏0 is the reference shear stress on kth slip system and n is the stress exponent. The total strain-rate in the crystal is the sum of the contribution from each active slip systems.
𝜀̇𝑐
𝑖𝑗 = ∑ 𝜇𝐾 𝑖𝑗𝑘𝛾̇𝑘 (2.17)
Where, 𝜇𝑖𝑗 is the geometric tensor connecting slip co-ordinates with crystal co-ordinates.
Also,
𝜏𝑘 = 𝜎𝑖𝑗𝑐𝜇𝑖𝑗𝑘 (2.18)
2.3. Accident Tolerant Fuel Cladding 2.3.1. Fukushima Accident
In 2011, a tsunami wave spanning a height of 15 m hit three Fukushima Daiichi reactors [24]. After the fission reaction was stopped, the fission products were still in the radioactive state, hence they emitted beta, alpha and gamma rays. These rays produce what is called decay heat in the reactor. Hence, the coolant needed to be kept circulating to cool the reactor. The diesel generators, which were planned to be used as an emergency backup for circulating the coolant in the reactor failed. Because of failure of heat removal by circulation to an outside heat exchanger, the temperature close to the zirconium cladding rose to about 12000 C. Zirconium oxidizes easily above 12000 C, reacting with water to release hydrogen and forming ZrO2. This reaction is exothermic and produces large amounts of heat and hydrogen [25].
15 This is called a loss of coolant accident (LOCA). The amount of generated hydrogen gas blew off the containment rooftop. Due to severe oxidation, the Zr cladding failed and lead to the release of radioactivity to the environment.
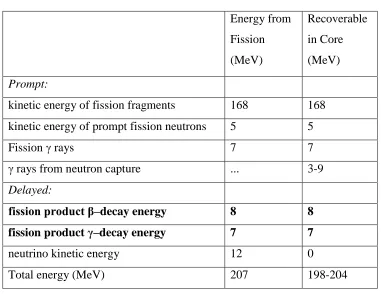
Table 2.3. The contribution of the decay heat (in bold) to the total heat produced in the reactor [26].
2.3.2. Desirable Properties of fuel and Cladding Materials
The cladding material and fuel are the main components of the reactor. Ideally, these components should be able to adapt to any changes that take place in a reactor i.e LOCA or station blackout. Unfortunately, a property which is desirable under normal condition may not be desirable under other conditions. Table 2.4 shows the desirable properties under a different set of operating temperatures.
Energy from Fission (MeV)
Recoverable in Core (MeV)
Prompt:
kinetic energy of fission fragments 168 168 kinetic energy of prompt fission neutrons 5 5
Fission γ rays 7 7
γ rays from neutron capture ... 3-9
Delayed:
fission product β–decay energy 8 8
fission product γ–decay energy 7 7
neutrino kinetic energy 12 0
16 Table 2.4. Desirable properties of fuel and cladding materials under different conditions, NR:
Normal Reactor, PO: operational Power ramps, H stands for High and L for Low [27].
Cladding Fuel Pellet
Properties NR PO LOCA NR PO LOCA
Thermal Conductivity
H H H H H H
Heat Capacity
- - H - - H
Oxidation rate
L L L - - L
Coefficient of thermal expansion
- - - - L -
Creep rate H H L H H -
17 As depicted in table 2.4, adequate but not excessive, creep in both components and high cladding strength are desired under normal operating conditions to avoid and withstand stress buildup in the cladding. Minimization of cladding corrosion to avoid thickness loss in the load-bearing cladding tube is desirable. Under power ramps, high thermal conductivity and creep rates along with a low coefficient of thermal expansion are desirable in the fuel pellet to minimize pellet cladding mechanical interaction (PCMI). In the cladding, high strength along with the ability to accommodate pellet expansion via creep is highly desirable. For a design basis LOCA, high thermal conductivity is desirable in the fuel and the cladding to reduce the thermal energy stored in the pin. At the same time, high heat capacity is also desirable since it will reduce the rate of temperature rise as a result of decay heat. During LOCA, of great importance is the reduction of cladding oxidation rate to limit its degradation during accident progression and loss of post-quench ductility. Cladding creep resistance is highly desirable to delay fuel rod burst and ballooning [27]. 2.3.3. Candidates for accident tolerant cladding materials
18 Table 2.5. Summary of relevant data for cladding material options [28].
Clad Material
Density [g/cm3]
Composition [wt.%] ∑thermal abs
[cm-1]
POR constant in 1200 0 C steam [mg] Zircaloy 6.56 98.26 Zr, 1.49 Sn, 0.15 Fe, 0.1 Cr 0.0028 6.5x10⁻⁴ 304SS 7.9 71.35 Fe, 18.9 Cr, 8.35 Ni, 0.7 Mn,
0.42 Si, 0.27 Mo
0.078 8.5x10⁻⁴
310SS 8.03 52.55 Fe, 25.22 Cr, 19.51 Ni, 1.9 Mn, 0.7 Si, 0.12 Mo
0.0880 1.3x10⁻⁵
FeCrAl 7.1 75 Fe, 20 Cr, 5 Al 0.0634 1.8x10⁻⁶
SiC 2.58 70.08 Si, 29.92 C 0.0021 3.7x10⁻⁷
From table 2.5, It is clear that SiC has the lowest thermal absorption cross-section followed by Zircaloy. Steels have high thermal neutron absorption cross-sections. SiC/SiC composites are anticipated to provide additional benefits over zirconium alloys: they provide smaller neutron absorption cross sections, general chemical inertness, ability to withstand higher fuel burn-ups and higher temperatures, exceptional inherent radiation resistance, lack of progressive irradiation growth and low induced activation/low decay heat. Moreover, SiC is considered to be permanently stable in nuclear waste [29].
19 the cladding thickness [30]. Although SiC/SiC composites are deemed the ideal ATC material, a lot of research is needed to overcome their current limitations.
2.3.4. Fe-based cladding materials
Previously, various 300-series Fe-Cr-Ni based stainless steel variants (304, 316, 347, 348, etc.) have been used as nuclear fuel cladding in several LWRs because of their low cost compared to Zirconium alloys. The alloying element Ni has high thermal absorption cross-section and hence, reactors gradually migrated away from using steel cladding [31].
The operation of stainless-steel cladding is generally thought to have been successful, at least for PWRs, despite several fuel failures. Many of the problems with this cladding were eventually addressed, but not before a significant transition to zircaloy cladding had already started [32].
Fuel failures from the La Crosse BWR were generally attributed to PCMI and intergranular stress corrosion cracking, similar to failures from Big Rock Point, Dresden-1, and Humbolt Bay. After the implementation of power restrictions, the cladding failure rate decreased. These examples of stainless steel cladding failure, in particular at the Connecticut Yankee PWR and the La Crosse BWR, demonstrate that the stainless-steel cladding was not necessarily the limiting factor. It should also be pointed out that these fuel rods were operated at comparatively lower linear heat rates (maximum average LHR at 15 kW/m) than zircaloy-cladded fuel (~%75), however many did not contain the fuel rod pre-pressurization, fuel pellet dishing and chamfering, and ramp rate restrictions that are exercised today [33].
20 nothing to do with the replacement of stainless-steel cladding but mostly everything to do with improved operational guidelines.
2.3.5. FeCrAl
First Fe-Cr-Al alloy, KANTHAL® was invented by Hans von Kantzow in Sweden in the 1930’s [34]. These alloys generally have up to 22% Cr. But high Cr has been found to nucleate alpha prime phase known to cause 475oC embrittlement. Total Elimination of Cr is not possible because the minimum 12% Cr is necessary for sufficient oxidation resistance. G.Bonny et al [35] using Calphad calculations recently predicted that Al additions are beneficial to get rid of 4750 C embrittlement. Hence, for fuel cladding applications lean Cr (12-14%) and 4-6% Al compositions have been chosen. Also, some yittria is added to maintain high-temperature oxidation resistance to compensate for low Cr in these alloys. These alloys are different than the austenitic stainless steels described in the last section. Recent tests have shown that high chromium ferritic, BCC alloys offer superior stress corrosion cracking resistance compared to austenitic steels like the 300-series stainless steel variants described in section 2.3.4 [32]. Also, Ferritic steels have some advantages in void swelling, thermal properties and strength at elevated temperature, compared to austenitic steels [36]. Additionally, it is well known that Oxide Dispersion Strengthened alloys have a major advantage in terms of void swelling under irradiation. Hence, ODS FeCrAl is also being considered for Accident Tolerant fuel cladding application.
21 which need attention before FeCrAl goes on to be used as a cladding material in commercial reactors. Firstly, FeCrAl cladding may release more tritium to the coolant than Zirconium alloys one solution for this problem might be coating inside part of the tube with alumina [38]. Second is the alpha prime precipitation in FeCrAl after neutron irradiation which is still under investigation, a recent study by Zinkle et al [39] found that ODS FeCrAl has an order of magnitude less alpha prime precipitation than conventional FeCrAl alloys which is promising.
2.3.6. Oxidation Behavior of FeCrAl
Figure 2.6. Versatile oxide layers present in FeCrAl to help cope with LOCA [40].
22 J. Engkvist et al [41] studied the influence of Al-concentration on oxide layer characteristics of FeCrAl. In this study, alloys containing 20 wt% Cr and varying aluminum content from 1.2-5 wt% were oxidized at 9000 C for 72 hrs. They found out that a critical aluminum concentration of 3.2% was necessary to form a continuous and Protective Alumina layer.
Figure 2.7. Auger electron spectroscopy (AES) of various elements present in the oxide layers [41].
23 scale formed most stable alumina at the inner interface, the secondly most stable chromia in the center and the less stable iron-based oxide at the outer surface. For alloys greater than 3.2 wt% Al, a smooth and continuous alumina film forms on the surface followed by a mixed layer of Chromia and iron oxide. The surface morphology of the formed oxide layers becomes smoother and the oxide grain structure becomes finer with increasing Al-concentration in the FeCrAl alloy.
2.3.7. Manufacturing of FeCrAl tubes
Model FeCrAl alloys for cladding application
The newly developed nuclear grade FeCrAl alloys by Oak Ridge National Laboratory (ORNL) are called as model FeCrAl alloys. Tube drawing of model FeCrAl alloys is planned by using tube drawing or Pilgering operation. Tube drawing is known to induce tensile stresses in the material whereas Pilgering is known to induce compressive stresses in the material the latter being beneficial for cladding material. Extensive work has been carried out by Yamamoto et al for design and property based evaluation of many model FeCrAl alloys and shortlisting a few for cladding application [42].
24 The work for alloy development was divided into 2 phases. In Phase 1, utilizing the thermodynamic data various alloy compositions were selected, and the alloys were cast by arc-melting in a back-filled argon gas atmosphere with pure element feedstock and/or pre-alloyed Y-Al to make 400-800 g button ingots. Various alloy series standard were developed by ORNL for model FeCrAl alloys. In case of “B series” alloys, the first two numbers in the alloy designation refer to nominal target Cr composition while the third number refers to nominal Al Composition. In phase 2 minor alloying elements such as Mo, Si, Nb and/or C were added to introduce solid-solution strengthening and precipitation hardening. For more detail’s reader may refer to [42]. 2.3.8. Burst behavior of Zr and FeCrAl under LOCA
A study was performed by Terrani et al [43] which aimed at stimulating burst behavior of Zircaloy and FeCrAl under LOCA. The tubings of both these materials were filled with zirconia pellets and were internally pressurized at room temperature then subjected to temperature ramping of 50 C/s from 300 to 1200 C, holding at 1200°C for 3 min, ramp-down to 800°C (~5°C/s), and finally, quenching with room temperature water. It was observed that both the materials had different failure modes. Zr tube ballooned and failed at the point of minimum thickness whereas unlike Zr-based alloys, cladding cross-sectional area of FeCrAl remained largely unchanged up to the point of burst. Therefore, for a given rod internal pressure, the temperature onset of burst in Fe-based alloys appears to be simply a function of the alloy's ultimate tensile strength, particularly at high rod internal pressures.
25 ballooning with a small burst opening. As shown in Figs. 2.9, the large burst openings in Fe-based alloys may accommodate coolant flow past the rod [43].
2.4. Creep Studies on FeCrAl
Research on FeCrAl alloys for cladding is ~50 years old and ODS FeCrAl was first commercialized more than 30 years ago [44,45]. Not a lot of creep studies have been done at low stresses and LWR temperatures. Since the creep rate at that stresses and temperatures are thought to be pretty low. A study carried out in the 1980s by Jones et al [46] found n value of 5.5-5.8 in the temperature range of 650-800 0C suggesting dislocation climb mechanism. They saw a transition in activation energy at the Curie temperature which they claim as 7100 C for their alloy and explained it on the basis of change in lattice diffusivity at Curie temperature. Table 2.6 shows the Curie temperature of various new FeCrAl grades.
26 Figure 2.10. Transition in activation energy at Curie temperature for fecralloy stainless steel [46].
Table 2.6. Curie Temperature of various FeCrAl grades [47].
Whittenberg [45] tried some creep tests on ODS MA 956-E (20 Cr, 4.5 Al) alloy at 10920 C. He reported that MA-956E does not easily undergo slow plastic deformation. Rather than deform under creep loading conditions, the alloy apparently fails by a crack nucleation and growth
Alloy ID Cr, Al (wt%) TC (K)
Kanthal APMT 21,5 852
C06M 10,6 888
C35M 13,5 870
27 mechanism and there appears to be threshold stress below which crack nucleation and/or growth does not occur.
Table 2.7. Compilation of creep activation energy for FeCrAl (UNS: unspecified).
Material Cr,Al
(wt%)
Temp Range (0C)
n Q (kJ/mol) Stress regime (MPa)
Ref
T35 AY 13,5 UNS 3.7-3.9 248-258 UNS [48]
C35M, C35MN 13,5 <600 800
5.5 10
247 -
UNS 20-26
[43,49]
Fecralloy 1 22,5 500-1100 5.5 392 UNS [50]
Fecralloy 2 14,4.5 >725 5.5 277 <100 [46]
Fecralloy 2 14,4.5 <710 5.8 489 <100 [46]
Fecralloy 2 14,4.5 <710 10.5 489 >100 [46]
Fecralloy 3 UNS UNS 5.29 486 UNS [51]
28 CHAPTER 3- EXPERIMENTAL PROCEDURE
3.1. Biaxial creep test of HANA-4 3.1.1. Materials and methods
HANA-4 alloy tube used in the present investigation was received from KAERI in CWSR condition. The average outer diameter and thickness of the tubes were 9.43mm and 0.6 mm respectively which were measured by Vernier Caliper.
Table 3.1. Composition of HANA-4.
Materials Country of Origin
Nb Sn Fe Cr Cu O
HANA-4 Korea 1.5 0.4 0.2 0.1 - 0.12
3.1.2. Creep Test Specimen
Each sample for creep tests had a length of around 117 mm. Fig 2. Shows the sample and the brass mandrel that was inserted into the tubing during biaxial creep test. There is a possibility of tube burst on the application of high gas pressure, but when the mandrel is inserted into the tube the low gas volume (due to mandrel) present in the tube will not cause serious accidents.
29 3.1.3. Creep Testing Equipment
The biaxial creep experiments were conducted on an ATS® model-2330 lever arm (ratio 20:1) machine in combination with an internal pressurization system, which floods the hollow tube with argon gas (Figure 3.2). Biaxial creep Tests were performed for the stress ratios of 0, 0.5,1 and 2 at each stress ratio, 5-6 different stresses were applied. These tests at different stresses were performed until a steady state was achieved. The temperature was monitored with the help of a K-type thermocouple placed at the center of the sample. The gauge length of the sample was 1 inch. The axial and hoop displacement data were continuously logged into a computer using a data acquisition system. . Note that the axial steady-state creep rate was not recorded for a stress ratio of 2, this is because it was assumed that the axial creep rate is negligible compared to the hoop creep rate. Also, for the uniaxial experiments, the hoop creep rate was not obtained. The hoop strain is expected to be negligible in axial loading conditions.
30 3.1.4. Creep Test data Acquisition
During each creep test, the circumferential and the axial strains were measured at a point where the specimen temperature was known and maintained. To measure the hoop strain, a laser measurement device was used (see Figure 3.2). The Techmet® LaserMike™ Model 162 consists of two parts, a laser emitter, and a receiver. As shown in Figure 3.3, the uninterrupted width of the laser beam is known by the receiver and when the specimen is placed into its path, a portion of the center of the laser beam is blocked. This portion corresponds to the diameter (d) of the specimen. The voltage signal is generated based on the portion of the laser that is blocked. Care was taken to keep the sample straight and not bent at an angle as this might introduce error in the reading.
Figure 3.3. Schematic of diameter measurement by non-contact laser extensometer.
31 3.1.5 Electro-polishing
For characterizing samples using EBSD (Electron Backscattered Diffraction) and FIB-SEM (Focused Ion Beam-Scanning Electron Microscope), HANA-4 samples were first polished on a polishing machine to mirror finish and then subjected to electro polishing. The width of the polished sample had to be pretty small for the sample to fit in the electropolishing sample holder. The equipment is shown in figure 3.4.
Figure 3.4. Electro-polishing equipment used to prepare a sample for characterization.
32 3.1.6. Equipment for EBSD/FIB
EBSD was performed on Field Emission Scanning Electron Microscope – FEI Verios 460L equipped with a detector named “Symmetry”, providing superior orientation microscopy capabilities. Speeds up to 3200 pixels/second are achievable, even at reduced operating voltages and beam currents. This equipment is a part of the Analytical Instrumentation Facility (AIF) at NC State University.
Figure 3.6. VERIOS SEM equipped with EBSD at AIF.
33 Focused-Ion-Beam was used to get the general tube microstructure along axial, hoop and radial directions. This technique is especially useful for textured material as the ion beam etches away etch grain according to the grain orientation and due to contrast generated the grains become visible. This equipment is also part of AIF.
3.2. FeCrAl
3.2.1. Burst test specimen
Burst testing was performed using a sustained gas pressurization system (ATS model 1815) capable of gas pressurization to about 17,000 psi the same one that was used for biaxial creep test. Figure 3.7 shows a typical C26M2 burst specimen before the test. Burst test specimens were 12.7 mm (5”) in length. The average outer diameter of the tubes was 9.46 mm and the thickness was 0.39 mm. On both ends, 3/8” Swagelok fittings were installed and a mandrel was inserted into the center to decrease the volume of high-pressure gas within.
Table 3.2 Chemical composition of FeCrAl-C26M2 tubes
Figure 3.7. FeCrAl sample used for burst testing. Etchant for FeCrAl Microstructure
The etchant used was freshly prepared glyceragia: Hydrochloric acid 15ml; Nitric acid - 5ml; Glycerol - 10ml.
The sample was swabbed with cotton for 0.5-1 min. Glyceragia was not stored.
Element Cr Al Mo Si Y Fe
34 3.2.2. Data acquisition
A web-camera was attached in front of the pressure gauge. This camera was connected to a laptop equipped with Webcam looker (a motion detection software) which was used to accurately detect the rupture time (tr) and was used to monitor pressure leaks before starting the test. Figure 3.8 shows this equipment. Two thermocouples were utilized to check the sample temperature one connected at the top and another at the bottom of the sample. The furnace used was capable of reaching temperatures up to 1273 K.
a) b)
35 Figure 3.9. a) Image captured by webcam during a sample rupture and b) Furnace used for burst
test.
a)
36 CHAPTER 4 -CALCULATIONS
4.1. Stresses in a thin-walled tube
A thin-wall approximation was applied to the HANA-4 tubing in the calculation of axial and hoop stresses because the wall thickness (t) to outer diameter (Do) ratio was less than 0.1. The radial stress can be assumed to be negligible due to the geometry of the tube. Biaxial stress state was imposed by applying axial load and closed-end internal pressurization of the HANA-4 tubes using argon gas. Biaxial creep tests were carried out at different stress ratios (α) defined as
Where 𝜎𝜃 and 𝜎𝑧 are hoop and axial stresses respectively. The hoop stress is given by:
σθ =
𝑃(𝐷02+ 𝐷𝑖2) 𝐷02− 𝐷
𝑖2
(4.2)
Where P is applied pressure, D0 and Di are outer and inner tube diameters. The axial stress is given by:
σZ =𝜎𝜃 2 +
4𝑊 𝜋(𝐷𝑜2− 𝐷𝑖2)
(4.3)
where W is applied axial load to the sample [22].
A value of α=0 corresponds to a pure axial load where α=2 indicated stress only from internal pressurization.
4.2. Creep strain calculation
Before starting the test, the LVDT used was calibrated. LVDT was fixed on the extensometer. The movable part (spring) of LVDT was displaced by a fixed distance and the corresponding change in voltage was recorded. For accuracy, the calibration was performed at small distances and many data points for a voltage corresponding to a fix displacement were generated. This data was plotted
α = 𝜎𝜃
𝜎𝑧
37 in Excel™ and the equation between displacement and voltage was recorded. This was used to get the engineering axial strain (ez). It was converted to true axial strain (ɛz) by using equation 4.4.
𝜀𝑍 = ln(1 + 𝑒𝑍) (4.4)
This true strain was then plotted with respect to time. The slope of this curve in the steady-state region gave the value of steady state strain rate. The steady state attained was verified by taking derivative of strain vs time curve and seeing if it had attained a minimum value.
For measuring true hoop strain, a similar procedure was used. To analyze data in these plots ORIGIN software was used.
4.3. Grain shape calculations
To measure the grain-shape anisotropy from optical microstructure Image-J software was used. The image was first converted to 8-bit. Later, Image threshold was adjusted such that only grain boundaries were particularly visible. Then through the measure option in Image J. major and minor axis of grains were measured, the ratio of which gave measure of elongation for each grain. 4.4. Generating creep loci from texture coefficients
38 and PYRAMID. The first file gave R & P values for various slip systems and other 4 files gave the creep loci data assuming that Basal, prism or pyramidal slip system is active.
4.5. Burst Test Strain Calculations & Procedure
During the burst tests, the strain is not measured in situ as done during the creep tests. The total accumulated hoop strain is calculated from diametric measurements performed after rupture. Once the specimen has burst, the time to rupture is recorded and the specimen is removed from the furnace. After sufficient cooling, measurements along the diameter are taken away from the area of the fracture. A region of almost constant diameter was selected along the tube on both sides of the fracture and was averaged to produce the average diameter. The average diameter (d) and original diameter before test d0 after testing was used in Equation 4.5 to arrive at the uniform circumferential elongation (UCE).
UCE = ln (𝑑 𝑑𝑜)
(4.5)
The UCE was divided by Rupture Time (tr) to get an approximate creep rate.
𝜀̇ = 𝑈𝐶𝐸 𝑡𝑟
39 CHAPTER 5- RESULTS & DISCUSSIONS
5.1. Creep Curves
Figure 5.1. Creep curves from uniaxial creep test of HANA 4 at 500 0C.
40 Figure 5.1 demonstrates uniaxial creep deformation characteristics of as-received HANA-4. As expected the steady-state creep rate increases as stress is increased. The steady-state creep rate for the stress of 40 MPa was noted to be about 3.28 x 10⁻⁸ s-1, whereas it increased to 8.54 x 10⁻⁷ s-1 for the stress of 80 MPa
Figure 5.2 shows creep curves for stress ratio of 1 i.e. equibiaxial condition. The first derivative of creep strain w.r.t time is plotted in Figure 5.3 It was found that after some time the strain rate was almost constant which was used as an indicator to know when the steady state was reached. As expected, lower the stress more time is required to attain a steady state.
Figure 5.4 compares hoop and axial strains for various stresses. It must be noted that even though it looks like the axial strain is greater than hoop strain for almost all the stresses except 90 MPa. The difference between axial and hoop steady state strain rate is not that large. The ratio of the hoop to axial steady state strain rate ranges from 0.38 at 33 MPa to 1.49 at 90 MPa. So, for all practical purposes, in stress range of 53-90 MPa the rate of deformation along both directions can be assumed identical. At low axial stresses the deviation from this value can be attributed to Figure 5.3. Strain rate vs time at various stresses at 500 0C for stress ratio of 1.
0 5 10 15 20 25 30
10-9 10-8 10-7 10-6 Axia l s tra in ra te (s -1 ) Time (hrs) 45 MPa 53 MPa 61 MPa 80 MPa Material : HANA 4
Biaxial Creep Test Temperature: 500 oC Stress ratio,
Axial Stress (z)
0 5 10 15 20 25 30
10-9
10-8
10-7
10-6
Axial Stress (z)
Hoo p s tra in ra te (s -1 ) Time (hrs) 45 MPa 53 MPa 61 MPa 80 MPa
41 different creep mechanism(s) as seen from Figure 5.11, there are transitions in creep mechanisms from low to high axial stresses. Boopathy et al [1] have found the transitions in Rx-HANA4. They observed that at low stresses diffusion creep dominated at moderate stress levels rate controlling mechanism shifted to dislocation glide and at high stresses again changed to dislocation climb.
Figure 5.5 depicts the creep curves for stress ratio 2 i.e. only internal pressurization and no axial load. The axial strain measured was negligible and hence only hoop strain is shown.
0 4 8 12 16 20 24 28 0.0
0.1 0.2 0.3
0 4 8 12 16 20 24 28
0.0 0.1 0.2 0.3
0 2 4 6 8
0.0 0.1 0.2
0 1 2 3
0.0 0.1 0.2
0.00 0.25 0.50 0.75 1.00 0.0
0.1
0.0 0.5 1.0
0.0 0.1 0.2
True cree
p strain (%)
Axial Strain
Hoop Strain
33 MPa
=1
90 MPa 80 MPa 53 MPa 45 MPa 61 MPa Time (hr)42 Figure 5.5. Creep curves from biaxial creep test of HANA 4 at 5000C at stress ratio of 2.
43 Figure 5.7. Creep curves from biaxial creep test of HANA 4 at 5000C at stress ratio of 1.5.
0
1
2
3
4
5
0.0
0.2
0.4
0.6
z MPa
z MPa
z MPa
z MPa
z MPa
z MPa
MPa
MPa
MPa
% True
Stra
in
Time (hrs)
Hoop Strain Axial Strain MPa
Figure 5.8. Creep curves from biaxial creep test of HANA 4 at 5000C at various stresses and stress ratios.
0.5
1.0
1.5
2.0
0.0
0.1
0.2
0.3
0.4
0.5
0.6
Pa
Pa
Pa
44 Finally, a creep test was performed at different stress ratios at different stresses in a random order on the same sample to verify the previous results and to get error bars in the strain rate these curves are depicted in Figure 5. 8.
5.2. Evaluation of Creep Anisotropy Parameters
Fig. 5.9 (a) shows the EBSD micrograph in axial-hoop (z-θ) plane. Clearly, the grains are not very highly elongated which is surprising because Murty et al [23] have reported a very high degree of elongation in CWSR Zircaloy-4 grains along both the radial-axial and hoop-axial plane, none of
0 1 2 3 4 5 6
0.00 0.02 0.04 0.06 0.08 0.10 0.12 0.14 Area Fra ct io n
Grain size, d (m) Grain size distribution Gaussian distribution
z
r
Figure 5.9. a. EBSD Micrograph, b. Grain size distribution in CWSR condition, c. {0002} basal pole figure and d. intensity vs angle for basal pole peak angle determination.
45 which is observed in CWSR HANA-4. The grain size distribution along axial-hoop plane shown in Fig. 5.9(b). The maximum area fraction is found to be at a grain size of around 2.5 μm. Basal pole figure is shown in Fig. 5.9(c) the basal pole peak angle which is the average angle along which basal poles are located is found to be asymmetric (the regions are shown in red) which is rare and the reason of it is not clearly understood.
To get the R-value from the basal pole figure following equation was used,
R=cot2𝜑̅ (5.1)
Where 𝜑̅=angle between the radial direction and the c-axis of the average crystal in the r-θ plane From Figure 5.9 (c) it is observed that one side of the pole has more intensity than the other. The basal peak pole angle then was computed as follows:
𝜑̅= φ1 *normalized pole1 intensity + φ2*normalized pole2 intensity
Which yielded 𝜑̅= ± 38± 30
𝑅 =1.6± 0.79
Figure 5.9 depicts ρ versus α curve which was obtained from current experiments. It can
be shown that 𝛼(𝜌=0)= 𝑃
1−𝑃 from which P can be evaluated.
For equi-biaxial loading α=1,
After R&P are known, a curve can be drawn such that it passes through the experimental data points and matches with the obtained R&P values.
𝛽 = (𝜀̇𝜃
𝜀̇𝑟)𝛼=1= ( 𝑅 𝑃)𝛼=1
46 5.3. Creep loci of HANA-4
Work dissipation energy (Ẇ) is given by:
𝑊̇ = 𝜎𝑧𝜖̇𝑧+ 𝜎𝜃𝜀̇𝜃 (5.3)
Table 5.1 summarizes the creep rates obtained during biaxial creep tests of HANA-4 along with the calculated work dissipation energy for the same.
Using equation 5.3, the plot of 𝑊̇ vs σz was plotted for various stress ratios. A creep loci was generated using 𝑊̇ = 20 𝐽
𝑚3𝑠. As seen in Figure 5. 11 curves corresponding to different loading conditions are parallel to each other.
47
0
14
28
42
56
70
84
98
0
14
28
42
56
70
84
98
=1.5Hoop Stress (MPa)
R=1.5, P=0.95
Axia
l Str
es
s
(MPa)
=2 =1 =0.5 =0W =20 J/m
3s
(a)
(b)
Figure 5.11. Plot of (a): Work dissipation rate vs Axial Stress (b): Creep Loci at constant work dissipation rate.
20
40
60
80 100
0.1
1
10
100
W
(J
/m
3s)
Axial Stress (MPa)
20
Slope= 5 - 7.3
48 Table 5.1. Summary of the creep rates obtained from biaxial creep tests of HANA-4 from stress ratio of 0-2 at various stresses
α σ z
(MPa)
σ θ (MPa)
εθ̇
(s-1)
εż
(s-1)
εθ̇ εż
Ẇ
(J/m3s)
0 0 30 0 1.58E-08 0 0.47
0 0 33 0 2.11E-08 0 0.70
0 0 35 0 3.13E-08 0 1.09
0 0 40 0 3.28E-08 0 1.31
0 0 45 0 3.40E-08 0 1.53
0 0 53 0 5.98E-08 0 3.17
0 0 60 0 1.26E-07 0 7.56
0 0 69 0 2.34E-07 0 16.15
0 0 80 0 8.54E-07 0 68.32
0.5 40 80 1.52E-08 1.77E-07 0 14.77
0.5 40 80 5.10E-08 1.31E-07 0 12.52
49 Table 5.1 (continued).
0.5 42.5 85 6.27E-08 1.69E-07 0 17.03
0.5 45 90 8.76E-08 2.50E-07 0 26.44
0.5 50 100 1.58E-07 6.35E-07 0 71.40
1 33 33 8.53E-09 2.25E-08 0.38 1.02
1 45 45 1.95E-08 2.26E-08 0.86 1.89
1 53 53 4.05E-08 4.04E-08 1.00 4.29
1 61 61 7.47E-08 6.60E-08 1.13 8.58
1 80 80 1.85E-07 1.89E-07 0.98 29.91
1 90 90 3.82E-07 2.57E-07 1.49 57.51
1.5 90 60 5.73E-07 1.70E-08 33.71 52.59
1.5 90 60 3.54E-07 4.95E-08 7.15 34.83
1.5 80 53.33 3.34E-07 6.47E-08 5.16 30.17
50
1.5 75 50 9.37E-08 2.50E-09 37.48 7.15
1.5 75 50 1.39E-07 7.00E-09 19.86 10.78
1.5 100 66.6 4.02E-07 4.60E-08 8.74 43.26
1.5 100 66.6 6.89E-07 3.98E-08 17.30 71.55
1.5 110 73.3 1.88E-06 1.22E-07 15.41 215.74
2 20 10 8.32E-09 0 0.17
2 30 15 1.29E-08 0 0.39
2 45 22.5 4.14E-08 0 1.86
2 53 26.5 7.24E-08 0 3.84
2 69 34.5 2.27E-07 0 15.66
2 90 45 6.03E-07 0 54.27
2 90 45 7.91E-07 0 71.19
2 90 45 5.89E-07 8.95E-08 6.58 57.04
51 5.4. Comparison of current experimental creep results with other alloys
Fig. 5.12 (a) depicts the tube microstructure. The grains were first subjected to FIB in an SEM. Since each grain has a different orientation relative to the other the etching rate was different for each grain. The contrast generated due to this made it possible to examine the grains under SEM.
The grains in the axial-radial plane are elongated along the axial direction. This is expected since the tube is in cold-worked condition. It was of interest to measure this degree of elongation which was measured using Image J software where each grain was assumed elliptical. The result is shown in Fig. 5.12 (b). Maximum number of grains showed the degree of elongation which is defined as the ratio of major to minor axis of the ellipse close to 1.8 which is not substantially high and for practical purposes, the grain shape is closer to equiaxed than columnar.
Figure 5.13 shows a comparison of creep loci of CWSR HANA-4 with Rx (Recrystallised)-HANA 4 and CWSR-Zircaloy-4. The creep loci of both CWSR and Rx-(Recrystallised)-HANA 4 show a very slight deviation from creep loci of isotropic material. CWSR Zircaloy-4 is highly anisotropic
0 1 2 3 4 5 6 7 8 9 10 11 12 13
0 50 100 150 200 No o f g ra in s
Ratio of major to minor axis
(b) (a)
52 compared to HANA-4. From the following observations, it can be concluded that creep loci of HANA-4 doesn't depend on initial state (CWSR or Rx) which is quite unique considering the same doesn’t apply for Zircaloy and ZIRLO®. Murty et al have shown that grain shape anisotropy is a major factor responsible for the change in creep loci in CWSR material. In Zircaloy and ZIRLO® CWSR is known to produce elongated grains along the axial direction. From the present study, it is postulated that the same is not true for HANA-4 and is thought to be the reason for its close to isotropic behavior.
5.5 Prediction of the active slip system
53 Figure 5. 14. Creep Loci of CWSR HANA-4 with model prediction assuming prismatic or basal
slip.
Table 5.2-Summary of R & P values obtained.
From Fig. 5.14 it is observed that both the basal slip and prismatic slip prediction lie close to the predicted creep loci for CWSR HANA-4. Table 5.2 summarizes R&P values obtained for
Type Slip System R P R/P
Experimental By fitting & EBSD 1.5 0.95 1.58 Creep test , 𝛼 = 1 1.25±0.25
Simulation
Prism 1.24 0.66 1.87
Basal 1.37 0.98 1.4
54 basal and prismatic slip prediction as well as the one that was obtained experimentally. The c/a ratio of Zr alloys is 1.593 which is less than the ideal value of 1.63, the possible slip systems in hcp materials are prism, basal and prismatic. It is well known for Zr that basal slip is dominant at low temperatures and high strain rates. Also, at high-temperatures basal slip is easily activated in pure Zr. Akhtar observed basal slip in pure Zr single crystals above 577 0C [13]. One study on Zircaloy-2 found that the basal slip was relatively easily activated at room temperature and low strain rates [14]. In previous studies conducted by Murty et al on CWSR Zircaloy-4 at 400-500 0C basal slip prediction using CODF was found to show a better match with the experimental results. It was thought that in CWSR material the prismatic planes are locked due to high deformation leading to activation of basal slip systems [52]. This was proven to be not true after TEM analysis. So, to explain the deviation of prismatic slip prediction from the experimental results a model was introduced by Murty et al which assumed grain boundary sliding mechanism along the hoop and radial direction (due to elongated grains along axial direction) with the combination of prismatic slip. This model showed excellent agreement with the experimental results it is interesting to note that the aspect ratio of grains in CWSR HANA-4 along the axial direction is not that high based on the figure.5.12 (b) and the creep locus is closer to that of an isotropic material, so grain boundary sliding mechanism is not expected to occur.
55 FeCrAl
5.6. Stress vs rupture time
Figure 5.15 shows the effect of stress on rupture time at temperatures of 480, 510, 540,570 and 600 0C respectively. To convert pressure in psi to hoop stress in MPa the multiplying factor of 11.98 has been used. As expected the rupture time decays exponentially with decreasing stress.
![Figure 2.1. Schematic of a typical creep curve [1].](https://thumb-us.123doks.com/thumbv2/123dok_us/1491803.1182552/19.612.71.541.240.528/figure-schematic-typical-creep-curve.webp)
![Figure 2.5. Illustration of various slip systems in hcp metals a) prism b) basal c) pyramidal [7]](https://thumb-us.123doks.com/thumbv2/123dok_us/1491803.1182552/25.612.88.509.226.522/figure-illustration-various-systems-metals-prism-basal-pyramidal.webp)
![Table 2.6. Curie Temperature of various FeCrAl grades [47].](https://thumb-us.123doks.com/thumbv2/123dok_us/1491803.1182552/41.612.189.437.73.402/table-curie-temperature-various-fecral-grades.webp)