H o w safe are nuclear pressure vessels in 2001?
Heinz W BargmannSwiss Federal Institute of Technology, Lausanne, Switzerland, and Technical University, Vienna, Austria
Dedicated to Professor C.W. Smith on the occasion o f his 70th birthday
ABSTRACT
This paper is concerned with pressure vessels in the presence of crack-like defects. The probability of fast fracture, at any time, is formulated in terms of a characteristic defect size exceeding a critical value. The probability is conditional, given the random event of the annual occurrence of particular loading conditions. Two sets of data are extracted from experimental evidence reported in the literature. One concerns the size distribution and total number of defects. The other pertains to the critical values of defect size for several loading conditions, together with the probability of the annual occurrence of these conditions. The most important effect of ultrasonic inspection on the presence of defects is taken into account. As an illustrative example, an analytic, closed-form solution for the failure probability is derived for a typical pressurized water reactor vessel under end-of-life conditions. The different contributions to failure probability of the various normal and off- normal loading conditions, in particular of pressurized thermal shock, are clearly displayed, and the importance of a judicious choice of both modern low-residual-element pressure vessel steels and an improved ultrasonic inspection technique is demonstrated.
1. I N T R O D U C T I O N
Twenty years ago, Sir Alan Cottrell wrote a comprehensive guide to nuclear technology: "How Safe is Nuclear Energy?" [1]. The book is a little gem, probably the best introduction to reactor technology ever written. As to the steps needed to ensure the safety of pressure vessels against sudden fracture, he said, "the following would all seem to be essential: 1 Apply rigorously all recommendations (e.g., as given in the Marshall Report, referred to below) for the manufacture, operation and inspection of the vessels. 2 Improve the ultrasonic technique and procedure to the level at which in routine practice it detects inch cracks with fair (e.g., 50%) probability and 1 inch cracks with very high (better than 95%) probability. 3 Develop
methods for repairing cracks remotely in thick radioactive steel without impairing the mechanical properties of the material. 4 1 inch"
Repair by these methods all cracks deeper than ~-
Five years earlier, a study group chaired by Sir Walter Marshall had come up [2] with vessel failure probabilities of less than 10 -7 per reactor-year, conforming with preliminary assertions in the Rasmussen Report a year before [3]. Their calculations were based on the views of experts in ultrasonic detection but these views were overly optimistic, at their time
[4,5].
Following the Marshall Report, a number of papers were published in international scientific journals, reporting numerical results which all confirmed the then already magic number of 10 -7 . The results were predicted by specially developed computer programs or codes (i.e., systems of "secret writing in which letters, figures, etc., are arbitrarily given certain meanings" [6]). Thus by their very nature, these results could not be verified by third parties. And this was one reason, why we looked for a simple method which would allow a straightforward solution, possibly in closed form, clearly exhibiting the different influences of the qualities of the material, the welding procedure, and the non-destructive (ultrasonic) detection technique [7]; cf. Eq. (10)2 below. Such a method has the advantage of not only making the results transparent and available for direct check and discussion, but these results may also be improved by the reader.
2. THE PROBABILISTIC PROBLEM OF FAST FRACTURE
Pressure vessels - thick-walled, massive cylinders under severe conditions of high water pressure and thermal loading in a major fault - are very complex components. In order to ensure that, in the presence of crack-like defects, fast fracture will not occur during the lifetime of the vessel, it is required, at any time t , that the characteristic size a of a defect does not exceed a critical value a c .
Let us assume that both the characteristic defect size and its critical value are independent random variables with probability densities f ( a ) and g ( a c ) , respectively. The probability of vessel failure due to an individual defect is then given
by
SMiRT 16, Washington DC, August 2001 Paper # 2069
h h
P{~l)=Ig{ac)aa. ff{a)aa
0 a c
(1)
where h denotes an upper bound for the defect size, the wall-thickness of the vessel, for example.
Let us confine our attention to a particular region of a pressure vessel, e.g:, a major welded region, and assume that there is a total number of N crack-like defects present which from their location and orientation make the region prone to failure. The probability of vessel failure in that region is then given by
P(xN ) = 1 - [ 1 - P(Z, )]N = NP(Y, )
(2)
where Eq. (2)2 holds for sufficiently small values NP(Y~ ) << 1.
For the purpose of comparison with annual events, we introduce, at any time t, the event Ag of the annual occurrence of
a particular probability density g , corresponding to a particular loading condition of the vessel. P(YN) may thus be
considered as the conditional probability of vessel failure, assuming Ag, P(-xN ) - P(-XN [Ag). For the probability of annual
vessel failure we then have, at any time t ,
P(YNAg) = P(YN
I A~)P(Ag)=
NP(Y,)P(Ag)(3)
3. T H E DATA
We have now to specify the various quantities which enter Eqs (1) and (3). There are, essentially, two sets of assumptions to make. One concerns the probability density f of the size a of relevant crack-like defects, together with their
total number N . The other concerns the probability density g of the critical value a c of the defect size, corresponding to
certain loading conditons, for a given vessel material, and the probability P(Ag) of the annual occurrence of these
conditions.
3.1. Critical defect size and loading conditions
There is, today, a rather broad consensus as to the critical defect sizes under various loading conditions. Compared to the large uncertainties as to the pre-existing defects, we have, in fact, almost deterministic knowledge of the critical defect sizes,
a c =- aco. We thus assume the delta function as th probability density of the critical defect size a c ,
g ( a c ) = 6 ( a c -aco ) (4)
where typical values a co, for the particular loading conditions on which we shall concentrate, may be taken from Table. 1. The values correspond to end-of-service-life material properties of the vessel. Cf. [ 1,4,5,8 to 11].
The probability P(Ag) of the annual occurrence of the loding conditions presented in Table 1 may be inferred from
statistical evidence. The following evidence, in particular, is worth noting:
- Ackerson et al. [10] report data represenafive of U.S. pressurized water reactor (PWR) operating experience. For the
steam line rupture they quote a frequency per reactor-year of about 4 x l0 -2 , for the large loss-of-coolant a value of about
4×10 -4"
- Phtmg and Cottrell [11] report on significant events the majority of which should be considered as precursors to pressure vessel thermal shock. Repressurization occurred in most of these events. They quote a frequency per reactor-year of about 0.1. They, further, note that only a few events such as those occurred at Rancho Seco (1978), Oconee 3 (1979), Crystal River 3 (1980), and Indian Point 2 (1980), appear to be of real concern from the viewpoint of reactor vessel integrity. We note that these four events occurred within 2.5 years.
- Marshall et al. [4], generally, refer to the frequency of 10 -4 to 10 -2 per reactor-year for the steam line break and the loss of coolant, in accordance with earlier estimates [3]. For the incident of cold overpressurization corresponding values
(2 to 5)x10 -2 are indicated.
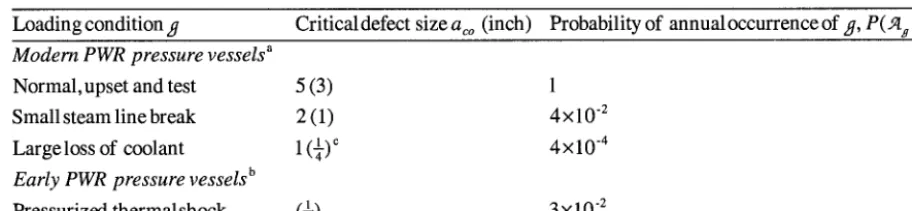
Table 1
Critical (initiation) defect size, for several loading conditions. Probability of annual occurrence of loading condition
Loading condition 2/ Critical defect size aco (inch) Probability of annualoccurrenceof 2/, P(Ag )
M o d e m P W R p r e s s u r e v e s s e l s a
Normal, upset and test
Small steam line break
Large loss of coolant
E a r l y P W R p r e s s u r e v e s s e l s b
Pressurized thermalshock
5(3) 1
2(1) 4×10 .2
1(¼) c 4x10 -4
(4) 3×10²
a Low-residual-element pressure vessel steels with high radiation embrittlement resistance b High-residual-element pressure vessel steels
c If vessel wall is no more in the 'upper shelf' range of fracture toughness
N o t e
Crack-like defects of critical size could begin to grow, (although its growth would initially be stable if the material is in the 'upper shelf' range of fracture toughness). The values may be considered as best estimates, usually corresponding to semi- elliptical surface flaws (pessimistic values in brackets, generally corresponding to extended surface defects), representative for a pressurized water reactor (PWR) vessel. For modern vessels, except for the large-loss-of-coolant transient, elastoplastic material behavior hs been taken into account. End-of-(40 years)-life properties have been assumed, wih nominal fracture
toughness Ktc = 190 M P a x / ~ (corresponding to irradiation embrittlement by a total dose of up to 3×10¹⁹ n (> 1MeV)/cm 2 at the inner surface in the beltline region at a temperature of at least the nominal water inlet temperature of 288°C); and with a flow stress of 500 N/mm 2. Moreover, allowance for stable crack growth due to (corrosion) fatigue has been made. For further details, cf. [1,4,5,7 to 9].
3.2. P r e s e n c e o f d e f e c t s
We now have to come up with an assumption for the total number and the size distribution of crack-like defects which, because of their location, configuration, and orientation, make the vessel prone to failure.
Every pressure vessel, after its fabrication, has to undergo a pre-service inspection, in current practice an ultrasonic technique, which should reveal and reject any defects approaching the critical size, making allowance for any sub-critical crack growth under operating conditions [5]. We shall, therefore, distinguish between the total number and sizedistribution of defects before and after this inspection, i.e., between an 'as-fabricated' and a 'non-detected' situation, (denoted by a subscript
F a n d N D , respectively, in Section 3.2.3).
3 . 2 . 1 . A s - f a b r i c a t e d d e f e c t s : s i z e d i s t r i b u t i o n
Let us assume that the random, as-fabricated defect size is characterized by an exponential probability density,
f ( a ) = ~ e x p [ - c t ( a - ao )] , a > a o (5)
where a is a measure for the concentration of the distribution; in fact, o~ -1 represents both the standard deviation and the difference between the expected value or mean of the crack size and the lower threshold value a o . T h e value a o may define from what size a on a flaw should be considered to be a defect. The value may depend on the particular detection procedure.
There is some experimental evidence available:
- Becher and Hansen [12] apparently presented the most complete set of data on defect sizes. They refer to a total number of 228 surface defects found during successive removal of layers of steel weldment. The largest crack in the collection had a size ('depth') of 0.45 inch. It has been noted by Harris e t al. [13] that the data can be adequately fit by an exponential distribution with parameter a = 15 inch ~ .
- Raussi and Tiainen [14] presented data obtained by X-ray inspection of welded pipes of the main steam system of a boiling water reactor. Of a total number of 219 defects, 94% had a size of less than 3 mm; 4.5% between 3 and 6 mm; and the largest defect was 10 mm high. We consider this distribution fairly well represented by an exponential type with parameters
- Marshall et al. [4] proposed a value of o~ = 4.1inch -1 , based on the evidence available to them. Apparently, a lower threshold value a o = 0 has there been assumed.
From this evidence, one might be inclined to consider the value o~ = 15 inch 1 to be a reasonable estimate. Moreover, we linch
shall only consider defects of sizes larger than a o = -~ .
3.2.2. Total n u m b e r of as-fabricated defects
It remains to make an estimate of the total number of relevant, 'as-fabricated' defects in the vessel or in a major welded region. Such estimates appear in several places. The various appraisals, as they are presented, could seem unjustified, ambiguous, at best incomplete and difficult to compare. If, however, the total number is given with reference to a size density f , with a lower threshold value a o , then the ambiguity is eliminated, the statements become unique and may, at least, be compared with each other.
There is a relationship which should be observed whenever an extrapolation is made, from experimental evidence of the size distibution within a (narrow) range, to the distibution over a wider range. The number of expected defects in the narrow range must be conserved, i.e., it should be invariant with respect to any choice of f . In particular, in the case of the exponential density, Eq. (5), when we keep the concentration a of the probability density fixed, if we change from a lower threshold value a o to a new value aoo ( < a o , say), the corresponding total numbers N O and Noo are related by
Noo = No e'4a°-a°° ). For the derivation, cf. [7].
There is now experimental information available from which to go on:
1 and 3 inch - Caplan [15] reports, for a major welded region of a vessel, that 23 defects of sizes ('depths') between ~ -~
were found, and no larger defects were observed.
- Marshall et al. [2] indicate that in 44 vessels 12 defects were found with sizes ('depths') in the range of 0.5 to 1 inch, and no defects of depths larger than 1 inch were observed.
- Nilsson [ 16] concludes, based on estimates from radiographic evidence in [ 15], as well as other sources, that 15 defects with size larger than 5 mm was a fair estimate for a vessel.
It is on the grounds of this experimental evidence that we form our rough estimate. Upon the assumption of an
linch we thus assume that the total number of relevant, 'as- exponential density, Eq. (5), with o~ = 15 inch l , a o = -~ ,
fabricated', crack-like defects of size a < a o , in a major welded region, is given by N - N O = 1 0 - 1 0 0 , on the average N _= 50, say. We note that this corresponds to an average of N---325 for the same value of a but a threshold value
1 inch instead. aoo = ~
3.2.3. P r e - s e r v i c e inspection
It is useful to introduce a probability PNo (a) of non-detection of a defect of size a , associated with the pre-service
inspection. With the frequency interpretation of probability densities, in our as-fabricated collection of N F defects, there are
about N F f F (a) da defects of size between a and a + d a . Thus, the number NND of remaining, non-detected defects and
their size density are defined by NNO fNo (a) da = N F f F (a) PND (a) d a . Upon integration of this expression over all sizes, we
obtain for the number of remaining, non-detected defects NNo
o o
NNO = I f F (a) PND (a) da (< 1) (6)
N F a o
and the probability density of the non-detected defect size follows as
f lvo (a)= f F (a)PND ( a ) ~ N F
NND
(7)
- In 1979, tests of the best s t a n d a r d ultrasonic practice on thick steel plates, within the widely reported PISC I program, have shown that there was a mere half chance of detecting even a one inch defect. Only defects deeper than about 2 inches have a high (e.g., better than 95%) probability of being detected. Cf. [17].
- A n i m p r o v e d ultrasonic technique a n d p r o c e d u r e has thus been requested which, in routine practice, detects 4inch
defects with a fair (e.g., 50%) probability and 1 inch defects with very high (better than 95%) probability. These values were considered by Sir Alan Cottrell as being essential to ensure the safety of thick-walled vessels against sudden fracture [ 1 ]. The values are virtually identical with the assumptions made in [2] which, at their time, however, were overly optimistic [1,4,5].
An analytic representation of the non-detection probability may fairly well be expressed by
t
1
PND ( a ) = exp[- lz(a--aND )] 0
if a < aND
if
aND < a < a Dif a > a o
(8)
where a NO and a D denote the threshold values of defect size for non-detection with probability 1 and for
detection with probability 1, respectively. The corresponding parameters for the two sets of data are given in Table 2.
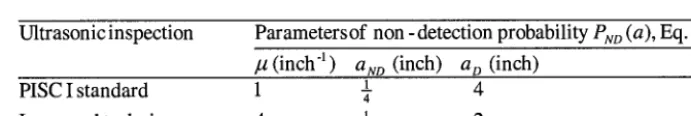
Table 2
Ultrasonic inspection: PISC I standard practice vs improved technique
Ultrasonic inspection Parameters of non -detection probability Pup (a), Eq. (8)
/z (inch "l) aND (inch) a o (inch)
1 4
PISC I standard 1 ~-
1 2
Improved technique 4 -g
4. ILLUSTRATIVE E X A M P L E
It is now a simple matter, to compute the probability of vessel failure, for several loading conditions, as presented in Table 1. Let us, first, compute the failure probability P @ ) due to an individual defect. Upon substitution of Eqs (4) and (8) into Eq. (1), we obtain
P(~'I
) = NNO f F (a) PND (a) da (9)aco
linch for the defect size and the where N u o / N F stands for the integral in Eq. (6). With the lower threshold value a o = 7
threshold value aND of the ultrasonic procedure, Table 2, for the critical defect sizes aco of Table 1, the conditions aco > ao,
aco > a NO hold. We thus obtain, from Eqs (9), (5), (8), together with (6), the following closed-form expression for the failure
probability, due to an individual defect,
-(°¢+t2)ac° -- e-(°~+lt)aD -(~+lt)(ac°-a°) (10)
p(~l) = e
e_(a+lZ)ao _e_(a+lx)a D ~_ e
Equation (10)2 holds, approximately, whenever a o >> aco > a o .
The probability of failure of the vessel with a total number of N ND defects present, after the pre-service inspection,
follows from Eq. (2),
P(XNND) = 1--[1-- p(-~)~VND = NlvDP(-~I ) (11)
The probability of annual failure of the vessel follows then upon multiplication by the probability P(Ag ) of the annual
occurrence of a particular loading condition g , Eqs (3).
For the loading conditions as given inTable 1, at the end of the service life of the vessel, we thus arrive at the final results as presented inTable 3. There, a mean value for the total number of 'as-fabricated' defects of N F = 50 corresponding to the
linch has been assumed; proper exponential density with concentration c~ = 15 inch -1 and a threshold value a o =-~
adjustments for the two other concentrations a = 4 and 25 inch -~ have been made. Cf. Section 3.2.2.
Let us first look at the structure of the expression for the vessel failure probability, due to an individual defect. Equation (10)2 clearly exhibits the different influences on the result. We see, how the vessel failure probability decreases with increasing "quality of the material" a~o (for a given loading condition); with increasing "quality of the welding process" a ,
and increasing "quality of the ultrasonic inspection"/2. We note that, for the latter two influences, only their sum ct +/2 is of significance.
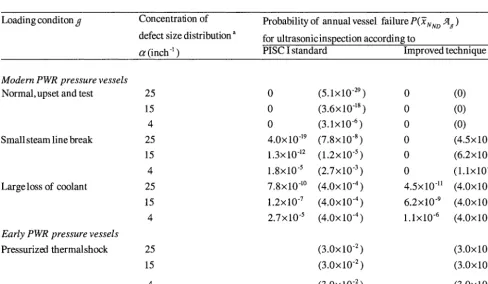
Table 3
Probability of annual failure ('failure per vessel-year') of vessel with end-of-service-life material properties, for several loading conditions (cf. Table 1); for three types of defect size distribution; for two different qualities of ultrasonic pre-
service inspection (cf. Table 2)
Loading conditon 27 Concentration of
defect size distribution a
a (inch ~ )
Probability of annual vessel failure P(-YNN o Ag )
for ultrasonic inspection according to
PISC I standard Improved technique
M o d e m P W R p r e s s u r e vessels Normal, upset and test
Small steam line break
Large loss of coolant
Early P W R p r e s s u r e vessels
Pressurized thermalshock
25 0 (5. lx 10 .29 ) 0 (0)
15 0 (3.6x10 18 ) 0 (0)
4 0 (3.1x10 -6) 0 (0)
25 4.0x10 19 (7.8x10 8) 0 (4.5x10 -9)
15 1.3x10 -12 (1.2x10 -5) 0 (6.2x10 7)
4 1.8x 10 5 (2.7 x 10 3 ) 0 (1. lx 10 4 )
25 7.8x10 ~° (4.0x10 4) 4.5x10 ~l (4.0×10 4)
15 1.2x 10 7 (4.0x 10 "4 ) 6.2x 10 "9 (4.0x 10 4 )
4 2.7 x 10 5 (4.0x 10 4 ) 1. lx 10 6 (4.0x 10 -4 )
25 (3.0x 10 -2) (3.0x10 2)
15 (3.0× 10 "2 ) (3.0× 10 -2 )
4 (3.0x 10 "2 ) (3.0x 10 "2 )
a Cf. Eq. (5). A lower threshold value a o =-¢ 1 inch has been assumed. The total number of as-fabricated defects has been
chosen to depend on the concentration a of the defect size distribution, N = N(c~), in such a way as to keep the number of
and 1 inch, invariant with respect to the change of ct. Cf. [7]. In particular, N = 50 for defects, for which a is between 7
a - 15 inch -~ has been chosen. The results presented are proportional to N , except for the case of pressurized thermal shock which is unaffected by the choice of N .
Let us now look at the results presented in Table 3. We recall that the figures presented should be conservative, since the defect size for initiation of stable crack growth has been identified as the critical size to cause failure, cf. Table 1. We note that no advantage has been taken of phenomena like crack arrest or warm prestressing.
The following, particular conclusions may then be drawn from the figures of Table 3:
(1) For modem vessels, manufactured of low-residual-element pressure vessel steel with high radiation embrittlement resistance, subjected to ultrasonic pre-service inspection procedures comparable to, at least, the PISC I standard; at the end of a 40-years-service-life, the probability of failure under normal, upset, and test loading conditions is zero.
(2) For modem vessels, manufactured as above, subjected to an improved technique of ultrasonic pre-service inspection; at the end of service life, the probability of annual failure under accident conditions like a small steam line break is zero. It may be of the order of 10 -12 per vessel-year, if an inspection comparable to PISC I standard only had been performed. Under the, unrealistically, pessimistic assumption that the defects were extended cracks, the failure probability could be, for PISC I standard and for the improved technique, of the order of 10 .5 and 10 7, respectively.
(3) For modem vessels, manufactured as above, subjected to an improved technique of ultrasonic inspection; at the end of service life, the probability of annual failure under accident conditions like a large loss of coolant is of the order of 10 .9 per vessel-year. It may be of te order of 10 5, if an inspection comparable to PISC I standard only had been performed. Under the pessimistic assumption of extended cracks, the failure probability could be of the order of 10 -4 per vessel-year, independent of the ultrasonic inspction procedure employed.
(4) For those early vessels which were manufactured of high-residual-element pressure vessel steel and weld material; exposed to the overcooling transient of pressurized thermal shock, under pessimistic assumptions, there might be a
probability of annual failure of about 3x10 -2 per vessel-year. Again, this value is independent of the particular ultrasonic inspection procedure employed; no increase in vessel safety should be expected from the improved technique and procedure. The essential point, here, is to avoid the vessel approaching the highly embrittled material condition during its service life. Cf. e.g., [8,10].
5. CONCLUSIONS
Rather general conclusions may be drawn from the solution by the simplified approach in the present account. They refer to a number of important sensitivities of the result as exhibited by Eqs (3) together with (11)2 and (10)2, as well as the figures presented in Table 3. Seven factors may strongly influence the result:
(1) The choice of vessel and weld material. The difference between the failure probabilities for modem and for certain early vessels is a drastic one. Moreover, the figures confirm the importance of the view expressed by Sir Alan Cottrell [ 19] that arrangements be made to keep all parts of the pressure vessel in the 'upper shelf' range of fracture toughness, at all times. (2) The choice of ultrasonic inspection technique (PISC I standard vs improved technique). Again, the figures demonstrate the importance of an improved technique and procedure. Cf. recommendations in [ 1,18,19].
(3) The loading conditions (normal vs accident conditions). For modem vessels, subjected to an improved ultrsonic inspection technique, there is no sensitivity of the result with respect to both normal, upset, test loding and small-steam-line- break type accident conditions, the failure probability being zero under these conditions. (This is no more true, for the exremely pessimistic assumption of extended defect configurations.) For the large-loss-of-coolant accident conditions, there is, at least a remote failure probability different from zero.
(4) The chance of occurrence of accidental transient. The probability of annual vessel failure is, in fact, proportional to the probability of annual occurrence of these transients. If, for a particular transient, the critical defect size approaches the lower threshold value of defects present, both the probability of annual vessel failure and the probability of annual occurrence of the transient become the same. Cf. e.g. the pressurized thermal shock condition in the example, Section 4.
(5) The total number of as-fabricated defects. The probability of vessel failure, for a given probability density of the defect size, is proportional to the total number, if this vessel failure probability is small compared to one; if it is not small, the influence of the total number is less pronounced.
(6) The defect configuration (i.e., semi-elliptical vs extended defects). We note, for modem vessels under accident conditions, a sensitivity of several orders of magnitude corresponding to the two types of configurations.
(7) The defect size distribution. We note, for modem vessels, a sensitivity of several orders of magnitude corresponding to the two extreme concentrations assumed for the distribution.
As far as the quality of the data is concerned which entered the analysis of the present account, we may summarize as follows. For typical reactor pressure vessels, there is today sufficient consensus on representative values for critical defect sizes, under normal, upset, and test conditions, as well as under certain accident conditions. More or less, there is consensus also on the chances for the annual occurrence of certain accidental transients.
There remains then the largest uncertainty still connected with the question of the total number and size distibution of relevant, 'as-fabricated' defects within the vessel. It is apparent that further investigations in this direction would be needed, in order to reduce the uncertainty in the present results.
REFERENCES
1. Cottrell, A., How Safe is Nuclear Energy, Heinemann, London, 1981.
2. Marshall, W. et al., An assessment of the integrity of PWR pressure vessels, United Kingdom Atomic Energy Authority, London, October 1976.
3. U.S. Nuclear Regulatory Commission, "Reactor Safety Study: An Assessment of Accident Risks in U.S. Commercial Nuclear Power Plants", WASH-1400, Washington, DC, October 1975.
4. Marshall, W. et al., "An assessment of the integrity of PWR pressure vessels", Second Report, United Kingdom Atomic Energy Authority, London, March 1982.
5. Nichols, R.W., "Flow assessment in relation to the integrity of pressurized components", Nucl. Engng. Design 69, 1982, 403-422.
6. Webster's New World Dictionary of the American Language, College Edition, The World Publishing Company, Cleveland, etc., 1959.
7. Bargmann, H.W., "Prediction of pressure vessel failure: a critical review of the probabilistic approach", Theoretical and Applied Fracture Mechanics 5, 1986, 1-16.
8. Serpan, Jr., C.Z. "US NRC materials research for evaluation of pressurized thermal shock in RPV of PWRs", Nucl. Engng. Design 72, 1982, 53-63.
9. Cheverton, R.D., S.K. Iskander, and G.D. Whitman, "Integrity of PWR pressure vessels during overcooling transients",
Nucl. Safety 24, 1983, 196-204.
10. Ackerson, D.S., K.R. Balkay, T.A. Meyer, R.P. Ofstun, S.D. Rupprecht, and D.R. Sharp, "A quantitative methodology for reactor vessel pressurized thermal shock decision making", Nucl. Engng. Design 75, 1982, 405-414.
11. Phung, D.L. and W.B. Cottrell, "Severity, causes and frequencies of pressure vessel thermal shock at U.S. pressurized water reactors (1963-1981)", Nucl. Engng. Design 75, 1982, 375-388.
12. Becher, P.E. and A. Pedersen, "Application of statistical linear elastic fracture mechanics to pressure vessel reliability analysis", Nucl. Engng. Design 27, 1974, 413-425.
13. Harris, D.O., E.Y. Lim and D.D. Dedhia, "Probability of Pipe Fracture in the Primary Coolant Loop of a PWR Plant, Vol. 5: Probabilistic Fracture Mechanics Analysis", U.S. Nucl. Reg. Comm., NUREG/CR-2189, Washington, DC, 1981. 14. Raussi, J. and O.J.A. Tiainen, 'q'he effect of inspection and repair on the size distributions of the weld imperfections in
nuclear power plant pipes", Nucl. Engng. Design 60, 1980, 395-399.
15. Caplan, L.S., 'q'he ultrasonic shop map and its use in preservice inspection", C77/74, in: Instn. Mech. Engrs. Conference on Periodic Inspection of Pressurized Components, 1974, 19-28.
16. NiIsson, F., "A Model for Fracture Mechanical Estimation of the Failure Probability of Reactor Pressure Vessels", Proc. 3rd Int. Conf. Pressure Vessel Tech., Tokyo, 1977.
17. Plate Inspection Steering Committee, "Evaluation of the PISC Trials Results", EUR 6371EN, Vols. I-V, Commission of the European Communities, Luxembourg, 1979.
18. Marshall, W., Letter to Sir Alan Cottrell, 11 February 1982, e.g., in: Atom 308, 1982, 125-126. 19. Cottrell, A., Letter to Dr W. Marshall, 15 February 1982, e.g., in: Atom 308, 1982, 126.
20. Waites, C. and J. Whittle, "The current status of performance demonstration and evaluation developments", ECNDT'98, 7th European Conference on Non-destructive Testing, Copenhagen, May 1998.
Acknowledgement. The research reported in this paper was sponsored in part by the Swiss Federal Office for Education and