An Approach to Customer Classification using
k-means
Jayant Tikmani, Sudhanshu Tiwari, Sujata Khedkar
Student, Computer Engineering, V.E.S. Institute of Technology, Chembur, Mumbai, India Student, Computer Engineering, V.E.S. Institute of Technology, Chembur, Mumbai, India Professor, Computer Engineering, V.E.S. Institute of Technology, Chembur, Mumbai, India
ABSTRACT: A customer segment is a group of customers who share similar attributes or who have similar needs. Knowledge about customer segments allows businesses to target their products for customers of specific groups or segments. k-means clustering is a method to divide raw data into different clusters where members of one cluster have more similar attributes among themselves than the members of other clusters. This paper describes customer segmentation in detail and explains clustering algorithms. More specifically, the paper describes k-means clustering technique and explains its use in customer segmentation by explaining segmentation of television company customers on the basis of various variables.
KEYWORDS: Customer segmentation; cluster analysis; k-means clustering
I. INTRODUCTION
Classification is a process which is used to categorize a group of objects into specific groups. Customer classification involves categorizing various customers which are involved with the company. A simple classification may be into frequent buyers and rare buyers and giving special offers/ features to frequent buyers in order to gain more revenue. Customer classification is dealt in more detail in a later section.
Predictive models utilize available statistics for prediction of data. They are generally made up of multiple factors that are likely to affect future behaviour or results. In marketing specifically, a customer‟s age, gender and purchase history are very likely factors to affect the odds of a future object being bought by the customer. The basic steps involved in a predictive model may include:
1. Collection of data using various predictors, ranging from simple regression to complex neural network systems. 2. Predicting possible output based on current conditions and observed statistics for it.
3. Ranking the odds of occurrence of possible outcomes based on likelihood (confidence value). 4. Present 1 or more outcomes depending on relative occurrence chance.
Typically, relationships between the variables does not hold true completely in practice. Thus, each prediction has a confidence value associated with it, based on the frequency of occurrence of the event. A simple way to categorize variables would be into 3 sections:
1. The variables which are very likely to affect the response. These variables must be included in the current prediction calculations.
2. The variables those are unlikely to affect the response to a large extent. Inclusion of these variables will likely not affect the prediction much unless the decision between two outcomes in extremely close.
3. The variables which may or may not affect the response. These variables should be considered in prediction as they may affect the prediction severely under some circumstances.
K means is a specific algorithm of predictive modelling. It can also be considered as a subdivision of clustering algorithms which themselves are a type of predictive algorithm.
II. RELATED WORK
show that clustering with k-means algorithm results into effective customer segmentation. In “Understanding of customer profiling and segmentation using k-means clustering method for raipur sahkari dugdh sangh milk products” [4], the authors describe the use of k-means algorithm to segment customers of a milk products company. Additionally, the paper describes about customer profiling and finding relations between these profiles and customer segments. The paper “Customer Segmentation Based on Survival Character” [2] proposes a customer segmentation method that constitutes of two phases. First, the authors use K-means clustering to cluster customers into different groups which have a similar survival function. Second, they use survival analysis to predict survival function for each cluster. The authors applied this method to a dataset of Telecommunications Company of China and found useful measures for management. In “Customer segmentation of bank based on data warehouse and data mining” [3], the authors apply K-means algorithm along with self organizing mapping neural network to bank customers and segment these customers. The authors analyse the data that they selected from a bank. The outcome of their proposed system shows that data mining can be used to describe behaviour of customers and hence provide information that is useful to the bank managers for making decisions.
III.CUSTOMER SEGMENTATION
As stated earlier, customer segmentation (also known as market segmentation) refers to the process of dividing customers into different groups where individuals in the same group are similar in some specific ways relevant to marketing. The customers can be divided using different characters or attributes such as spending habits, interests, age, etc.
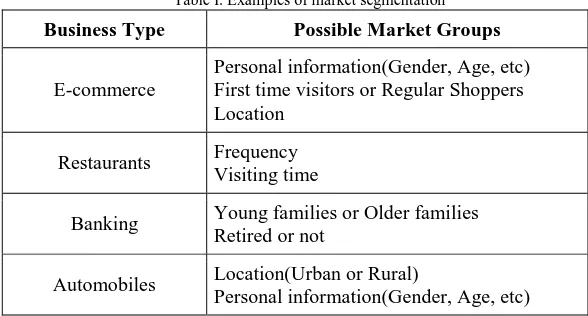
A seller or a marketer often wants to know the group or the segment to which some specific customer belongs. This allows the marketer to treat customers with different characters differently. Table I shows some examples of how to segment a market:
Table I. Examples of market segmentation
Business Type Possible Market Groups
E-commerce
Personal information(Gender, Age, etc) First time visitors or Regular Shoppers Location
Restaurants Frequency Visiting time
Banking Young families or Older families Retired or not
Automobiles Location(Urban or Rural)
Personal information(Gender, Age, etc)
There are four basic types of market segmentations:
1. Geographic Segmentation: As the name suggests, the segmentation is done on the basis of geographic units such as cities, regions or neighbourhoods. Factors such as regional climate or population density are also taken into consideration when performing geographic segmentation.
2. Demographic Segmentation: The market is segmented using indicators such as age, gender, income, etc. 3. Psychographic Segmentation: The market is segmented based upon values, interests, lifestyle of buyers, etc. 4. Behavioural Segmentation: The segmentation is done based upon the shopping or buying behaviour of
customers. For instance, some customers may prefer online shopping whereas some might prefer traditional method of shopping.
IV.CLUSTERING ALGORITHMS
Clustering algorithms are required to find structures or patterns in data. The objects with similar characteristics will fall under same cluster. Therefore, a cluster may be defined as a collection of objects which are similar between them and are different from the objects in other clusters.
With respect to customer segmentation, a cluster can be defined as a group of relatively homogeneous customers. Cluster analysis will examine the raw data available on the customers and group the customers into appropriate clusters. The cluster analysis may include the following steps:
1. select the variables that are to be used as the basis for clustering
2. calculate distance between customers along the variables that are selected in the first step 3. apply the clustering procedure
4. decide the number of clusters 5. map the clusters and interpret them 6. draw conclusions
V. DISTANCE MEASURE
An important input into any cluster analysis process is the measure of distance between objects that are being grouped or clustered. “Euclidian distance” may be used in order to determine the distance between two individuals. Consider two individuals, Ram and Shyam, are being clustered based on n variables, then the Euclidian distance between Ram and Shyam may be given as:
𝐸𝑢𝑐𝑙𝑖𝑑𝑖𝑎𝑛 𝑑𝑖𝑠𝑡𝑎𝑛𝑐𝑒 = √[ 𝑥𝑅𝑎𝑚 ,1− 𝑥𝑆ℎ𝑦𝑎𝑚 ,1 2
+ ⋯ + (𝑥𝑅𝑎𝑚 ,𝑛− 𝑥𝑆ℎ𝑦𝑎𝑚 ,𝑛)2 ] eq. (1)
where 𝑥𝑅𝑎𝑚 ,𝑖 represents value of Ram along the variable ‘i’ and 𝑥𝑆ℎ𝑦𝑎𝑚 ,𝑖 represents value of Shyam along the variable
‘i’.
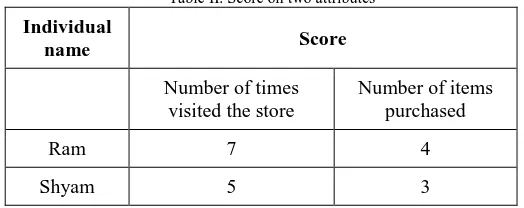
Consider the individuals Ram and Shyam are being clustered based on the number of times each of them visited some store and the number of items they bought from that store. The important score on these attributes for Ram and Shyam is provided in Table II. The Euclidian distance between Ram and Shyam can be calculated using the Euclidian distance formula.
Table II. Score on two attributes
Individual
name Score
Number of times visited the store
Number of items purchased
Ram 7 4
Shyam 5 3
The Euclidian distance between Ram and Shyam is given as:
𝐸𝑢𝑐𝑙𝑖𝑑𝑖𝑎𝑛 𝐷𝑖𝑠𝑡𝑎𝑛𝑐𝑒 = 7 − 5 2+ 4 − 3 2= 2.24
The first term in the above Euclidian distance measure is the squared difference between Ram and Shyam on the score for number of times they visited the store and the second term is the squared difference between Ram and Shyam on the score of number of items they purchased from the store.
VI.K-MEANS ALGORITHM
sum cannot be minimized further. As a result, a set of clusters that are compact and well-separated from each other is achieved. The details of the minimization can be controlled using various optional input parameters to k-means. For example, the initial values of the cluster centroids as well as the maximum number of iterations can be managed as per the requirements.
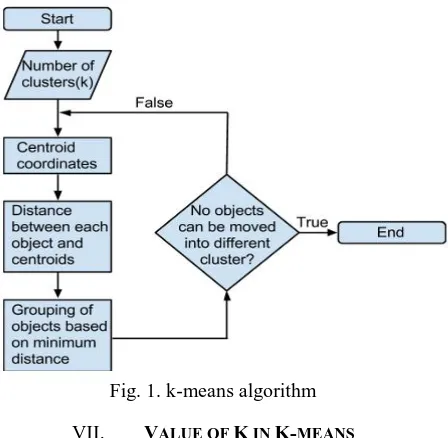
The Algorithm:
1. Start by picking the number of clusters i.e. „k‟
2. Assume the centroid of these clusters(any random objects can be taken as the initial centroids or the first k objects in the given sequence can be treated as the initial centroids)
3. Repeat the following until stable(i.e. there exists no object in any cluster that can be moved to another cluster): a. Determine the coordinates for each centroid.
b. Find out the distance between each object and the centroids. c. Group objects based on their minimum distance to the centroids. The visual representation of the k-means algorithm can be seen in Fig. 1.
Fig. 1. k-means algorithm
VII. VALUE OF K IN K-MEANS
The correct choice of k is often data dependent i.e. relative to the size and scale of the data being analysed. Thus it becomes crucial to select proper initial cluster centres. The most general considered approach is that the ideal cluster selection will balance data compression (which would occur if k = 1) and maximizing accuracy by assigning each item to its own cluster point (i.e. when k = total number of data items). The value of k should be determined from the properties of the data set if possible. However, if any such relation is not known prior value of k must be determined on some basis to obtain the classified data. Some viable methods to determine k and general details on them are given below.
1. Rule of thumb method: Simply set value of k as the square root of n/2 where n is the total number of objects
i.e. 𝑘 = √(𝑛/2).
Method may or may not work, however the particular value is considered as a decent working approximate value for k.
2. Information Criterion Approach: Value of k is determined based on a likelihood model such as the Gaussian
mixture model, Bayesian Information Criterion, Alkaline Information Criterion etc. The models are utilized to generate a likelihood function for the given data set.
3. Information Theoretic approach: The intention here is to minimize error based on information theoretic standards.
values of n . One method to use for the distortion curve can be to calculate the Mahalanobis distance of elements in the data set. This particular method has been empirically proved to work for a large variety of data sets.
4. Choosing k on basis of silhouette: The silhouette of a data item is dependent on how closely an object matches
nearby objects in the cluster as well as how different it is from the neighbouring cluster. A value near 1 implies that the item is to a good degree in the cluster it is supposed to be whereas the opposite is true for values near -1. The data is then rescaled based on the silhouette values.
5. Elbow method: The variance of the data set can be used for this particular naive approach for determining value of
k. The variance of a data set is calculated as:
Let n be the total number of objects in the particular data set. The similarities between cluster set can be calculated based on the distances between the objects as mentioned earlier. We can use the Euclidean distance measure as a naive approach for this particular task. For our particular cluster we can calculate value of a function of distance
𝐹𝑘 for inter cluster distance as below:
𝐹
𝑘= (||𝑥
1− 𝑥
2||
2)
𝑥2𝑥1
eq. (2)
Where 𝑥1 belongs to cluster1 and 𝑥2 belongs to cluster 2
This data can be normalized to obtain a degree of compactness of the clustering as:
𝑉𝑘 = 𝐹𝑘 𝑁
𝑘=1
/2𝑛𝑘 eq. (3)
VIII. CUSTOMER SEGMENTATION USING K-MEANS
The main objective of customer segmentation is to accurately predict the needs of customers and hence to improve profitability by making products in right quantity and for the right customers at optimal cost. To meet the requirements of customer segmentation, k-means clustering technique may be used so as to reach at a suitable forecasting. K-means is appropriate for large data sets that are quite common in marketing, and is less sensitive to customers that are extremely different from the other customers (i.e. outliers). The first step towards customer segmentation using k-means clustering technique is to prepare the data. A table that contains information about various customer attributes may be created. For instance, the table may contain information about the products purchased by various customers, the number of times each customer visited the business store or the business website. The table will contain several rows where each row will have data about a single customer and customers may be identified by using unique customer ID. In creating clusters, for example, a television company may take into consideration various factors that may affect their customers and in turn their sales. Table III shows some of the factors that may be useful in assigning the television company‟s customers into different groups. The television company may conduct a survey in order to discover the degree to which their customers agree or disagree to various factors. The survey may include asking the customers to rate various variables on a scale of 1 to 5 where 1 would represent strongly disagree, 2 would represent disagree, 3 would mean No opinion, 4 would mean agree and 5 would represent strongly agree.
Table III. Factors affecting television company‟s customers Customers who believe that television is a necessity and not merely a luxury
Customers who enjoy watching movies
Customers who think wisely before buying televisions
Customers who prefer paying by credit card rather than cash
Customers who are willing to spend a large amount of money on high quality televisions
Euclidian distance may be used in order to measure the clustering analysis. The survey may be conducted for a long period and must involve a lot of customers for accurate results. The clustering may be carried out using k-means clustering as explained in section VI. The value of k(number of clusters) may be decided using any of the methods that are described in section VII. The value of „k‟ may vary depending on the problem, segmentation nature, variables, the number of people that took part in the survey, etc. For better understanding of customer segmentation using k-means, section IX (simulation results) provides a sample survey of television customers and explains segmentation of these customers using the survey.
IX.SIMULATION RESULTS
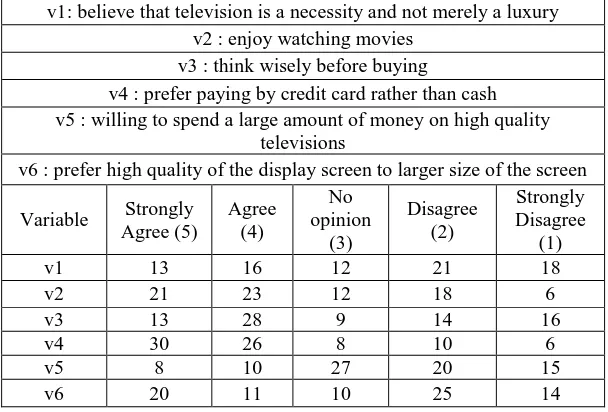
The simulation studies involve a sample survey involving 80 customers conducted by the television company for a period of 15 days. The results acquired are represented in Table IV. The information in the table could be explained as 13 customers strongly agreed that television is a necessity and not just a luxury whereas 16 customers only agreed that television is a necessity. Similarly 18 customers strongly disagreed to the fact that televisions are a necessity and so on.
Table IV. Results acquired for the survey considered
v1: believe that television is a necessity and not merely a luxury v2 : enjoy watching movies
v3 : think wisely before buying
v4 : prefer paying by credit card rather than cash v5 : willing to spend a large amount of money on high quality
televisions
v6 : prefer high quality of the display screen to larger size of the screen
Variable Strongly Agree (5)
Agree (4)
No opinion
(3)
Disagree (2)
Strongly Disagree
(1) v1 13 16 12 21 18 v2 21 23 12 18 6 v3 13 28 9 14 16 v4 30 26 8 10 6 v5 8 10 27 20 15 v6 20 11 10 25 14
The graphical representation of Table IV is shown in Fig. 2. It shows the visual representation of the response of 80 customers to the questions of survey. The x-axis of the graph represents the variable number whereas the y-axis represents the number of customers. The graph can be explained as 13 customers strongly agreed to variable 1 whereas 16 customers agreed to variable 1. Similarly 18 of them strongly disagreed to variable 1 and so on for all the six variables.
The k-means clustering is done on the basis of sample survey results shown in Table IV. The number of clusters selected was four. In order to perform k-means clustering, we have used the IBM SPSS tool and found the final cluster centres of the four clusters for all six variables mentioned in Table III and Table IV.
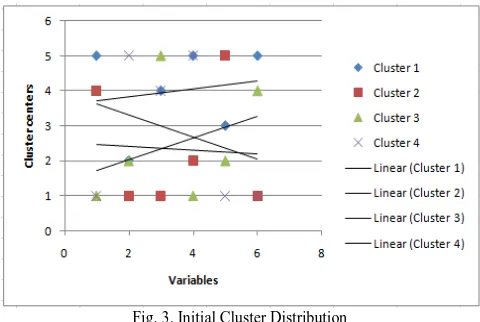
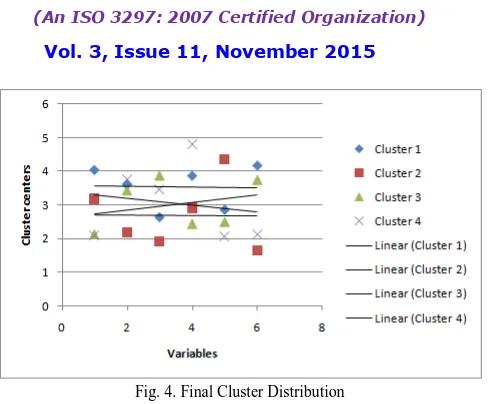
Table V shows initial cluster centres and final cluster centres. As the number of clusters selected is 4, the table shows initial cluster centres and final cluster centres of all the 4 clusters for all the six variables. The table can be explained as initial cluster centre of cluster 1 for variable 1 is 5 whereas the final cluster centre for the same is 4.04. Similarly initial cluster centre of cluster 3 for variable 4 is 1 whereas the final cluster centre is 2.44 and so on for all clusters for each variable.
Table V. Initial and Final Cluster Centres
Variable
Initial Cluster Centre Final Cluster Centre
1 2 3 4 1 2 3 4
v1 5 4 1 1 4.04 3.18 2.13 2.10
v2 2 1 2 5 3.61 2.18 3.44 3.77
v3 4 1 5 4 2.65 1.91 3.88 3.47
v4 5 2 1 5 3.87 2.91 2.44 4.80
v5 3 5 2 1 2.87 4.36 2.50 2.07
v6 5 1 4 1 4.17 1.64 3.75 2.13
The graphical representation for the initial cluster centres is shown in Fig. 3. The graph‟s x-axis represents the variable and y-axis represents the initial cluster centres. The graph can be explained as initial centre of cluster 1 for variable 1 is 5 whereas initial cluster centre of cluster 2 for variable 1 is 4. Similarly initial centre of cluster 4 for variable 1 is 1 and so on for all clusters for each variable. As it can be seen, the graph has wide variations. This is because the initial cluster centres are randomly chosen by the SPSS tool.
Fig. 3. Initial Cluster Distribution
Fig. 4. Final Cluster Distribution
X. CONCLUSION AND FUTURE WORK
The paper briefly explains customer segmentation and how k-means clustering could be used in order to divide the customers into different groups. The simulation results show the distribution of eighty customers of a television company into four clusters. However, the paper considers a dataset of 80 customers which might not be the case in real life scenarios as the number of customers might be huge and k-means might not provide the intended results when the dataset is large. As explained in “Adapting k-means for clustering in big data”[5], k-means algorithm would not prove to be as effective while handling big data as it is while handling small datasets. This is due to the reason that large size of datasets affects the clustering quality as well as the clustering time efficiency. Also, in practical situations the dataset would contain attributes that could be numerical as well as categorical and k-means would perform effectively only if the data is purely numerical or purely categorical. It would not perform well when the dataset is a combination of numerical and categorical attributes. Hence, our future work will mainly focus on overcoming these drawbacks by working on an approach that would modify the standard k-means clustering and in turn allow the segmentation of large number of customers with minimal error and a better time efficiency. The future work will also focus on considering priorities of different variables when performing k-means clustering and hence cluster the customers depending on their score for each variable and the priority of each variable.
REFERENCES
1. Cai Qiuru , Luo Ye, Xi Haixu, Liu Yijun and Zhu Guangping, “Telecom customer segmentation based on cluster analysis”, pp. 1179-1182 Year: 2012, IEEE
2. Guozheng Zhang, “Customer Segmentation Based on Survival Character”, pp. 3391 - 3396 Year: 2007, IEEE
3. Shuxia Ren, Qiming Sun, Yuguang Shi and Shuxia Ren, “Customer segmentation of bank based on data warehouse and data mining”, pp. 349-353 Year: 2010, IEEE
4. Rajeshri Lanjewar and Om Prakash Yadav, “Understanding of customer profiling and segmentation using k-means clustering method for raipur sahkari dugdh sangh milk products”, pp. 103-107 Year: 2012, IJRCCT
5. Mugdha Jain and Chakradhar Verma, “Adapting k-means for clustering in big data”, pp. 19-24 Year: 2014, IJCA
BIOGRAPHY