Supervisor Quesnel Yoann
The University of Western Ontario Co-Supervisor Osinski Gordon R.
The University of Western Ontario Graduate Program in Geophysics
A thesis submitted in partial fulfillment of the requirements for the degree in Doctor of Philosophy
© William Zylberman 2017
Follow this and additional works at: https://ir.lib.uwo.ca/etd
Part of the Geophysics and Seismology Commons
Recommended Citation Recommended Citation
Zylberman, William, "Geophysical Study of Complex Meteorite Impact Structures" (2017). Electronic Thesis and Dissertation Repository. 5165.
https://ir.lib.uwo.ca/etd/5165
This Dissertation/Thesis is brought to you for free and open access by Scholarship@Western. It has been accepted for inclusion in Electronic Thesis and Dissertation Repository by an authorized administrator of
UNIVERSITE D’AIX-MARSEILLE
Ecole Doctorale 251 – « Sciences de l’Environnement »
Centre Européen de Recherche et d’enseignement des Géosciences de
l’Environnement (CEREGE)/UM34
En cotutelle avec/
In co-tutelle with
WESTERN UNIVERSITY
« Geophysics (Planetary Science) »
Center for Planetary Science and Exploration (CPSX)/Department of Earth
Sciences
Thèse présentée pour obtenir le grade universitaire de
Docteur en Géosciences de l’Environnement
Thesis presented for obtention of the University Title of
Ph.D. in Geophysics (Planetary Science)
William ZYLBERMAN
Etude Géophysique de Structures d’Impact
Météoritique
Geophysical Study of Meteorite Impact Structures
Soutenue publiquement le 27/11/2017 devant le jury / Defended publicly the 27th
November 2017 in front of the jury:
M. Lauri PESONEN University of Helsinki Rapporteur
M. Stuart GILDER Ludwig Maximilians Universität Rapporteur
Mme Sheri MOLNAR Western University Examinateur
M. Pierre ROCHETTE CEREGE – Aix-Marseille Université Examinateur
M. Jérôme GATTACCECA CEREGE – CNRS Examinateur
M. Yoann QUESNEL CEREGE – Aix-Marseille Université Directeur
geological studies. Such approaches - combined with modeling - can reveal how impact
cratering, target geological composition, erosion and other post-impact processes can lead
to the observed geophysical anomalies, which could also be detected by remote
geophysical data on other planetary surfaces. In this work, a multidisciplinary approach is
conducted by coupling geological data to field and laboratory geophysics. Magnetic field
mapping, gravimetry measurements, electromagnetic soundings (EM34), paleomagnetic
analyses, rock magnetism and petrography techniques are used. Four impact structures in
Canada are studied: Haughton, Tunnunik, West and East Clearwater Lake. For the first
time, we reveal that the recently-discovered Tunnunik impact structure has typical negative
gravity and positive magnetic field anomalies, which help us to reconsider the brecciation
extent in the target rocks. The 20 km diameter Haughton crater, which is less eroded than
Tunnunik, shows evidence for an enhanced-magnetization in the core of the central uplift,
caused by impact-generated hydrothermal alteration. Some samples of the Clearwater Lake
impact structures in Québec are also studied with paleomagnetism, which helps to constrain
the different ages of the East and West Clearwater Lake impacts. This work has important
implications for our understanding of impact-cratering in the Solar System, especially
concerning the study of planetary surfaces. The important roles of post-impact processes
such as alteration and erosion on geophysical anomalies, petrophysical properties and
morphometry of complex impact structures are also discussed in detail, suggesting that
Keywords
telles approches - combinées à de la modélisation - peuvent révéler comment le processus
de cratérisation, la composition des roches cibles, l'érosion et d'autres processus
post-impact peuvent conduire aux anomalies géophysiques observées, qui peuvent également
être détectées par des données satellitaires sur d’autres planètes. Dans ce travail, une
approche multidisciplinaire est menée en couplant les données géologiques à la
géophysique de terrain et de laboratoire. La cartographie du champ magnétique, les
mesures gravimétriques, les sondages électromagnétiques (EM34), les analyses
paléomagnétiques, le magnétisme des roches et les techniques pétrographiques sont
utilisées. Quatre structures d'impact au Canada sont étudiées : Haughton, Tunnunik et les
lacs à l’Eau Claire Ouest et Est. Pour la première fois, nous révélons que la structure de
Tunnunik récemment découverte présente des anomalies de gravité négative et de champ
magnétique positif typiques, ce qui nous aide à reconsidérer l'étendue de la fracturation
dans les roches cibles. La structure d’Haughton de 20 km de diamètre, moins érodée que
Tunnunik, montre des signes d'une aimantation augmentée au centre de son soulèvement
central, ce qui est causé par l’altération hydrothermale induite par l’impact. Des
échantillons provenant des structures d'impact des Lacs à l’Eau Claire au Québec sont
également étudiés avec le paléomagnétisme, contribuant à contraindre les âges différents
des deux impacts. Ce travail a des implications importantes pour notre compréhension du
processus de cratérisation dans le Système solaire, notamment en ce qui concerne l'étude
des surfaces planétaires. Les rôles importants des processus post-impact tels que l'altération
et l'érosion sur les anomalies géophysiques, les propriétés pétrophysiques et la
morphométrie des structures d'impact complexes sont également discutés en détail,
Mots-clés
Géophysique, Structures d’Impact, Cratérisation, Paléomagnétisme, Processus
Post-Impact
annulaire faillée et un bord structurellement compliqué, ils ont des ratios
profondeur/diamètre typiques de 1:10 à 1:20, ce qui signifie qu'ils sont aussi plus profonds
que les cratères simples2. Les seules véritables preuves scientifiques confirmant la présence
d'un cratère d'impact sont les critères de métamorphisme de choc, telles que l’observation
de cônes de percussion ou de structures de déformations planaires dans les minéraux
choqués. Même si toutes les roches affectées par un impact sont appelées « impactites »
(incluant les roches pré-impact), le processus de cratérisation résulte en la production
d’impactites néoformées telles que les brèches d’impact, les roches d’impact fondues, le
verre et les tectites. Les processus post-impact tels que l’érosion affectant les cratères
terrestres sont importants car ils peuvent en modifier les caractéristiques géologiques,
morphologiques et géophysiques. Par exemple, le diamètre D d’un cratère complexe est
souvent inférieur au diamètre apparent Da d’un cratère érodé (alors appelé « structure
d’impact »).
Cette thèse présente de nouvelles données géophysiques acquises sur le terrain dans des
structures d’impact de type complexe. Quelles sont les anomalies géophysiques
typiquement associées aux cratères d'impact de type complexe, et que peuvent nous
apprendre ces données sur leurs structures profondes et les processus associés à l’impact ?
Typiquement, la signature gravimétrique des cratères complexes correspond à une
anomalie de Bouguer négative. Ces anomalies augmentent généralement en taille et en
1
French 1998, in Osinski 2013
2
amplitude pour un diamètre de cratère croissant3. Elles reflètent les densités réduites des
roches en raison de la fracturation induite par l’impact ou la présence de nouvelles roches
de densités plus faibles par rapport aux roches cibles originales4. Des anomalies de
Bouguer positives liées à un épaississement crustal peuvent être observées aux centres des
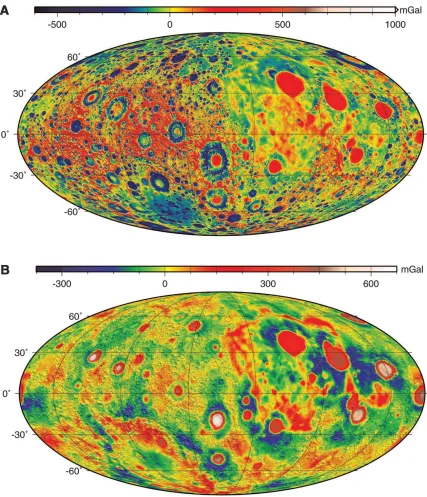
grands bassins d'impact (D > 30 km) tels que sur la Lune. Les structures d'impact de D <
40 km peuvent être caractérisées par des anomalies de champ magnétique négatives (e.g.,
les Lacs à l’Eau Claire, voir Chap. 4), mais les structures de D > 10 km peuvent aussi être caractérisées par des anomalies positives ou négatives de courte longueur d'onde (λ). Les
structures de D > 40 km sont généralement caractérisées par des anomalies positives ou
négatives à forte λ5. D’autres méthodes géophysiques telles que l’électromagnétisme, la
résistivité électrique, la sismique réfraction et réflexion, le géoradar ou encore la
magnétotellurique peuvent permettre de caractériser plus en détail la signature géophysique
des structures d’impact. L'étude de l'aimantation rémanente naturelle (ARN) des roches
crustales reflète le paléomagnétisme, technique qui permet de mieux comprendre les
processus d’impacts et de les dater. La structure d'impact de Lappajärvi en Finlande a été
datée par différentes méthodes, y compris le paléomagnétisme. La différence entre l'âge
paléomagnétique et l'âge absolu est par exemple interprétée comme un basculement
post-impact de la couche de roche fondue6. Une approche similaire est utilisée ici pour
contraindre les âges des structures d’impact des Lacs à l’Eau Claire au Québec (Chap. 4). D’autres applications possibles concernent par exemple l’étude de l'énergie de l’impact sur
la géodynamo7. Mais ici nous nous intéressons à la signature géophysique des structures
d’impact. Un bon exemple très bien décrit dans la littérature ancienne et récente est le cas d’Haughton. Il s’agit en effet d’une structure de 23 km de diamètre caractérisée par une
anomalie magnétique positive couplée à une anomalie gravimétrique négative (Chap. 3),
3 Pilkington et Grieve 1992
4 Morgan et Rebolledo-Vieyra 2013 5
Morgan et Rebolledo-Vieyra 2013
6
Pesonen et al. 1992
7
l’érosion a pu modifier cette signature.
2. Effet de l’érosion sur la signature géophysique des structures d’impact de
taille moyenne : le cas de Tunnunik
Cette partie est un article en cours de finalisation qui va être soumis à la revue Meteoritics
& Planetary Science.
2.1 Contexte et méthodes utilisées
La structure d’impact de Tunnunik est située dans l’archipel arctique de l’Ouest canadien
(75 ° 28'N, 113 ° 58'W). Sur la base de l'observation de strates inclinées et de la répartition
des cônes d’impact, Dewing et al.8 décrivirent une structure d’impact circulaire d'environ
25 km de largeur. La séquence cible est composée de roches sédimentaires
cambro-siluriennes (principalement des carbonates) de la Plate-forme Arctique. Les formations
identifiées dans le diamètre de la structure comprennent, des plus anciennes aux plus
jeunes, les formations de Wynniatt (« Shaler Supergroup »), Mount Phayre, Victoria Island
et Allen Bay8. Des intrusions sous forme de dykes de dolérite sont aussi présentes dans la
formation de Wynniatt. Aucune étude géophysique n’avait été menée à Tunnunik jusqu’à
présent.
À l’été 2015, deux semaines de géophysique de terrain ont été réalisées à Tunnunik, en se
concentrant sur les méthodes classiques de magnétisme et gravité. Les variations de
l'intensité du vecteur du champ géomagnétique (champ total) ont été cartographiées à l'aide
d’une sonde mobile à vapeur de césium MagMapper G-858 de Geometrics. Les variations
8
de champ interne et externe ont été supprimées à l'aide d'un magnétomètre fixe G-856 à
précession de protons de Geometrics. La gravité a été mesurée via un gravimètre CG-5
(Scintrex). Ces données gravimétriques ont été traitées à l’aide de données dGPS et une
série de corrections standards ont dû être appliquées pour éliminer la marée, la dérive, la
latitude, l’altitude, les effets topographiques et enfin obtenir l’anomalie complète de
Bouguer. Des sondages électromagnétiques ont aussi été réalisés à l'aide d'un appareil
EM34-3 de Geonics Ltd. Des valeurs de densités relatives ont été utilisées pour contraindre
un modèle numérique direct donnant une solution possible permettant d’expliquer les
anomalies mesurées sur le terrain.
2.2 Résultats
La carte de l’anomalie de gravité de Bouguer révèle une anomalie asymétrique négative de
3 mGal d’amplitude et ~13 km de longueur d’onde au centre de la structure d'impact de
Tunnunik. La carte interpolée de l'anomalie magnétique du champ total au centre de la
structure montre une anomalie positive d’amplitude totale de ~100 nT. Les mesures
électromagnétiques montrent une anomalie de conductivité apparente (jusqu'à > 28 mS m
-1) qui s'étend sur environ 1 km et est associée à un haut topographique local. Ces trois
anomalies détectées via différentes méthodes ne semblent pas forcément corrélées.
2.3 Discussion
Ces mesures exceptionnelles à Tunnunik confirment la présence d'une anomalie
géologique et géophysique centrée sur le cratère. En utilisant la modélisation directe, la
géométrie des sources correspondant à ces anomalies a pu être estimée. Elle confirme
l’érosion importante de la structure d’impact, avec une zone fracturée limitée à 1 km de
profondeur dans son état actuel. Couplée à un taux d’érosion estimé pour la structure
voisine d’Haughton et à l’âge possible de l’impact, cela suggère qu’environ 1-3 km de roches ont été érodées depuis l’impact. Le diamètre original de la structure devait avoir une extension minimale de 13 km. L’anomalie positive du champ magnétique est liée à un
soulèvement central du socle hautement magnétique, dont la géométrie est probablement
asymétrique. Ce soulèvement est également révélé par la gravimétrie. L’hétérogénéité des
Cette partie est un article publié dans la revue Meteoritics & Planetary Science.
3.1 Contexte et méthodes utilisées
La structure d’Haughton, située sur l’île Devon dans l'Arctique canadien (75 ° 22'N, 89 °
41'W), a un diamètre apparent d’environ 23 km9. La séquence cible est composée de roches
du Paléozoïque inférieur (sédiments cambrien, ordovicien et silurien d'environ 2 km
d'épaisseur) recouvrant les roches métamorphiques précambriennes du Bouclier canadien.
Des dykes massifs de dolérite sont intrusifs dans toutes les roches pré-paléozoïques.
L’impact a aussi produit une importante couche de roches fondues. En réagissant avec les
eaux de surface, cette couche de roche en fusion a créé un système hydrothermal qui a
refroidi pendant plusieurs dizaines de milliers d'années, générant une altération
hydrothermale des impactites (visible à plusieurs endroits du cratère, sauf au centre
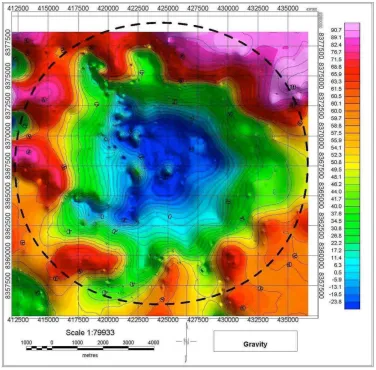
géographique). Haughton possède une anomalie de gravité négative de 24 km de diamètre
avec un minimum local au centre du cratère d’environ -12 mGal10. Cette anomalie de
gravité est associée à une anomalie positive du champ magnétique de 1.2 km de largeur
avec une amplitude maximale de 900 nT. Le maximum de l'anomalie au sol correspond à
un gradient local de 20 nT m-1, indiquant que certaines parties de la source aimantée
principale peuvent avoir atteint la sub-surface. Une modélisation numérique de la source
aimantée montre qu'un contraste d’aimantation de ~1.5 A m-1 est nécessaire pour expliquer
9
Osinski et Spray 2005
10
l’anomalie, avec les parties les moins profondes (< 30 m) ayant une aimantation plus élevée
de ~ 2.3 A m-111.
Le travail de terrain mené en 2010 a suggéré que ces parties superficielles de la source de
l’anomalie magnétique centrale à Haughton étaient atteignables via un forage. En 2013,
trois forages situés au centre du cratère et nommés F1, F2 et F3 ont donc été réalisés. Une
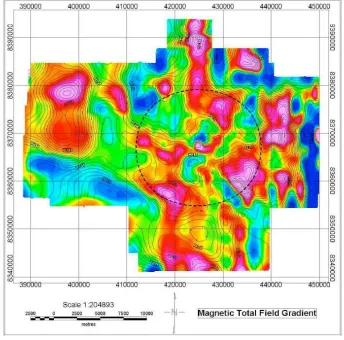
nouvelle cartographie à haute résolution du gradient vertical du champ magnétique a été
utilisée pour localiser précisément le pic de l’anomalie et pour planifier les emplacements
de forage dans des zones avec des signatures magnétiques différentes. Un log en gradient
magnétique vertical ainsi que des sondages de tomographie de résistivité électrique ont
aussi été effectués pour corréler les carottes récupérées dans les forages avec les propriétés
physiques de la sub-surface. En laboratoire, un susceptibilimètre a été utilisé pour mesurer
la susceptibilité magnétique volumique des carottes. Pour les mesures et les
désaimantations par champ alternatif des aimantations rémanentes naturelles (ARN) et
anhysterétiques (ARA), un magnétomètre cryogénique a été utilisé. Un magnétomètre à
échantillons vibrants a aussi permis de déterminer la minéralogie magnétique. Une
description pétrographique macroscopique détaillée des carottes a été réalisée par
inspection visuelle et grâce à une loupe de poche. L’analyse des lames polies a été réalisée
grâce à une microsonde électronique. Enfin, des mesures de fluorescence X ont été
effectuées à l'aide d’un instrument portable.
3.2 Résultats
Au niveau des forages, quatre formations de résistivité électriques ont été définies : une
zone horizontale de faible résistivité, une zone de résistivité intermédiaire, une zone à haute
résistivité et enfin une anomalie de faible résistivité dans le permafrost avec un minimum
local ≤ 100 Ω m. La carte du gradient vertical du champ magnétique révèle des anomalies
positives de ~ 20-30 nT m-1. Un signal de ~20-25 nT m-1 a été mesuré au niveau de F1,
~30-35 nT m-1 sur F2 et ~0 à -5 nT m-1 sur F3. Le log magnétique effectué dans le puit de
11
altération visible macroscopiquement. La carotte F2 a des structures spécifiques qui ne se
trouvent pas dans la carotte F3 et dans les échantillons de surface. Par exemple, des veines
de gypse de taille centimétrique y ont été observées macroscopiquement. L’analyse à la
microsonde électronique montre un halo d’oxydes et de sulfures de fer secondaires autour d’un claste de dolérite. Les résultats des mesures de fluorescence X montrent que F2 et F3
ont des teneurs similaires en Fe et Ti, mais que F2 est enrichi en S, Si, Mg et légèrement
en Ba, tandis que F3 est enrichi en Ca et Sr, relativement. Un résultat important est la
différence de densité solide et de porosité entre F2 et F3. F2 est caractérisé par une densité
solide moyenne de 2.43 associée à une porosité moyenne de 28 %. F3 a une densité solide
de 2.70 qui est identique à celle d’un échantillon provenant de la surface - et une porosité
de 34 % également supérieure à F2. F2 a une ARN moyenne ~ 5 fois supérieure à F3 (0.2
A m-1 pour F2 et 0.04 A m-1 pour F3). En outre, les valeurs maximales de susceptibilité et
d’ARN sont 3 et 13 fois supérieures dans F2, respectivement. Cette différence est
confirmée dans les mesures des cuttings. La susceptibilité magnétique volumique est
corrélée à la colonne lithostratigraphique : des pics locaux sont liés à la présence de clastes
mafiques dans des zones altérées par hydrothermalisme. L’inclinaison moyenne de l’ARN
est similaire dans les deux carottes et confirme la direction précédemment enregistrée par
les clastes des brèches d’impact (I = 71°)12. Si la différence entre les carottes F2 et F3 est
importante, il convient également de noter que l'aimantation de F3 est malgré tout
significativement plus élevée que l’ARN des échantillons prélevés en surface, dont
12
l'intensité d’aimantation totale est inférieure à 0.01 A m-1. Les mesures d’hystérésis ont
donné les rapports suivants pour F2 : 0.11 < Mr / Ms < 0.31 et 1.81 < Bcr / Bc < 2.46. Ces
résultats sont complétés par le champ destructif médian (CDM) de l’ARA, pour lequel
toutes les valeurs sont comprises entre 21 et 26 mT pour la carotte F2G1-H3 avec des
valeurs moyennes et médianes égales à 23 mT. Les résultats sont similaires dans les
échantillons F3 (2.05 < Bcr / Bc < 2.28 et 0.14 < Mr / Ms < 0.31) tandis que le CDM ARA est
légèrement supérieur avec une moyenne de ~31 mT. Les courbes thermomagnétiques
présentent des inflexions vers 580 °C et 500 °C.
3.3 Discussion
Cette étude comprend la description de plusieurs nouvelles caractéristiques qui n'ont jamais
été décrites précédemment à Haughton, telles que des brèches d’impact altérées par
hydrothermalisme et une anomalie de faible résistivité couplée à un gradient de champ
magnétique élevé près de la surface. Les mesures magnétiques couplées aux observations
pétrographiques indiquent que l’altération hydrothermale est responsable de l’augmentation du signal magnétique des roches fondues par cristallisation de minéraux
magnétiques (magnétite), ce qui entraîne une susceptibilité magnétique accrue et une
acquisition possible d’aimantation rémanente chimique. Cependant, l'aimantation totale des roches récupérées est inférieure d'un facteur huit à celle de l’aimantation de la source
profonde nécessaire pour expliquer l’anomalie du champ magnétique. Les anomalies
géophysiques de subsurface qui se superposent à l'anomalie principale du champ
magnétique sont attribuables à des processus épigénétiques post-impact tels que la
sédimentation et la concentration de grains magnétiques.
4. Paléomagnétisme des structures d’impact de type complexe
Cette partie est un article en cours de finalisation.
4.1 Contexte et méthodes utilisées
d'impact, 32 granites, 3 granodiorites et 3 gabbros) ont été échantillonnées à l'intérieur et
autour du cratère ouest au cours d'une campagne de terrain en 2015. Des deux carottes de
forage récupérées dans le cratère Est, seule celle du puits 1-64 peut être utilisée à des fins
paléomagnétiques car le forage était vertical. Les échantillons ont été mesurés dans un
magnétomètre cryogénique et désaimantés. Les ChRMs de sites calculées pour les brèches
et le socle ré-aimanté sont transformées en pôles géomagnétiques virtuels (PGV) à l'aide
du logiciel PaleoMac16. Les deux directions indépendantes sont combinées pour former un
PGV moyen pour la structure Ouest. Ce PGV est comparé sur une projection polaire avec
le chemin de dérive apparente du pôle (CDAP) pour l'Amérique du Nord à l’aide des bases
de données de PaleoMac17.
4.2 Résultats
33 ChRMs d’échantillons de brèches et roches d’impact fondues ont donné une ChRM de
site à polarité inverse très bien définie (I = -28 ° et D = 148 °). Cette ChRM est de bonne
qualité avec des points fortement groupés (α95 = 3.8). Elle est comparée aux ChRMs des
échantillons du socle, qui sont pour la plupart dispersées et ont donné des directions
normales et inverses. Par conséquent, la ChRM des impactites ne correspond pas à la
13 Dence et al. 1965 14 Reimold et al. 1981 15
Schmieder et al. 2015
16
Cogné 2003
17
plupart des directions du socle, indiquant qu’elle représente la direction du champ
géomagnétique au moment de l'impact. Le socle localisé au centre de la structure (anneau
central et îlots centraux), a donné une ChRM comparable et est donc considéré comme
ré-aimanté par l’impact. Il est intéressant de noter que le granite au centre du cratère a
conservé près de 50 % de son ARN initiale, tandis que les granites présents sur les îles de
l’anneau central en ont conservé environ 20 %, alors que ceux du bord du cratère sont
complètement désaimantés à 110 mT. Le PGV des roches d’impact fondues est compatible
avec un âge de 280-290 Ma. Au cratère Est, les données d’inclinaison du forage 1-64 ont
pu être utilisées. Les résultats sont trois directions paléomagnétiques indépendantes pour
les différentes lithologies échantillonnées : le granite, les sédiments et les roches fondues
par impact. Elles ont donné une inclinaison paléomagnétique positive moyenne de ~ 26,5
± 41,3 °. Malheureusement, l'erreur sur l'inclinaison du cratère Est est très importante, un
problème lié au faible nombre de spécimens qui a pu être mesuré.
4.3 Discussion
Au cratère Ouest, le résultat fortement groupé (α95 = 3.6) indique que la couche de roches
fondues par l’impact est compatible avec un âge Permien. Ce résultat est en accord avec
les âges radiométriques qui font consensus autour de 280 Ma pour cette structure18. Par
conséquent, nous considérons les nouvelles données apportées dans la présente étude
comme des preuves supplémentaires soutenant un âge Permien pour l’impact de Clearwater
Ouest. Une zonation de coercivité augmentant vers le centre du cratère est observée dans
les granites et possiblement liée à l’altération ou au choc induit par l’impact. Le cas de la
structure Est est plus difficile à interpréter, car très peu de données sont disponibles. Il est
intéressant de noter que l'inclinaison observée dans les granites de Clearwater Est ne
semble pas compatible avec un impact d'âge ≥ 300 Ma, ce qui est pourtant différent de l'inclinaison des brèches d’impact, éventuellement compatible avec ces âges. Nous pensons
18
réalisée pour la structure Est. À Tunnunik, la modélisation d’une zone de densité réduite
profonde de 1 km couplée à l’estimation des taux d’érosion à Haughton suggère qu’une
érosion post-impact de 1 à 3 km est possible à Tunnunik. Les structures ayant des niveaux
d'érosion importants ont tendance à avoir des anomalies de gravité plus petites20. Ceci est
confirmé par le minimum de gravité mesuré à Tunnunik, qui lorsque placé sur le
diagramme D = Δg, fait partie des valeurs négatives de gravité les plus faibles pour une
structure de cette taille. Cette étude souligne le fait que de nouvelles données géophysiques
de haute résolution (acquisition au sol) sont nécessaires pour mieux contraindre les
relations entre le niveau d'érosion et le diamètre final du cratère. À Haughton, des roches
d’impact fondues altérées par hydrothermalisme sont décrites pour la première fois grâce
à des forages superficiels. La carotte altérée est environ cinq fois plus aimantée que les
roches en apparence non altérées, mais le signal reste inférieur à ce qui a été modélisé pour
la source de l’anomalie principale. L’altération hydrothermale post-impact peut contribuer
de manière significative aux anomalies magnétiques locales dans les structures d’impact
terrestres et devrait être étudiée plus en détail. Les preuves de systèmes hydrothermaux
associés aux cratères d’impacts sur d'autres planètes du Système Solaire s’accumulent,
comme sur Mars où des observations minéralogiques et morphologiques ont été réalisées.
L’importance des processus post-impact sur le processus de cratérisation lui-même est
démontrée dans cette étude, ainsi que leur influence sur les anomalies géophysiques. La
notion développée dans ce travail et qui devrait être plus largement étudiée, est le concept
19
Scott et al. 1997
20
de « signature géophysique » des cratères et/ou structures d'impact. Cette notion doit
pouvoir évoluer et être améliorée avec le temps.
Par exemple, un travail futur devrait être de classer la signature géophysique des structures
d'impact en fonction de leur état d'évolution, c'est-à-dire pour un certain type et taille de
cratère, quel est le « niveau » de la signature géophysique en fonction des processus
eventually proposed for publication in a peer-reviewed journal (Chap. 4, “Clearwater
paper”).
All paper manuscripts have been fully prepared, coordinated and written by the candidate.
All co-authors have edited the manuscripts for verification, correction and improvement.
Some co-authors have provided a few data or figures in some cases (see below).
By the present, I attest that I have been working in the laboratories and in the field as much
as I could to produce the original data for this work, under the supervision and guidance of
my PhD thesis directors, Dr. Yoann Quesnel and Dr. Gordon Osinski. Other persons who
helped with supervision are thanked in the “Acknowledgement” section, and the object of
their intervention is explained. Concerning data acquisition, there are two cases for which
I did not acquire the data in the field myself:
1) Haughton paper: drill cores and field geophysical experiments were obtained in the
Arctic prior to the start of this thesis by Dr. Yoann Quesnel, Dr. Jérôme Gattacceca
and Pr. Pierre Rochette, in collaboration with Dr. Gordon Osinski and his team;
2) Clearwater paper: drill cores for the West Clearwater Lake impact structure were
obtained on-site by Adam Coulter and colleagues who were part of the team of Dr.
Gordon Osinski.
At Tunnunik, I participated to the 1-month field work in the Arctic. Field geophysical
experiments have been split between the different members of the team and I have
participated to all acquisitions. The roles of the co-authors for the Haughton paper and
1) Haughton paper (Co-authors are Yoann Quesnel, Pierre Rochette, Gordon R.
Osinski, Cassandra Marion, and Jérôme Gattacceca): WZ wrote the original
manuscript, worked in the laboratory to produce all the data, corrected, finalized
and submitted the manuscript after peer-reviewed process; YQ provided significant
help with GIS, geophysical processing and realization of Figs. 3.2and 3.4(provided
GIS layers for some data); PR provided significant help in the laboratory and
measured the magnetic properties of some cuttings; GRO provided Fig. 3.1. CM
performed probe measurements and provided Fig. 3.7. JG provided significant help
in the laboratory, especially concerning paleomagnetism. YQ, PR and JG acquired
all the data in the field with help from CM and other members of GRO team. All
co-authors read, made comments/suggestions and approved the manuscript after
WZ provided corrections.
2) Tunnunik paper (Co-authors are Yoann Quesnel, Pierre Rochette, Minoru Uehara,
Jérôme Gattacceca, Gordon R. Osinski, and Cédric Champollion): WZ wrote the
original manuscript, performed modeling and realized all figures but Fig. 2.1. YQ
provided training and help with modeling, and processed magnetic field data. PR
provided the original gravity data and some processing. MU processed
electromagnetic data and provided Fig. 2.5. CC provided training and help for
geophysical processing of gravity data. The paper is currently under review by the
co-authors and may change significantly before publication.
William Zylberman
La première personne à remercier est très certainement mon directeur de thèse, Mr. Yoann
Quesnel. Sans lui, cette thèse n’aurait pu aboutir. Malgré le fait que je sois son premier
doctorant – avec Nicolas –, il a su encadrer cette thèse d’une main de Maître et gérer ma
personnalité parfois tumultueuse ! En particulier, je veux vraiment saluer son suivi régulier,
sa bienveillance et son immense disponibilité, je pense que c’est exceptionnel. Il a toujours
été le premier à répondre à mes emails, à me renvoyer ses corrections très détaillées, et à
m’aider à m’améliorer. Un grand merci Yoann, pour avoir toujours gardé ta porte ouverte
pendant 3 ans, et pour avoir lu ta boîte mail même tard le soir et le week-end !
Thanks to my co-director Dr. Gordon Osinski, without whom this work would never have
been achieved: in particular, I am very grateful that you redirected me to the people at
Cerege so that we could start this conclusive collaboration between France and Canada!
Thanks also to all the very nice folks and administrative staff at CPSX, who have greatly
facilitated my time there, and also to the Arctic team who kept me safe when wolves were
roaming in the camp… Bob and Cass, in particular! Thanks also to Dr. Richard Grieve for
sharing his knowledge on impact melt rocks, to Dr. and friend Livio L. Tornabene for his
help with GIS and very nice coffee in London’s little Italy, to Marc Beauchamp for his
training on the EPMA, to Dr. Maria Cioppa and Prof. David Symons of the University of
Windsor, for their warm welcome, training and help at the laboratory of paleomagnetism.
A big thank you to the great Phil McCausland, who trained me with the drilling/sawing
equipment at Western and helped a lot with paleomag. Thanks to Prof. Gerhard Pratt for
sharing important knowledge of geophysics. Dr. Michael Poelchau from the University of
Freiburg and Dr. Sonia Tikoo from Rutgers University are also thanked for reviewing and
Thanks to the two reviewers of this thesis, Prof. Lauri Pesonen and Dr. Stuart Gilder, for
allowing me to defend, writing detailed reports to the University and suggesting
improvements. I would like to address special thanks to Prof. Lauri Pesonen, who sent me
extremely detailed hand-made corrections by post mail while he was on travels himself,
for his very pedagogic, positive and constructive feedback, and encouragements to finish!
Ensuite, mes remerciements vont au personnel « administratif » du Cerege (en particulier
Noémie, Hadja, Isabelle, Nicolas, Martine et les autres) et à toute l’équipe de Géophysique
(Physique et Structures) : Big Up à Mr. François Demory, Ingénieur du Chalet, «
coffee-man », pour sa bonne humeur, ses conseils en maillot de bain et en baskets, son humilité,
et surtout pour avoir passé tout ce temps à me former sans même être co-auteur d’un de
mes papiers ! Spécifiquement, merci pour la formation sur la machine à café du Chalet, je
pense que j’aurais clairement raté ma thèse sans elle (la machine à café) ! Merci pour toutes
les fois où tu as sauvé les instruments du Chalet de la destruction totale… ;) Merci au grand
Mr. Pierre Rochette, qui a été à l’origine de mon entrée au Cerege il y a déjà plus de 3 ans,
sans qui de nombreux projets et collaborations de cette thèse n’auraient pu aboutir, et grâce à qui j’ai beaucoup appris sur l’aimantation… Merci de ta confiance depuis le début ! Merci à Jérôme, pour ses explications toujours passionnantes (si si c’est vrai), les heures à
bidouiller PaléoMac, la formation détaillée sur la foreuse à cailloux du Cerege… Je m’en
souviendrai ! Merci enfin aux autres people de l’équipe, toujours là pour mettre une bonne
ambiance : en particulier Minoru pour le 酒 (hum !) et la session d’EM dans l’Arctique,
inoubliable ! Et les autres comme Mireille pour ses grands sourires tous les jours et P.-E.
Mathé pour ses explications compliquées, Philippe Dussouillez pour son aide avec le
système dGPS pour Tunnunik, Cédric Champollion de l’Université de Montpellier pour
son aide précieuse avec la gravimétrie, et tous les autres.
Thanks also to the great team of expedition IODP364 “Chicxulub impact crater”, who I
had the chance to meet and spend a wonderful month with in Bremen, Germany in
Sébastien, Manon et ceux que j’oublie. Merci à Cécile et Aurore (les anciennes de l’équipe)
pour vos conseils précieux. Merci à mes copains et collègues de DynAMU (le réseau des
Doctorants d’Aix-Marseille Université), cela a été un plaisir de créer ce beau projet avec
vous et de le faire évoluer. Je suis convaincu que ce ‘side-project’ a été essentiel à mon
épanouissement pendant ma thèse. L’ancienne équipe (la première !) : Rym, Lola, Julie,
Amélie, les deux Morgane, Livia, Mohamed... Et la nouvelle : Gaëtan, Lola, Céline,
Clément, Chloé, Laure, Hacene et Israël. J’espère que vous porterez haut les couleurs des
doctorants !
Cette période de thèse a été extrêmement riche en rencontres, émotions, découvertes,
rebondissements… D’autant plus avec l’année passée à London ON, un interlude qui a
chamboulé ma vision du monde, un choc culturel et sociétal sans lequel je ne serais pas qui
je suis aujourd’hui. Not only traveling, but living in a foreign country is essential… it
opens-up your mind to an extent that you cannot imagine. I wish that everyone has a chance
to live this experience at least once. It confronts you to cultural, social and societal
differences that at the same time can be so slight that you can’t realize them if you only
travel, but also so deep that they will change you forever. I have met so many truly
amazing, nice and open-minded people who have made my experience unique,
unforgettable and so rich in human-emotions. My close friends: Steven, thanks for sharing
so many lunches, delicious lunch-boxes and dinners with me! I will never forget how you
made me a lunch box the first time! Hasan, how we met should be written in textbooks… “Hey I will live at Beaufort St. –Me too! Which number? –6. So we are roommates, let’s
listening and very nice dinner at your place, for presenting me your family; Guys, I will
never forget our ping-pong tournaments! Thanks to Sabrina for an unforgettable tour in the
Far West…
The Europeans, Anne and Josefine, Bianca, Jakob and Philip, what a trip in the hot Cuban
waters! The folks at the Geo and CPSX department of Western: Amanda, Hiruni, Taylor
& friends, Bethany, Racel… awesome! The gang at Beaufort St.: Sofie and Sarina our
Danish roomies – thanks for the best Halloween night – Flo and Leena, Ian, Zeeshan,
Damian, Mitsuru, the always very nice parties at Jacob’s next door and at our place with
my friend Vivek, Hessam, Alina and Huiying, Lasse, Abhi, Tanmay, Sonia, Cindy, Archie,
Sara, Daisy, Samira, Hui, Paris, Iris, Venus, Gloria, and the unknown guys, thanks to all
for coming to our “house parties” and bringing so much fun! Oh and to the red cups… Non
non, je ne suis pas du tout nostalgique !
By essence, this PhD has been an extremely rich experience thanks to the diversity of the
people who crossed my path. To give a small sample of this beautiful multicultural
diversity, I would like to cite here some of the different native countries of the people I had
the chance to meet: Canada and Québec, Ethiopia, Germany, Netherlands, Denmark,
England, Sri-Lanka, China, Japan, Indonesia, US, Korea, Switzerland, France (me
excluded!), Pakistan, Iran, India, Algeria, Egypt, England, Argentina, Mexico, Belgium,
Portugal, UAE…
J’aurais voulu mettre ma famille en co-auteurs de ce travail (je leur doit bien !), mais la liste aurait été trop longue et ça ressemblerait trop à un papier de chez Science ou Nature…
Du coup, je veux dire ici que je suis éternellement reconnaissant à cette famille soudée, qui
m’a toujours supporté, soutenu, encouragé, écouté… Je tiens à remercier en particulier ma
grand-mère Wylliamme, qui m’a depuis longtemps encouragé à conduire de longues
études. Merci à mon père François, qui a contribué à la première pierre d’une longue
collection. Merci à mon frère Julien pour ses explications en Mathématiques… je suis
convaincu que tu iras encore plus loin que moi ! Merci à Catherine, pour les soirées au coin
l’Univers, les chakras… merci à Michel pour les tournois de ping-pong et de billard !
Thanks to my Canadian family who welcomed me when I was near Toronto: Cindy,
Miriam, Yael et Greg, merci pour votre accueil si chaleureux qui m’a fait me sentir à la
maison ! Thanks to my talented cousins Zoe and Benjamin for an impressive and very
intense song. Thanks a lot Liliane for such a fascinating discussion about a rich and intense
family history. Thanks to Rachel in Edmonton, merci à la famille de Montréal : surtout
Marc O. Benattar pour m’avoir généreusement accueilli chez lui, ainsi que Ruth et Gaby
Minz pour un délicieux repas, et aussi Jonathan, Elana, Laurent Benattar…
Merci aussi à mes amis d’enfance Philippe et Jordan, Raphaël et copains du Nord, Fred,
Pierre, Raphaël (l’autre) et Micky, et toute l’équipe « Hummus » de l’été 2016…, merci
aux membres du célèbre groupe de rock « the kink band » : Bobi et Elisabeth « les
grincheux », Mathieu Moulin #leviking, Alexis mon premier colloc, Paul en sandales par
-10°C, et l’autre là… Thanks to Pasqualina, the best Aussie in my life, for her very funny
visit while I was writing this work! (and for the cookies, chocolate and drawings which
greatly contributed to this thesis) Now we have a great picture with Cézanne. You
remember who he is, right?
Vielen Dank an Claudia für ihre uneingeschränkte Unterstützung, ihr Vertrauen, ihren Rat
und ihre Zuneigung. Danke Schön für die herzliche Begrüßung der Familie Keller im
Oh, and of course thanks to my cat, Bibou, who warmed me up while I was writing this
thesis.
All of you… this is not only my PhD, but it is also yours.
A new adventure begins…
“The only way to discover the limits of the possible is to go beyond them into the
impossible.”
– Sir Arthur C. Clarke
“Do not go where the path may lead, go instead where there is no path and leave a trail”
– Ralph Waldo Emerson
“For myself I am an optimist - it does not seem to be much use to be anything else.”
Résumé étendu (extended abstract in French) ... 6
Co-Authorship Statement... 18
Acknowledgments... 20
Table of Contents ... 26
List of Tables ... 30
List of Figures ... 31
List of Appendices ... 38
Preface... 39
1 Literature review ... 41
1.1 Hypervelocity impacts ... 41
1.2 Morphometry of hypervelocity impact craters ... 43
1.2.1 Simple craters... 43
1.2.2 Complex craters ... 44
1.3 Geology of complex impact craters ... 45
1.3.1 Subsurface structure ... 45
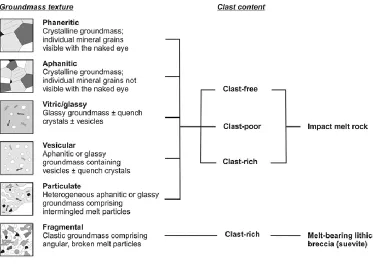
1.3.2 Impact lithologies... 47
1.3.3 Shock metamorphic markers... 49
1.4 Geophysical methods for identifying impact signature and processes ... 55
1.4.1 Principles of geophysical anomalies ... 55
1.4.2 Gravimetry ... 56
1.4.3 Magnetic field mapping ... 62
1.4.4 Electrical resistivity method ... 67
1.4.5 Seismic methods ... 71
1.4.6 Other methods ... 75
1.5 A case study of geophysical signature: Haughton ... 85
1.6 Conclusion ... 91
1.7 References ... 92
2 Effect of erosion on the geophysical signature of mid-size impact structures ... 99
2.1 Geophysical signature of the Tunnunik impact structure, Northwest Territories,
Canada... 99
2.1.1 Introduction ... 99
2.1.2 Methods... 102
2.1.3 Results and interpretation ... 107
2.1.4 Discussion ... 112
2.1.5 Conclusions ... 122
2.2 Additional information... 123
2.2.1 Gravity data reduction... 123
2.2.2 Calculation of the depth of fracturation associated with the structure in
its present erosion state ... 133
2.2.3 Electromagnetic soundings ... 134
3.1.3 Results ... 149
3.1.4 Discussion ... 166
3.1.5 Conclusions ... 172
3.2 Supporting information ... 173
3.2.1 Electrical resistivity imaging ... 174
3.2.2 Petrography of the drill cores: additional details ... 178
3.3 References ... 188
4 Paleomagnetism of impact structures... 194
4.1 Paleomagnetic dating: an application to the controversial case of the Clearwater
Lake impact structures, Canada ... 194
4.1.1 Introduction ... 194
4.1.2 Methods... 201
4.1.3 Results ... 203
4.1.4 Discussion ... 214
4.1.5 Conclusion ... 215
4.1.6 References ... 216
5 General conclusion and discussion ... 219
Appendices ... 231
Reversal test ... 232
Conglomerate test ... 233
Fold test ... 235
A.2. Influence of lithology and types of magnetization: example at Chicxulub... 240
Introduction ... 240
IODP364: the expedition ... 242
Onshore science party: some preliminary results ... 244
Table 4. Exploration depths for EM34-3 ... 134
Table 5. Density and porosity of the samples ... 161
Table 6. Average magnetic susceptibilities, NRM, and inclination of the NRM ... 162
Table 7. NRM data of cuttings and recovered fragments ... 162
Table 8. Estimated petrographic characteristics of the cores ... 180
Table 9. Estimated components volume percentages of core F2 compared to core F3 .. 181
Table 10. Metric characteristics, density and porosity of the samples ... 182
Table 11. Hysteresis parameters and remanence acquisition curves ... 183
Table 12. List of ChRMs from basement samples located in the central area ... 207
Table 13. Parameters of site-mean ChRMs and virtual geomagnetic poles ... 207
List of Figures
Figure 1.1. Contact/compression stage: shock-wave generation and projectile deformation.
... 42
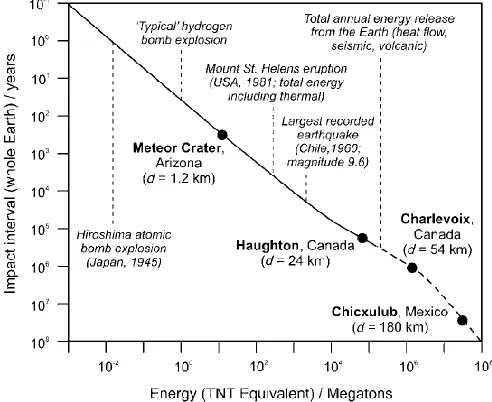
Figure 1.2. Comparison of the energy released during hypervelocity impacts with
endogenous geological processes and man-made explosions ... 42
Figure 1.3. Simple impact crater ... 43
Figure 1.4. Complex impact crater ... 44
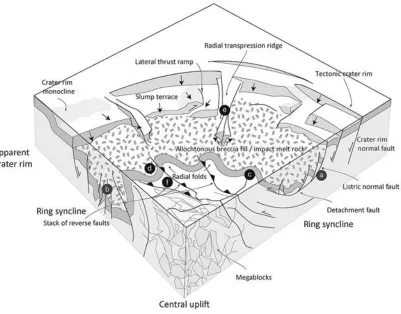
Figure 1.5. Schematic block diagram showing characteristic structural features of a partly
eroded complex impact crater ... 46
Figure 1.6. Classification scheme for impact melt-bearing impactites ... 48
Figure 1.7. P-T diagram showing comparative conditions for shock metamorphism and
“normal” crustal metamorphism ... 49
Figure 1.8. Photography of shatter-cones on a dark fine-grained carbonate rock at the center
of the Tunnunik impact structure ... 50
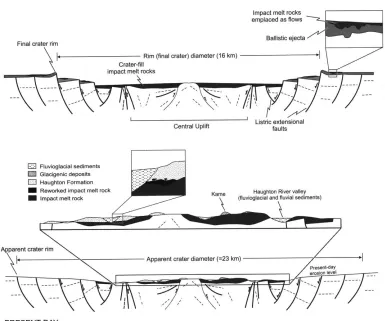
Figure 1.9. Schematic cross-sections depicting the newly formed Haughton impact crater
and its present-day erosion state ... 52
Figure 1.10. Cross-section of a typical mid-size complex impact crater with central uplift
... 54
Figure 1.11. Example of a negative geophysical anomaly ... 56
Figure 1.12. Successive steps of gravity anomaly calculations ... 58
Figure 1.13. Residual Bouguer gravity profiles over impact craters scaled to crater diameter
Figure 1.17. ERI apparent-resistivity model at the core-breccias boundary of the
Araguainha structure, and corresponding geological interpretation ... 71
Figure 1.18. Principle of seismic reflection and refraction ... 72
Figure 1.19. Seismic reflection profile and velocity model across the peak-ring and annular
trough of the Chicxulub multi-ring basin... 73
Figure 1.20. Geological cross-section and associated reflection seismic profile of the Waqf
as Suwwan crater, Jordan ... 75
Figure 1.21. Example of electromagnetic anomaly generated by a vertical thin source
measured by a vertical dipole EM survey ... 77
Figure 1.22. Secular variation of the dipole field over the past 2,000 years ... 80
Figure 1.23. Real core VS magnetometer system coordinates established for the
paleomagnetic study of IODP364: Chicxulub impact crater ... 82
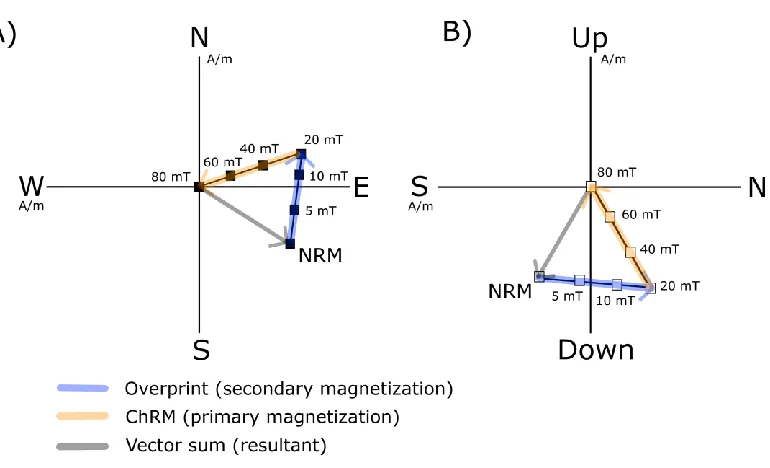
Figure 1.24. Example of stepwise alternating-field (AF) demagnetization data visualized
on a horizontal NS-EW plane (A) and a NS-up/down orthographic plane (B) ... 84
Figure 1.25. Magnetic total field vertical gradient over the Haughton impact structure .. 86
Figure 1.27. Distribution of hydrothermal deposits within and around a typical complex
impact crater... 88
Figure 1.28. Simple model of the source of Haughton’s central positive magnetic field
anomaly ... 89
Figure 1.29. 2D forward modeling of the substructure of Haughton, based on gravity and
magnetic data ... 90
Figure 1.30. 3D-view of forward modeling of the sources possibly responsible for
Haughton’s central positive magnetic field anomaly... 91
Figure 2.1. Location and geological map of the Tunnunik impact structure ... 102
Figure 2.2. Location of geophysical measurements performed at Tunnunik ... 105
Figure 2.3. Complete Bouguer gravity anomaly map over the center of the Tunnunik impact
structure... 108
Figure 2.4. Positive magnetic field anomaly over the center of the Tunnunik impact
structure... 110
Figure 2.5. Apparent conductivity profiles based on EM34-3 measurements over the center
of the Tunnunik impact structure ... 112
Figure 2.6. Interpolated magnetic and gravity profiles obtained after reductions and
corresponding non-unique forward model over the center of the Tunnunik impact structure
... 121
Figure 2.7. Regional NW-SE Bouguer gravity trend over the Tunnunik impact structure
... 126
Figure 2.8. DEM and successive steps of gravity data reduction over the Tunnunik impact
Figure 3.1. Geological map of the Haughton impact structure ... 143
Figure 3.2. Location of geophysical measurements and drillings performed at Haughton
... 146
Figure 3.3. Apparent resistivity model resulting from ERI profile n°1 ... 150
Figure 3.4. Magnetic field mapping and gradient over the drill sites ... 152
Figure 3.5. Petrography of the clast-rich polymict impact melt rocks recovered in drillings
F2 and F3 ... 155
Figure 3.6. Geological and magnetic susceptibility logs for the core F2 from section G1 to
section H3 ... 159
Figure 3.7. Rim of Fe-oxides and sulfides around a dolerite clast ... 160
Figure 3.8. Volumic magnetic susceptibility, natural remanent magnetization,
Koenigsberger ratio, total magnetization, inclination of the NRM, and median destructive
field of the NRM and ARM, for the core F2 from section G1 to section H3 ... 163
Figure 3.9. Orthogonal projection plots (Zijderveld diagrams) of stepwise alternating-field
demagnetization data of the cores ... 165
Figure 3.10. Simplified model explaining the different pre-, syn-, and post-impact
geological processes believed to be responsible for the observed geophysical anomalies at
Figure 3.11. Solid material recovered in the drill holes F1, F2 and F3 ... 173
Figure 3.12. Electrical resistivity imaging profiles ... 174
Figure 3.13. Average composition of major oxides, minor and trace elements in the matrix
of the cores F2 and F3, obtained from portable XRF measurements ... 184
Figure 3.14. Customized light drilling system ... 185
Figure 3.15. Thermomagnetic curves performed on samples from drill cores F2 and F3
... 186
Figure 3.16. Coercivity spectra and hysteresis loops of additional samples ... 187
Figure 4.1. Remote sensing of the Clearwater Lake impact structures ... 195
Figure 4.2. Location of some of the drill holes realized in 1963 and 1964 in the two
Clearwater Lakes, superimposed on a magnetic field anomaly map ... 197
Figure 4.3. Natural Remanent Magnetization (NRM) directions of the two Clearwater Lake
impact structures plotted on stereograms ... 199
Figure 4.4. Location of the 75 paleomagnetic core samples taken at the West Clearwater
Lake impact structure during a 2014 field season ... 202
Figure 4.5. Orthogonal projection plots (Zijderveld diagrams) of stepwise alternating-field
demagnetization data for different lithologies at different locations in the West Clearwater
Lake impact structure ... 204
Figure 4.6. Normalized alternating-field (AF) demagnetization curves showing increasing
coercivity in granites from the West Clearwater Lake impact structure ... 205
Figure 4.7. Site-mean ChRM of impact melt rocks compared to scattered ChRMs of
Figure 4.10. Expected inclination at Clearwater Lakes as a function of age based on APWP
data ... 216
Figure 5.1. Maximum gravity negative (Δg) as a function of apparent crater diameter (Da)
... 221
Figure 5.2. Maximum gravity negative (Δg) as a function of apparent crater diameter (Da)
and erosional level ... 221
Figure 5.3. Plan views of gravity anomalies at different erosion levels for a 30 km-diameter
symmetrical impact ... 223
Figure 5.4. The used 30 km diameter model of a complex impact structure with central
uplift and occurring in a crystalline target and evolution of the shape, amplitude and
wavelength of Bouguer gravity anomalies over the modelled crater with increasing degree
of erosion ... 224
Figure 5.5. Possible hydrated mineral phases deduced from spectral data at Toro crater,
Mars ... 226
Figure 5.6. Close-up of image DEM at Toro crater on Mars showing possible hydrothermal
mounds, and their supposed equivalent on Earth (Santorini caldera, Greece) ... 227
Figure A.1. Equal-area projection plot of low and high-temperature paleomagnetic
components of Ordovician carbonate rocks located outside Haughton’s crater rim on
Figure A.2. Hot or cold mode of emplacement of a breccia or conglomerate rock ... 234
Figure A.3. ChRM of impact melt rocks (IMR) including clasts and impact-tilted target
rocks ... 235
Figure A.4. Principle of a “failed” paleomagnetic fold test ... 236
Figure A.5. Failed paleomagnetic fold test for Haughton tilted blocks viewed on equal-area
projections ... 238
Figure A.6. Relative chronology of pre-, syn- and post-impact cratering processes
established at Haughton based on paleomagnetism ... 239
Figure A.7. Potential-field anomalies associated with the Chicxulub impact structure
buried on the Yucatán peninsula, Mexico ... 241
Figure A.8. The lift-boat Myrtle transformed in drilling-platform during the offshore phase
of IODP364 expedition ... 243
Figure A.9. Petrographic description of the cores during the onshore phase of the IODP364
expedition, MARUM Institute, Bremen, Germany ... 243
Figure A.10. Prof. Sonia Tikoo with fellow paleomagnetist William Zylberman holding
paleomagnetic sample after sampling the Chicxulub drill core ... 244
Figure A.11. Magnetic properties of discrete samples from the impact melt rock/peak ring
breccia section ... 246
Preface
The topic of impact cratering is geology’s latest revolution. Hypervelocity impacts of
meteorites and comets are probably the geological process which is the hardest to visualize,
because the energy generated is beyond possible comprehension and the phenomenon
happens in seconds to minutes. Consequently, meteorite impacts have tremendous negative
and positive (mineral resources, biological niches) effects on the Earth, its materials and
life at its surface. The potential for future space missions is also important, and I expect the
science of impacts to develop more intensely in the medium-term future as human missions
to other worlds are planned. In fact, as I like to say, “craters are windows” into the
subsurface of planets, and allow us to access the underground geology otherwise
inaccessible. But on Earth, where most craters have been hidden by active geological
processes, we must find a way to access them. In this respect, geophysical techniques are
very useful. They allow us to image the underground with high precision, revealing deep
structures, central uplifts, faults and other boundaries normally unseen by geological tools.
In this work, we focus on mid-size complex Canadian impact craters because the Canadian
Shield is one of these old terranes in the world where numerous craters are found. Also,
impact craters can be exceptionally well preserved in environments such as the Arctic, and
Canadian craters are arguably some of the best studied in the world. However, relatively
few studies have looked at the geophysical signature of complex impact craters, most of
which have just focused on defining the overall trends of the magnetic and gravimetric
anomalies over entire structures. But the geology of impact structures can be tremendously
complex, and as a geologist who unexpectedly had to jump into geophysics, I am now
convinced that a look in great details at rocks from macroscopic field observations, to
microscales under the microscope, and combining meticulous petrographic observations
with thorough field and laboratory geophysical measurements, is a key for future works to
go beyond classical studies and challenge current interpretations. I wish you a good journey
in the curious world of hypervelocity impact cratering.
William Zylberman
Drawings of the Moon by Galileo Galilei, published in Sidereus Nuncius (1610)
1
Literature Review
1.1
Hypervelocity impacts
Hypervelocity impact happens when a cosmic object is large enough and coherent enough
to pass through the atmosphere with no or little deceleration so that it will strike at virtually
its original cosmic velocity (>11 km s-1, French 1998; in Osinski 2013). The required sizes
for such objects are typically > 50 m for a stony body and > 20 m for an iron object (French
1998). This is different from relatively lower velocity impacts produced by smaller and/or
less coherent objects, and all along this thesis the term “impact” will be used to refer
exclusively to impacts of the hypervelocity type. In fact, projectiles of only a few meters
in size disintegrate or break up when passing through the atmosphere and produce only
small penetration craters in which entire or pieces of projectiles can be found, with impact
velocities of a few hundred meters per second (French 1998).
In contrast, the projectile are rarely found in hypervelocity impact craters, because it is
melted and/or vaporized at the contact with the ground. In fact, shock waves radiate from
the point of impact at speeds which can exceed 10 km s-1, and propagate in the pre-impact
target rocks and in the projectile itself. Normally, terrestrial rocks undergo elastic and
plastic deformations at ~1 GPa, while peak shock pressures encountered during
hypervelocity impacts can reach several hundred GPa (Fig. 1.1) (French 1998).
As a comparison, the most powerful earthquake ever recorded (Chile, 1960), of magnitude
9.6 on the Richter scale, released an energy of 103-104 TNT Equivalent/Megatons, while
the Chicxulub impact in Mexico is believed to have released an energy nearly four orders
of magnitude higher, between 107-108 TNT Equivalent/Megatons (Fig. 1.2). Therefore,
hypervelocity impacts are exogenous geological processes that release energies from far
greater than the most powerful endogenous or human processes on Earth. It is easy to
understand, then, that they can have dramatic consequences for the geology, climate, and
Figure 1.1. Contact/compression stage: shock-wave generation and projectile
deformation. Theoretical cross-section of the impact of an originally spherical
projectile onto a uniform target. When shock waves reach the rear of the projectile,
they will be reflected forward as rarefaction (or tensional) waves, resulting in
melting and/or vaporization of the projectile itself. Pressures are in GPa. (From
French 1998; modified after Melosh 1989; after O'Keefe and Ahrens 1975).
Figure 1.2. Comparison of the energy released during hypervelocity impacts with
endogenous geological processes and man-made explosions. Vertical axis represents
the frequency of impact events as the estimated interval in years for a specific size of
event. As an example, an impact of the size which formed Barringer Crater is
expected once in 1900 years. (Data from French 1998; in Osinski and Pierazzo
1.2
Morphometry of hypervelocity impact craters
Hypervelocity impact craters are subdivided into two main groups based on their
morphology: the simple and complex types. The transition from simple to complex types
is inversely proportional to gravity (1/g), which suggests that collapse happens when a
certain breaking threshold is reached (Osinski and Pierazzo 2013).
1.2.1
Simple craters
A simple impact crater typically comprises a circular bowl-shaped depression. When fresh,
it has an uplifted rim covered by impact ejecta. The true crater is filled with newly-formed,
impact-generated deposits such as impact breccias and melt rocks, while the crater floor is
made of shocked, fractured and brecciated target rocks (Fig. 1.3). Simple craters have
typical depth-to-diameter ratios of 1:5 to 1:7 (Melosh 1989). Simple craters on Earth
transition to the complex type at diameters of 2 and 4 km, depending if the main type of
target rock is sedimentary or crystalline, respectively (Osinski and Pierazzo 2013).
Figure 1.3. Simple impact crater. Schematic cross-section of the principal elements
of a fresh, simple impact crater in crystalline rocks. D is the final (rim-to-rim)
and the fact that the depression is filled with impact products while the rim is covered by
ejecta in fresh (young/undeformed) impact craters. These products can be partially or
totally removed in eroded (older) craters, which then are called “impact structures” (Fig.
1.4, bottom). This results in difficulties in determining the morphometric parameters (D,
da and dt) of the original crater, and generally only an apparent crater diameter (Da) can be
determined based on the outermost ring of (semi-) continuous concentric normal faults,
which is the case for most impact structures on Earth (Osinski and Pierazzo 2013).
Figure 1.4. Complex impact crater. Top: fresh complex impact crater with ejecta
(blue) covering the faulted rim and allochthonous crater-fill deposits (red) filling the
depression. SU = Structural Uplift, dt = True depth, da = Apparent depth, D = Final
crater (rim-to-rim) diameter. Bottom: eroded complex impact structure. Da =
Apparent crater diameter (where topographic rim eroded away) (Osinski and
1.3
Geology of complex impact craters
1.3.1
Subsurface structure
The general morphology of complex impact craters has been described above. However,
in detail these general characteristics are a lot more complicated and the geology of
complex impact craters can comprise several different lithological facies linked together in
three main tectonic settings (Fig. 1.5): the apparent crater rim, the down-faulted annular
trough, and the central uplift (Kenkmann et al. 2013).
1.3.1.1
Crater rim
Defining where the crater rim is located is of critical importance to define the size of an
impact crater, that is its apparent diameter (Da) and its final (rim-to-rim) diameter (D). The
apparent crater rim comprises tectonic normal faults that undergo unconstrained dip-slip
toward the center of the crater, resulting in the formation of terraces on which ejecta and
sediments can eventually be deposited. Deeply eroded impact structures can partially lack
these faults, and Da is then defined on the basis of circumferential monoclines that can be
combined with normal faults (Fig. 1.5). These monoclines are open folds in which a side
of the fold remains in situ, without movement. Often, the inner limb of a crater monocline
dips downward towards the crater center, and the hinge of the monocline defines the crater
rim (Kenkmann et al. 2013). These features are hard to observe on Earth, because most
fresh terrestrial craters have been exposed and then eroded. However, it can be expected
that marine-target craters are well preserved below sediments (e.g., Chicxulub), and thus
those structures could be observed, notably via geophysical imaging such as seismic
methods. This fact should be kept in mind as it will be of critical importance for future
marine geology exploration. However, such structures can also be heavily modified by
instant tsunamis and/or filled with resurge deposits (e.g., Lockne; Osinski, Pers. Comm.)
1.3.1.2
Annular trough
The down-faulted annular trough is located between the crater rim and the central uplift
Figure 1.5. Schematic block diagram showing characteristic structural features of a
partly eroded complex impact crater, formed during the modification (final) stage of
crater formation. (Kenkmann et al. 2013).
1.3.1.3
Central uplift
The central (or structural) uplift presents the highest degree of deformation and is
composed of rocks brought from depth to the surface via dynamic movements during crater