ISSN 2286-4822
www.euacademic.org DRJI Value: 5.9 (B+)
Using Vis-NIR hyperspectral HYPERION data for
bare soil properties mapping over Mediterranean
area: plain of the Oued Milyan, Tunisia
ANIS GASMI
PhD Student Faculté des Sciences de Tunis (FST) Campus Universitaire 2092 El Manar, Tunisie
CECILE GOMEZ
Research Scientist Institut de recherche pour le développement (IRD) Laboratoire d'Etude des Interactions Sols-Agrosystèmes-Hydrosystèmes (LISAH), Campus AGRO-Bat.24, 34060 Montpellier
France
HEDI ZOUARIC Professor Laboratoire de Géoressources Centre de Recherches et Technologies des Eaux Technopole Borj Cedria, BP 273, Soliman 8020, Tunisie
ANTOINE MASSE
Research Scientist Centre d'Etudes Spatiales de la Biosphère 18 av E. Belin - bpi 2801 - 31401, Toulouse cedex 9 France
DANIELLE DUCROT
Professor Centre d'Etudes Spatiales de la Biosphère 18 av E. Belin - bpi 2801 - 31401, Toulouse cedex 9 France
Abstract:
airborne imagery is now considered as promising technology for increasing the accuracy of digital map of topsoil properties. Nevertheless, the significant potential of the VNIR/SWIR hyperspectral imagery for mapping topsoil properties has been showed from airborne data collected with high spatial resolution (~5 m) and high signal-to-noise ratio (SNR). The purpose of this work is to determine if VNIR/SWIR hyperspectral imagery by Hyperion satellite (spatial resolution of 30m and SNR~50:1) sensor can be used for topsoil properties mapping. This study focused on a Mediterranean area of 210 km² (plain of the Oued Milyan, Tunisia), and the estimation of two soil properties useful to study the risk of soil erosion from water: clay and calcium carbonate (CaCO3). The predicted clay and CaCO3 content maps were obtained using the partial least squares regression (PLSR) method. Hundred and twenty four soil samples were used to calibrate and validate the prediction models of clay and calcium carbonate content. The large area (210 km²) of the studied region allows analysis of pedological patterns in terms of soil composition and spatial structures. Our results showed that Hyperion satellite data may be used to map clay and calcium carbonate contents over bare soils, with respectively R²val of 0.71 and R²val of 0.79. Finally, the Hyperion satellite data offers an alternative method for digital mapping of soil properties over large areas at interesting spatial resolution (30 m).
Key words: hyperspectral satellite remote sensing, Hyperion, partial
least-squares regression, digital soil mapping, Clay, Calcium carbonate.
1. Introduction
quantify vulnerability to erosion (Le Bissonnais, 1996). Therefore, the development of faster and cheaper methods for identification of soil properties is a major issue.
The use of visible, near-infrared and short wave infrared (VNIR/SWIR, 400-2500 nm) imaging spectrometer can greatly increase the results accuracy of the digital soil mapping (e.g. Lagacherie and Gomez, 2014). In fact, airborne and / or satellite spectroscopy should provide estimates of soil surface properties such as carbon content, soil texture and calcium carbonate content , over large areas and for high spatial resolutions (~5 m) (e.g. Ben- Dor et al. , 2009; Lagacherie et al. , 2012).
In addition, estimates of soil properties done with airborne and satellite hyperspectral can be subject to degradation due to atmospheric effects, low signal to noise ratio of the instrumentation, roughness, moisture and spectral mixture the soil surface (e.g. Lagacherie et al. , 2008 , Gomez et al. 2008a; Nanni and Dematte 2006).
Up to now, most of the studies have demonstrated the ability to identify the contents of soil properties from airborne hyperspectral imagery (Ben- Dor, 2002; Selige et al. , 2006; Gomez et al. 2008b; Stevens et al. 2008; Stevens et al. , 2010; Schwanghart and Jarmer 2011; Bartholomeus et al. , 2011). And few studies have studied satellite hyperspectral data (Gomez et al. 2008a and Peng Lu et al. 2013). Gomez et al. (2008a) have only identified the organic carbon contents of the soil using Hyperion data. Peng Lu et al. (2013) mapped the variation in concentrations of phosphorus (P), the soil organic carbon (SOC), the cation exchange capacity (CEC) and the values of the potential hydrogen (PH) using Hyperion data.
2. Materials and methods
2.1. The study area
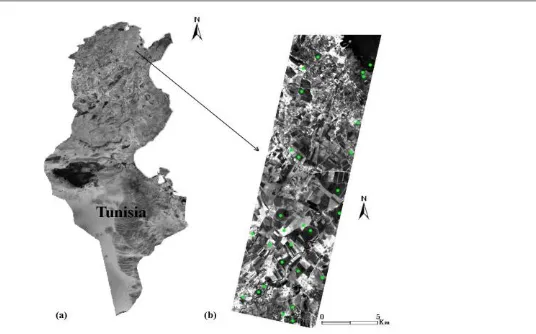
The study area is located in the Ben Arous region in the North East of Tunisia (36°45'N to 36°32’N and 10° 09' E to 10° 01' E), 20 km east of Tunis, Tunisia (Figure 1). This 210 km² area is mainly rural (>90%), correspond to the whole Hyperion image. The elevation given by the Digital Elevation Model ranges from 28 to 115 m. It is mainly devoted to the cultivation of vines, olives, cereals, apples and pears. It has a semi-arid climate, characterized by mild temperatures, sometimes cold in the winter and hot in the summer. The average temperatures in summer and winter are respectively 12,5 °C and 28 °C. Mean annual precipitation in this region is only 450 mm, while evaporation potential reaches 208 mm in summer. The main soil types are Regosols, Rendzinas, Calcosol and Vertisol.
2.2. Physico-chemical analysis
Figure 1. a) Location of the study area in Tunisia, b) the HYPERION image (band B12: 467.52 nm) with locations of the 124 soil samples collected (green points).
Each green points represents location of the 9 soil samples.
For this purpose, All samples were sieved and dried before being transported to the laboratory for classical physico-chemical analyses. The clay concentrations were measured by a laser grain size analysis (Agrawal et al. 1991). The contents of total calcium carbonate (CaCO3) were determined by the method of Bernard calcimeter (Baize and Jabiol, 1995).
Table 1. Summary statistics of the measured soils properties for the 124 soils samples collected in the study area.
Soil properties Minimum (g/kg) Maximum (g/kg) Mean (g/kg) standard deviation (g/kg) Coefficient of variation (%) Inter-quartile distance IQ (g/kg)
clay 55 342 218 79 36 125
CaCO3 49 450 248 115 46 171
2.3. Hyperion hyperspectral data
The Hyperion sensor onboard of the EO-1 satellite measures the radiation from 400 to 2500 nm with 242 spectral bands, about 10 nm spectral resolution and 30 m spatial resolution. The Hyperion image swath is 7.6 km. However, the signal to noise ratio (SNR) is low (~50:1). A detailed description of Hyperion characteristics, operations and applications can be found in Folkman et al. (2001).
This study has been realised on an HYPERION level L1Gst scene that is an HYPERION level L0R (raw product) along with radiometrically corrected and geometric systematic terrain corrected. The data image (L1Gst) is ortho-corrected using digital elevation models (DEM) to correct parallax error due to local topographic relief (USGS, 2006). The cloud-free image has been acquired on June 24 2004 at 09:45 UT. This scene is georeferenced in the UTM zone 32N projection and for the WGS-84 ellipsoid. To derive surface reflectance from the radiance data, the radiance data must be corrected for solar irradiance and atmospheric effects such as two-way transmission, multiple scattering, and path radiance. We used ENVI 4.7 (ENvironment for VIsualizing image software) to correct radiometric and atmospheric effect.
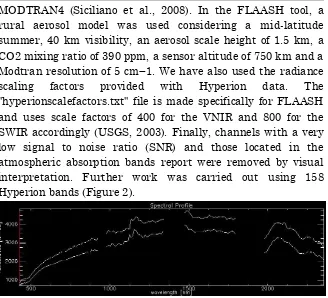
MODTRAN4 (Siciliano et al., 2008). In the FLAASH tool, a rural aerosol model was used considering a mid-latitude summer, 40 km visibility, an aerosol scale height of 1.5 km, a CO2 mixing ratio of 390 ppm, a sensor altitude of 750 km and a Modtran resolution of 5 cm−1. We have also used the radiance scaling factors provided with Hyperion data. The "hyperionscalefactors.txt" file is made specifically for FLAASH and uses scale factors of 400 for the VNIR and 800 for the SWIR accordingly (USGS, 2003). Finally, channels with a very low signal to noise ratio (SNR) and those located in the atmospheric absorption bands report were removed by visual interpretation. Further work was carried out using 158 Hyperion bands (Figure 2).
Figure 2. Plot of the Hyperion spectrum (158 spectral bands) of the soil.
When the image was acquired (24 June 2004), the majority of the surface was covered with bare soil (127 km2). A mask was used to hide the green and dry vegetation in order to focus on the classification of soil types. This mask was created in two steps:
2) Secondly, the absorption band centered at 2100 nm has been designed to hide dry vegetation (the value of reflectance 0.39 was selected) (Madeira et al, 2007).
2.4. Method of least squares regression to partial (PLSR) The partial least square regression (PLSR) (Tenenhaus 1998) is a regression technique widely used in chemometrics and quantitative analysis of spectral data (e.g. Viscarra Rossel et al., 2006). It is adapted to construct predictive models when there are many predictor variables that are highly collinear (Peng Lu et al. 2013). The PLSR with the test set validation procedure was used in this work for the prediction of levels of clay and CaCO3 using Hyperion data.
The general concept of PLSR is to extract the orthogonal or latent predictor variables, accounting for the maximum amount of the variation of the Y-variables. The PLSR model is developed from a training set of N observations (the number of spectra in the calibration dataset) with K X-variables (the number of wavelengths in the spectra) and M Y-variables (the number of soil properties). These training data form the two matrices X and Y of dimensions ( ) and ( ), respectively. As with all of the factorial methods, the main principles of PLSR are the following: i) to locate a subspace of the spectral space on which the spectra are projected, yielding a matrix of N scores ); and ii) to perform a linear regression between T and Y.
Table 2. Summary statistics of the measured soils properties for the 34 soils samples of validation.
Soil properties
Minimum (g/kg)
Maximum (g/kg)
Mean (g/kg)
standard deviation (g/kg)
Coefficient of variation (%)
clay 55 342 197 83 42
CaCO3 49 450 269 122 46
Moreover, the performance of each of these prediction models have been studied by comparing the predicted levels to the physico-chemical analysis.
The performance of the prediction was evaluated by the coefficient of correlation (R²cal) of the predicted against the measured values and the root mean square errors of calibration (RMSEC). Moreover the correlation coefficient of validation (R²val) and the root mean square errors of the prediction in the validation set (RMSEP) were also measured. The ratio of performance to interquartile (RPIQ), which is the ratio of the interquartile (IQ=Q3-Q1) to the RMSEP recently proposed to represent the spread of the population (Bellon Maurel et al., 2010) was also used.
3. Results
3.1 PLSR model calibration and validation results procedure
In this study, the spectra of the visible and the near infrared (Vis-NIR) extracted from the Hyperion image on location of the soil samples, were used to build predictive models based on PLSR. The PLSR with test set validation establishes the relationship between the spectra of the Hyperion image and the reference data obtained by chemical analysis of clay and calcium carbonate (CaCO3) content.
the number resulting in the minimum RMSEP (Viscarra Rossel et al., 2006). In this work, the calibration used three latent variables. Further details on the methodology and calibration can be found in Viscarra Rossel et al. (2008).
Table 3 and figure 3 describes the ability of the reflectance spectrometry (Vis-NIR) to predict the levels of soil properties. The table 3 includes the coefficient of correlation (R²cal) and the root mean square errors of calibration (RMSEC) values. The R² of each soil parameters in the calibration set were higher than those in the validation set. As well the RMSEC of each soil parameters in the calibration set were lower than those in the validation set (Table 3). For instance, R2
and RMSEC of CaCO3 in the calibration set reached 0.89 and 36.12, whereas in the validation set, R2 reduced to 0.79 and RMSEP increased to 56.25.
Scatter plots of the laboratory measured values versus spectra predicted values for each soil parameter were shown in figure 3. The figure 3 includes the correlation coefficient of validation (R²val), the root mean square errors of the prediction in the validation set (RMSEP) and the ratio of performance to interquartile (RPIQ) values. The R2 and RMSEP values were
listed for the samples of the validation set.
The PLSR model prediction of clay contents obtained from the Hyperion spectra is accurate, with (R2val) value of
0.71 and with the RPIQ respectively equal to 2.65 (Figure 3). Thus, the model for predicting the concentration of calcium carbonate (CaCO3) obtained from the Hyperion data provided correct results with (R2val) = 0.79 and the value of the RPIQ
Table 3. Results of the model calibration and validation for soil parameters using partial least squares regression to partial (PLSR) method.
Soil properties Calibration Validation
R 2 RMSEC R 2 RMSEP RPIQ
Clay 0.92 20.12 0.71 47.02 2.65
CaCO3 0.89 36.12 0.79 56.25 3.04
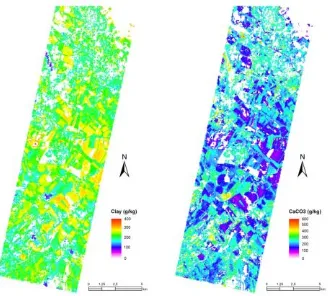
3.2 Soil properties Mapping from Hyperion data
Figure 3. Plots of measured against spectra-predicted values for both the calibration (blue) and validation (red) set for each parameters, using PLSR and Hyperion spectra of the 124 soil samples location. The Rval2 and RPIQ of the models were given for the samples of the test set.
High CaCO3 contents (mean of 270 g/kg) correspond to the soils developed from calcareous sediments and limestones. Low CaCO3 contents (means of 140 g/kg) corresponded to the soils characterized by carbonate leaching due to pedogenetic processes and by recent alluvial deposits from acidic materials. The lowest clay content corresponded to the soils developed from loamy sand deposits (mean of 160 g/kg). The predicted clay content increased in soils developed over clays or old alluvial deposits (means of 250 g/kg). The more away we get from the upstream, the more the clay content increases. Clay distribution shows a longitudinal evolution of the upstream to the downstream due to the alluvium (Figure 4). This variation is caused by slope deposits. Thus, the results obtained were consistent with the soil knowledge of the studied area and field observations. Accordingly, the use of Hyperion images property would give the mapping of soil properties in large areas and assess the risk of soil erosion.
4. Discussion
Our local soil property prediction models, built from Hyperion Vis-NIR spectra using the 124 soil samples, allowed the estimation of clay and CaCO3 content of soil with respect to common quality indicators (Figure 3).
predicted properties are consistent with those of the observed properties.
However, the spatial resolution of 30m can lead to study mixed surface (soil mixed with vegetation, road, rocks…). So the remotely spectra corresponding to these mixed surfaces contain a mixture of information about the surface components. The mixture of information in the spectra may leads to hide spectral features of clay and CaCO3. Diverse surface conditions including partially vegetated surfaces should be considered and treated to increase the surface of key soil properties mapping. A first way could be to use source separation methods as shown by Ouerghemmi et al. (2011).
5. Conclusions
In this study, to the best knowledge of the authors, we used for the first time Hyperion hyperspectral satellite data for the prediction of clay and calcium carbonate (CaCO3) content in the multivariate regression model PLSR. This approach based on Vis-NIR hyperspectral remote sensing image shows the theoretical potential of the Hyperion image for digital soil mapping. The results of the PLSR obtained in this study are encouraging. Furthermore, the use of a wide range of soil samples may be an improvement in mapping precision of soil properties. Thus, the acquisition of hyperspectral data at a higher spatial and spectral resolution is needed to reduce the impact of mixed pixels and improve the accuracy of thematic maps. The development of Vis-NIR hyperspectral sensors which are planned to be launched on board satellites within the next two years, such as PRISMA and EnMap, will extend the use of Vis-NIR hyperspectral imaging data in Digital Soil Mapping.
bases of information systems (GIS) to study the vulnerability of soils to water erosion.
Acknowledgements
We thank the Laboratory Georessoures, the Water researches and Technologies Centre (CERTE, Tunisia), the UMR LISAH (Laboratoire d'étude des Interactions Sol Agrosystème Hydrosystème, France), and the CESBIO (Centre d'Etudes Spatiales de la Biosphère, France) for material assistance and guidance that provided for the completion of this work.
REFERENCES
Agrawal, Y.C., McCave, I.N., Riley, J.B., 1991. Laser diffraction size analysis. In: Principles, methods and applications of particle size analysis , pp. 119-128. Cambridge University Press, New York.
Ben-Dor, E., 2002. Quantitative remote sensing of soil properties. Advances in Agronomy 75, 173-243.
Ben-Dor, E., Chabrillat, S., Demattê, J.A.M., Taylor, G.R., Hill, J., Whiting, M.L., Sommer, S., 2009. Using imaging spectroscopy to study soil properties. Remote Sensing of Environment 113 (Supplement 1), 38-55.
Bellon-Maurel, V., Fernandez-Ahumada, E., Palagos, B., Roger, J. M., McBratney, A., 2010. Critical review of chemo-metric indicators commonly used for assessing the quality of the prediction of soil attributes by NIR spectroscopy. TrAC Trends in Analytical Chemistry 29 (9), 1073-1081.
Baize, D., Jabiol, B., 1995. Guide pour la description des sols. Paris, INRA Edition.
agricultural fields with imaging spectroscopy. International Journal of Applied Earth Observation and Geoinformation 13, 81-88.
Chang, C.-W., Laird, D.A., Mausbach, M.J., Hurburgh Jr., C.R., 2001. Near-infrared reflectance spectroscopy-principal components regression analysis of soil properties. Soil Science Society of America Journal 65, 480–490.
Chang, C.W., Laird, D.A., 2002. Near-infrared reflectance spectroscopic analysis of soil C and N. Soil Science 167 (2), 110-116.
Folkman, M., Pearlman, J., liao, L. and Jarecke, P., 2001. EO1/Hyperion hyperspectral imager design, development, characterization and calibration. In Hyperspectral Remote Sensing of the Land and Atmosphere, Vol. 4151, pp. 40–51 (Bellingham: SPIE Proc., International Society for Optical Engineering (SPIE)).
Gomez, C., Lagacherie, P., Bacha. S., 2012a. Using Vis-NIR hyperspectral data to map topsoil properties over bare soils in the Cap Bon region, Tunisia. Digital Soil Assessments and Beyond: Proceedings of the 5th Global Workshop on Digital Soil Mapping 2012, Sydney, Australia, 387-392.
Gomez, C., Lagacherie, P., Coulouma, G., 2008b. Continuum removal versus PLSR method for clay and calcium carbonate content estimation from laboratory and airborne hyperspectral measurements. Geoderma 148 (2), 141-148.
Gomez, C., Lagacherie, P., Guillaume, C., 2012b. Regional predictions of eight common soil properties and their spatial structures from hyperspectral Vis–NIR data. Geoderma 190, 176-185.
sensing and field VIS–NIR spectroscopy: an Australian case study. Geoderma 146, 403-411.
Lagacherie, P., Bailly, J.S., Monestiez, P., Gomez, C., 2012. Using scattered soil sensing field surveys to map soil properties over a region. An example with airborne hyperspectral imagery. European Journal of Soil Science 2012 (63), 110–119 February.
Lagacherie, P., Baret, F., Feret, J.B., Madeira Netto, J., Robbez-Masson, J.M., 2008. Estimation of soil clay and calcium carbonate using laboratory, field and airborne hyperspectral measurements. Remote Sensing of Environment 112 (3), 825–835.
Lagacherie, P., Gomez, C. 2014. What can Global Soil Map expect from Vis-NIR hyperspectral imagery in the near future? In: Global Soil Map: Basis of the global spatial soil information system, Publisher: CRC Press, Editors: Dominique Arrouays, Neil McKenzie, Jon Hempel, Anne Richer de Forges, Alex B. McBratney, 387-392.
Le Bissonnais, Y., 1996. Aggregate stability and assessment of crustability and erodibility: 1. Theory and methodology. European Journal of Soil Science 47,425-437.
Madeira Netto, J.S.R., Robbez-Masson, J.M., Martins, E., 2007. Visible–NIR hyperspectral imagery for discriminating soil types in the La Peyne watershed (France). In: Lagacherie, P., Mc Bratney, A.B., Voltz, M. (Eds.), Digital Soil Mapping: An Introductory Perspective. Elsevier.
Nanni, M.R., Demattê, J.A.M., 2006. Spectral reflectance methodology in comparison to traditional soil analysis. Soil Science Society of America Journal 70, 393-407. Ouerghemmi, W., Gomez, C. Nacer, S., Lagacherie, P., 2011.
Lu, P., Wang, L., Niu, Z., Li, L., Zhang, W., 2013. Prediction of soil properties using laboratory VIS–NIR spectroscopy and Hyperion imagery. Journal of Geochemical Exploration 132 (2013), 26–33.
Schwanghart, W., Jarmer, T., 2011. Linking spatial patterns of soil organic carbon to topography a case study from south-eastern Spain. Geomorphology 126, 252-263. Selige, T., Böhner, J., Schmidhalter, U., 2006. High resolution
topsoil mapping using hyperspectral image and field data in multivariate regression modeling procedures. Geoderma 136, 235–244.
Siciliano, D., Wasson, K., Potts, D.C., Olsen, R.C., 2008. Evaluating hyperspectral imaging of wetland vegetation as a tool for detecting estuarine nutrient enrichment. Remote Sensing of Environment 112, 4020-4033.
Stevens, A., Udelhoven, T., Denis, A., Tychon, B., Lioy, R., Hoffmann, L., Wesemael, B., 2010. Measuring soil organic carbon in croplands at regional scale using airborne imaging spectroscopy. Geoderma 158, 1-2. Stevens, A., Van Wesemael, B., Bartholomeus, H., Rosillon, D.,
Tychon, B., Ben-Dor, E., 2008. Laboratory, field and airborne spectroscopy for monitoring organic carbon content in agricultural soils. Geoderma 144, 395-404. Tenenhaus, M., 1998. La régression PLS. Editions Technip,
Paris. 254 pp.
USGS (United States Geological Survey), April 2006. HYPERION level 1GST (L1Gst) product output files data format control book (DFCB), Version 1.0.
USGS (United States Geological Survey), July 2003. Earth observing-1 user guide, Version 2.3.
Viscarra Rossel, R.A., 2008. ParLeS: software for chemometric analysis of spectroscopic data. Chemometrics and Intelligent Laboratory Systems 90, 72-83.