Electronic Thesis and Dissertation Repository
7-24-2017 12:00 AM
Individual Differences in the Allocation of Visual Attention during
Individual Differences in the Allocation of Visual Attention during
Navigation
Navigation
Mikayla Keller
The University of Western Ontario Supervisor
Dr. Jennifer E. Sutton
The University of Western Ontario
Graduate Program in Psychology
A thesis submitted in partial fulfillment of the requirements for the degree in Master of Science © Mikayla Keller 2017
Follow this and additional works at: https://ir.lib.uwo.ca/etd
Part of the Cognition and Perception Commons, and the Cognitive Psychology Commons
Recommended Citation Recommended Citation
Keller, Mikayla, "Individual Differences in the Allocation of Visual Attention during Navigation" (2017). Electronic Thesis and Dissertation Repository. 4693.
https://ir.lib.uwo.ca/etd/4693
This Dissertation/Thesis is brought to you for free and open access by Scholarship@Western. It has been accepted for inclusion in Electronic Thesis and Dissertation Repository by an authorized administrator of
i
There are large individual differences in the ability to create an accurate mental representation (i.e., a cognitive map) of a novel environment, yet the factors underlying cognitive map accuracy remain unclear. Given the roles that landmarks
and cognitive map accuracy play in successful navigation, the current study examined whether differences in the landmarks that individuals look at while navigating are related to differences in cognitive map accuracy. Participants completed a battery of spatial tests: some that assessed spatial skills prior to a navigation task, and others that tested memory for the environment following exploration of a virtual world. Results indicated that individuals with inaccurate
maps had weak perspective-taking abilities, struggled to create shortcuts, and remembered fewer landmarks despite having looked at target buildings and objects in the environment for the same duration as individuals with accurate cognitive maps. These findings suggest that memory capabilities underlie differences in cognitive map accuracy.
Keywords
ii
The completion of this thesis would not have been possible without the many people that have supported me.
Thank you to my advisor, Dr. Jennifer Sutton, for her continuous encouragement, praise, inspiration, and support. Her guidance has been invaluable to the completion of this thesis, and without her enthusiasm and the opportunity to get involved in this research I would not be where I am today.
I would also like to thank Chantelle Cocquyt for her incredible work as a research assistant on this project. Her attention to detail and commitment to the project is greatly appreciated.
I am grateful to have had the opportunity to work with all past and present members of the Spatial Cognition Laboratory. Thank you for your support and feedback on presentation rehearsals.
Thank you to Dr. Marc Joanisse for his expertise and being of assistance when I had questions in regards to retrofitting our existing eye tracking setup for dynamic eye tracking.
Thanks to SR Research Ltd. for their dynamic eye tracking beta software and technical support.
iii
Abstract. ………...…i
Acknowledgements. ………...…ii
Table of Contents. ………...iii
List of Tables. ………..…..iv
List of Figures. ………..…..v
List of Appendices. ………..………..…vi
Introduction. ………..………..……1
Method. ……….…11
Participants. ……….……..…11
Materials and Procedure. ………..11
Analysis of Eye Movement Data. ……….………17
Statistical Analyses. ………..…18
Results. ……….….…19
Full Sample. ……….….19
Participant Classification. ……….……22
Comparisons of Individuals with Accurate and Inaccurate Cognitive Maps. ...23
Discussion. ………...………….…32
References. ………....……40
Appendix A: Ethics Approval. ……….……….………44
iv
v
Figure 1: Silcton layout. ... 15
Figure 2: Participant classification. ... 23
Figure 3: Composite cognitive map error scores. ... 25
Figure 4: Performance on assessments of spatial ability and gaming frequency. ... 26
Figure 5: Attention to Silcton item categories. ... 29
vi
Introduction
Navigation is a task that is central to the lives of humans and animals. It is the way in which individuals find their way around, whether it is for the purpose of travelling to school, finding food, or making it to work on time. One way that individuals find their way around is by using visual landmarks. Landmarks can generally be defined as a feature of the environment that serves as a navigational aid, either in understanding the location of oneself in an environment, assisting in finding one’s way to a goal destination, or identifying the location of other landmarks through association (e.g., Gallistel, 1990; Golledge, 1999; Presson & Montello, 1988; Siegel & White, 1975; Sorrows & Hirtle, 1999). Individuals can think about landmarks and other objects around them in one of two ways. The first, known as an egocentric reference system, involves developing knowledge of the locations of landmarks relative to one’s own position. An egocentric reference system leads to the development of route knowledge by linking actions to landmarks, such as turn left at the gas station and right at the library (Aguirre & D’Esposito, 1999; Gallistel, 1990). On the other hand, a strong allocentric reference system involves a good understanding of the relationship between landmarks (Aguirre & D’Esposito, 1999; Gallistel, 1990). The allocentric reference system leads to a richer understanding of the layout of the environment, resulting in a mental representation similar to a map or a cognitive map (Gallistel, 1990).
include landmarks, roads, and other objects. Unlike route knowledge, a cognitive map facilitates navigation because it provides a global representation of the environment, enabling an individual to solve various navigation problems, such as identifying one’s current location, identifying a goal destination, and judging distances and directions to and from locations. Having an accurate cognitive map also allows an individual to take novel shortcuts and detour routes (O’Keefe & Nadel, 1978; Tolman, 1948; Tolman et al., 1946). For instance, Tolman (1948) found evidence of cognitive maps in rats after
Two theories attempt to explain how people develop a cognitive map during direct exposure to an unfamiliar environment. Siegel and White (1975) proposed a stage-like framework and suggested that individuals initially acquire identity information about the landmarks in the environment, such as their names and features. In the next stage, route information is acquired by chaining landmarks together. In the third and final stage of the framework, cognitive map knowledge (also sometimes referred to as survey knowledge), such as the locations of and distances between landmarks, is learned. In order to reach the third stage, the individual routes from the second stage must be scaled and interrelated to understand how they connect to each other and form a global
environment, and increased exposure to the environment could result in more accurate knowledge for some people but not others. Both frameworks highlight the potential for individual differences in the ability to acquire spatial knowledge of the environment.
Individual differences in cognitive map accuracy were confirmed in a study conducted by Ishikawa and Montello (2006). In the study, researchers drove participants on two different routes in an unfamiliar area once per week for 10 weeks. Participants were instructed to pay attention to specific landmarks on these routes. Beginning in the fourth week, participants were also exposed to a connecting route. Following each driving session, a battery of spatial tasks was administered to determine whether participants integrated the routes into a single representation. The tasks included a pointing task where participants were required to estimate the direction from one
10 weeks. The results indicated that forming an accurate cognitive map was easy for some people yet quite difficult for others, supporting the existence of individual differences in cognitive map accuracy.
More recently, Weisberg et al. (2014) replicated the finding of individual differences in cognitive map formation using a desktop non-immersive virtual
environment (Silcton) rather than a real-world environment. Participants traversed two non-overlapping main routes and two connecting routes in Silcton. While exploring these four routes, participants were instructed to remember the names and locations of eight target buildings. After traversing the four routes, participants completed two tasks that assessed their memory of the environment including a direction estimation task and a map-building task resembling those used by Ishikawa and Montello (2006). For each trial in the direction estimation task, participants were placed back in the environment
standing at a particular landmark and were required to estimate the direction of a second landmark. Trials were divided into within-route and between-route trials. Within-route trials involved estimating the direction between two buildings on the same route,
providing a measure of knowledge of the directions of landmarks along a path, indicating route knowledge. Between-route trials involved estimating the direction between two buildings on different routes requiring an ability to integrate the four separate routes into a single representation, indicating cognitive map knowledge.
trials, and some participants showed poor performance on both within-route and between-route trials. Few participants showed a pattern of poor performance on within-between-route trials and good performance on between-route trials, which is consistent with Siegel and White’s (1975) theory that route knowledge must be acquired before cognitive map knowledge. Thus, when using a virtual environment, Weisberg et al.’s results were similar to Ishikawa and Montello’s indicating that there was significant variation among individuals in the ability to form an accurate cognitive map of a novel environment.
In addition to differences in the ability to create a cognitive map, non-spatial information about landmarks seems to be difficult for some individuals to remember. When performing the direction estimation task, some participants performed poorly even when the buildings they were asked to point to were on the same route in plain view (Weisberg et al., 2014). That is, some people could not estimate the direction of a building that could be clearly seen. In a subsequent study, Weisberg et al. (2016) noted that individuals with inaccurate cognitive maps also remembered fewer building names than participants with more accurate maps. Together, these findings suggest that poor cognitive map accuracy is associated with weak memory for non-spatial information about landmarks. It could be that some individuals have trouble remembering the
It is possible that, in addition to individual differences in cognitive map accuracy, there are individual differences in the features of the environment that individuals look at. One way to determine what people look at while navigating is to use a dynamic eye tracking technique. Even though eye tracking in spatial cognition research has mostly
been employed in small-scale tasks, such as the mental rotation task (see Nazareth, Odean, & Pruden, 2017 for an overview), there are a few studies where dynamic eye tracking was used in conjunction with virtual environments. For instance, Andersen,
Dahmani, Konishi, and Bohbot (2012) investigated sex differences in landmark use during navigation in a maze environment by manipulating the number of landmarks available and measuring looking time to the landmarks. They found that women looked at landmarks more than men and showed poorer navigation performance when fewer
landmarks were available. The sex difference in navigation performance, however, disappeared when more landmarks were present in the environment, highlighting
differences in looking times to landmarks and the role that landmarks play in navigation ability.
most direct route to a goal location, significantly decreased. Thus, the landmarks that individuals fixated on seemed to be encoded into memory and useful for subsequent navigation. Fixation patterns also revealed that informative landmarks, like landmarks at decision points (i.e., intersections), were preferentially selected to look at over landmarks that provided less information. The authors concluded that eye fixations on landmarks during navigation are indicative of encoded information.
looking at landmarks for forming an accurate cognitive map during navigation in a realistic virtual environment remains unclear.
In order to investigate the cognitive processes underlying individual differences in cognitive map accuracy, the current study investigated whether there are individual differences in where visual attention is allocated while navigating. Specifically of interest was whether individuals who form accurate cognitive maps of a novel virtual
Participants in the current study freely explored Silcton, meaning they could choose where to travel in the environment. This is in contrast to methods used in work by Ishikawa and Montello (2006), Weisberg et al. (2014), and Weisberg and Newcombe (2016). In these studies, participants were restricted to specific routes during the
exploration process. Recent research by Sutton, Vollebregt, and Grogan (2016) indicates that performance on pointing and map-building tasks was significantly better in a free exploration paradigm relative to learning via specific routes. It is believed that free exploration allows an individual to experience more perspectives of objects in the environment and test hypotheses regarding the location of landmarks, facilitating the creation of a more accurate representation of the environment.
It was predicted that self-ratings of spatial ability would be associated with performance on tasks assessing memory for Silcton, and that perspective-taking ability would be associated with cognitive map accuracy. It was also predicted that performance on tasks that assessed memory for Silcton would be associated with each other. A number of participants were identified as being among participants with the most accurate
Method
Participants
Eighty-five participants (43 male and 42 female) were recruited for the study via posters displayed on the University of Western Ontario campus and a listing on the Department of Psychology research participation pool website. For ease of eye-tracking data collection and quality, only participants who had normal or corrected-to-normal vision with contact lenses were permitted to participate in the study. Due to technical errors or complications with some participants’ contact lenses, data for five participants were not reliable (due to a periodic loss of eye tracking signal), thus the final sample consisted of data from 80 participants (40 male and 40 female; age M = 23.46 years, SD = 5.49). Some participants received $15 in compensation for participating in the study and others received partial course credit. The study was approved by the University of Western Ontario Non-Medical Research Ethics Board.
Materials and Procedure
1000Hz sampling rate) which sat approximately 70 centimeters in front of the participant and was run on an ASUS computer operating Windows 10 64-bit with an AMD Athlon 64 X2 Dual Core 6000+ 3.15 GHz Processor, a Nvidia GeForce GTX 660 Graphics card, and a mouse and keyboard. Each experimental session lasted approximately 1.5 hours.
Demographic questionnaire. Participants completed an 8-item paper-based
demographic questionnaire. On this questionnaire they provided information on age, gender, current year in university, whether they moved from a different city to attend university, and their modes of transportation (ride in car, drive car, take city bus, ride bicycle, and/or walk) including the most frequent mode of transportation. Additionally, they responded to questions regarding the navigation aids they used (car navigation system with map display, phone navigation system with map display, car navigation system with audio directions, phone navigation system with audio directions, paper map, I don’t use navigation aids, ask someone for directions, and/or other), whether they had a drivers licence, how frequently they played video games, and types of video games played. Video game playing frequency was classified on a 5-point Likert scale ranging from zero (Less than once per week) to four (More than 6 times per week).
Santa Barbara Sense of Direction Scale. The next task was to complete the Santa
Barbara Sense of Direction Scale (SBSOD; Hegarty, Richardson, Montello, Lovelace, & Subbiah, 2002). Participants responded to the 15-item assessment by rating their own spatial abilities on a 7-point Likert scale. The scale consisted of items such as “I am very good at reading maps,” and “I very easily get lost in a new city.”
Spatial Orientation Test. Next, the Spatial Orientation Test (SOT) (Hegarty &
perspective-taking ability using a static array of objects that was visible on the page for each item. For each item, participants were instructed to assume a heading direction within the object array (e.g., “Imagine you are standing at the car and facing the traffic light.”). Then, they were instructed to indicate the direction of a third object in the array (“Point to the stop sign.”) by rotating their imagined orientation to match a given line on a circle and
drawing a line from the centre of the circle to its perimeter. This drawn line indicated the direction of the third object. An error score was calculated for each item based on the average degrees between the correct bearing and the participants’ response bearing for all items.
Direction estimation practice task. As practice for a later direction estimation
task, participants completed a direction estimate practice task using buildings from the University of Western Ontario campus. Participants were shown a circle in Microsoft Powerpoint with an image of the building they were to imagine that they were standing near located in the centre of the circle and an image of the building that they were to imagine that they were facing located at the top of the circle. Then, they were instructed to place images of three other buildings on the perimeter of the circle in the appropriate direction with the given heading direction in mind. If a participant incorrectly completed the task or did not understand, further explanation and the correct answers were provided until they confirmed that they understood.
Silcton exploration task. Prior to Silcton (Weisberg et al., 2014) exploration, each
participant’s eye movements were calibrated. This was completed according to
initial calibration trial by looking at dots on the screen, which moved to various locations. A second calibration trial was used to validate the results of the first. Immediately after calibration, continuous eye tracking and screen recording began in order to later produce a video of the participant’s view while traveling in Silcton with eye tracking data overlaid. Eye movements were sampled continuously at a rate of 2000 Hz for the duration of
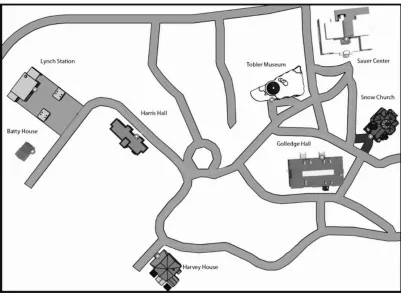
Figure 1: Silcton layout.
Locations of the 8 target buildings in Silcton. Note that Silcton consists of many more buildings and objects than the 8 target buildings shown here. Image adapted from Weisberg et al. (2014).
Silcton landmark recognition task. After the exploration period, participants
completed a recognition task where randomized images of buildings and objects from Silcton and foils were presented in random order. In total, there were 32 trials: 11
buildings from Silcton, 5 objects from Silcton, and 16 foils. Foils consisted of items that would be typically found in a virtual town but were absent from Silcton (e.g., a mailbox, a fountain, other buildings that looked similar to those in Silcton). Each item remained on the screen until the participant made a response (indicating either yes this was a
respond, but participants were instructed to press either key as quickly and as accurately
as possible. The next item appeared immediately following a response. Stimuli were
presented using E-Prime 2.0 software (Psychology Software Tools, Pittsburgh, PA). Data
were analyzed as a discrimination index (Pr) calculated as the proportion of hits minus
false alarms, as recommended by Snodgrass and Corwin (1988).
Direction estimation task.Next, participants completed a direction estimation
task (Weisberg et al., 2014) using the 8 target buildings from Silcton. This task was
similar to the direction estimation practice task. Participants were shown a circle on the
screen with a heading direction (e.g., “Imagine you are standing at Batty diamond facing
Lynch diamond.”). Then, participants were instructed to place the labels of the eight
buildings around the perimeter of the circle in their appropriate directions. There were 8
trials, where each trial had a different pair of buildings with each building serving as the
standing point once and the facing direction once.
Silcton map building task.Following completion of the direction estimation task,
participants were presented with a map-building task (Weisberg et al., 2014). Participants
were shown a blank two-dimensional box along with overhead bird’s-eye images of the
eight Silcton buildings. Participants were asked to place the buildings in their appropriate
locations within the box. Accuracy was calculated automatically through the Silcton
software via a bidimensional regression procedure (Friedman & Kohler, 2003) which
resulted in an R2 value with a potential range from 0 – 1.0. The procedure compares the similarity between the map completed by the participant and a map with the buildings in
Silcton route construction task. In the final task, participants constructed 3
shortcut routes through Silcton. For each route, participants were given a starting location (e.g., Batty House) placed at the beginning of a horizontal line and an ending location (e.g., Sauer Center) placed at the end. Participants then dragged and dropped buildings onto the line to indicate which of the remaining six buildings they would encounter between the two buildings, and the order they would encounter them in, if they were to take the shortest route possible. Accuracy for both correct selection of buildings and order was scored using a point system. For each route, the number of points that participants received for each correct building was a proportion of the total number of correct buildings that completed that route. For example, if there were three buildings on the shortest possible route, participants received 0.33 points for each correct building so that the maximum number of points a participant could earn was 1.0. A fraction of a point (0.33) was deducted for each instance where extra buildings were included, buildings were missing, or if they were out of order, however the minimum possible score that could be obtained was 0.
Analysis of Eye Movement Data
Scoring practice was administered for the research assistant to ensure that scoring was as consistent as possible between scorers. Both scorers adhered to a scoring protocol. The scoring protocol for each participant involved replaying the recorded Silcton exploration file frame-by-frame and creating interest areas for each item that was fixated on. An interest area was a box that was drawn over an item (building/object) in Silcton when a participant looked at that item. The interest area was named according to the item and remained active for the duration that the participant looked at the item. When the
participant diverted their gaze from the item, the active period for the interest area ended. This process was repeated for the entirety of the exploration video. In dynamic eye tracking, fixations from which visual information can be obtained and stored in memory are believed to range from 200 - 400 ms (Salvucci & Goldberg, 2000), thus fixations under a 200 ms threshold were excluded from the analysis, consistent with other dynamic eye tracking work (Lahiri, Trewyn, Warren, & Sarkar, 2011; Munn, Stefano, & Pelz, 2008). Fixations to items in Silcton were grouped into one of four categories: Target buildings (any of the eight buildings that were marked with diamonds in Silcton), Non-target buildings (buildings other than the Non-target buildings in Silcton), Objects (items such as fire hydrants, cars, trees, and benches), and Other (the ground, sky, and items too far off in the distance that they could not be recognized).
Statistical Analyses
building accuracy score, and route construction task score. In addition, 32 participants were selected and classified as participants with the most and least accurate cognitive maps in the sample (see Participant Classification below for more detailed information). Two-tailed independent t tests were performed to evaluate differences between the participants with accurate cognitive maps and the participants with inaccurate cognitive maps on composite cognitive map error scores, the SBSOD, the SOT, video game playing frequency, the landmark recognition task, the route construction task, and time spent navigating Silcton. Then, a 4 (Silcton item type: Target buildings, Non-target buildings, Objects, Other) x 2 (Group: Accurate cognitive maps, Inaccurate cognitive maps) mixed analysis of variance (ANOVA) was conducted to determine whether looking time to Silcton item categories varied by group.
Results
Full Sample
Mode of travel reports. Twenty-nine percent of participants reported taking the
city bus as their most frequently used mode of transportation. Walking was the next most frequent mode of transportation with 21% of participants, followed by driving a car at 16%, and riding a bicycle and riding in a car both at 5%. Five percent of participants did not report their most frequent mode of transportation.
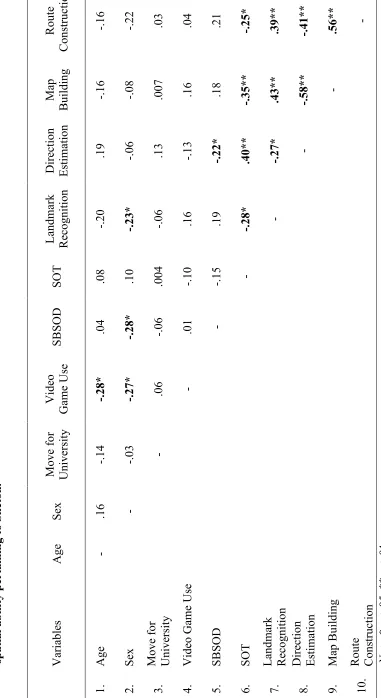
Correlation analyses. Table 1 shows two-tailed Pearson correlation coefficients
where more frequent video game use was associated with being younger. There was also a significant negative correlation between video game frequency and sex, indicating that males played video games more often than females. As can be seen in Table 1, video game frequency was not significantly associated with any other measures, particularly measures for memory of Silcton, indicating that better performance on Silcton measures was not associated with playing video games.
A significant correlation between sex and landmark recognition task performance revealed that males (M = .44, SD = 0.20) recognized more landmarks from Silcton than females (M = .35, SD = .20). Sex was also correlated with SBSOD ratings (overall M = 4.80, SD = 1.05) where higher SBSOD ratings were associated with being male (male: M = 5.09, SD = 0.97; female: M = 4.51, SD = 1.06). Self-reported ratings on the SBSOD for all participants were significantly associated with error on the direction estimation task (M = 71.94, SD = 9.81) indicating that as SBSOD ratings increased, error on the direction estimation task decreased (i.e., accuracy increased).
Tab le 1 : C or re lati on s b etw ee n age , s ex , mob il ity, vi d eo game u se , S BS O D p er for man ce , S O T p er for man ce , an d me as u re s of sp ati al ab il ity p er tai n in
g to S
il cton . V ari abl es A ge Sex M ove f or U ni ve rs it y V ide o G am e U se S BS O D SOT L andm ark Re cogni ti on D ire ct ion E st im at ion M ap Bui ldi ng Rout Cons truc 1. A ge - .16 -.14 -.28* .04 .08 -.20 .19 -.16 -.16 2. Sex - -.03 -.27* -.28* .10 -.23* -.06 -.08 -.22 3. M ove f or U ni ve rs it y - .06 -.06 .004 -.06 .13 .007 .03 4. V ide o G am e U se - .01 -.10 .16 -.13 .16 .04 5. S BS O D - -.15 .19 -.22* .18 .21 6. SOT - -.28* .40** -.35** -.25* 7. L andm ark Re cogni ti on - -.27* .43** .39** 8. D ire ct ion E st im at ion - -.58** -.41** 9. M ap Bui ldi ng - .56** 10. Rout e Cons truc ti on - Not e. * p
< .05, **
p
Participant Classification
Participants were classified according to their performance on the Silcton
assessments that specifically tested cognitive map accuracy (i.e., the direction estimation
task and the map building task). A composite cognitive map error measure was calculated
for each participant. This measure was based on the error measure obtained from
performance on the direction estimation task, as well as the map-building accuracy score,
which was converted to an error score via reverse scoring and conversion to a whole
number. The two error values were then summed to calculate a single error measure of
cognitive map accuracy. For example, a map-building score of .957586 was reverse
scored and converted to a whole number of 4.241408 by multiplying .957586 and 100
and subtracting it from 100. Then, 4.241408 was added to the participant’s direction
estimation score of 54.553564 which resulted in a rounded composite cognitive map error
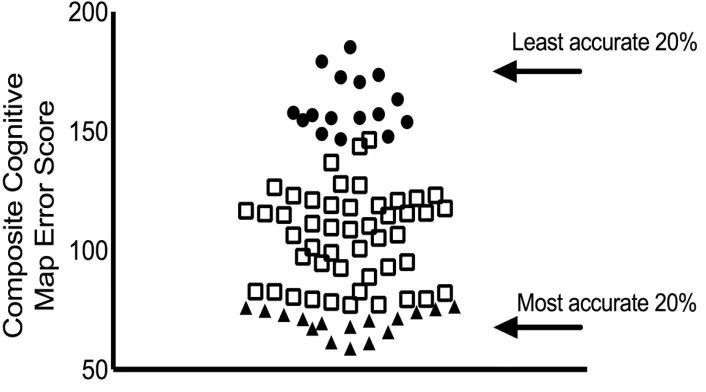
score of 58.79. Composite map error scores ranged from 58.79 to 185.23 (see Figure 2),
with higher scores indicating a less accurate cognitive map. Participants in the top 20%
(most accurate) and bottom 20% (least accurate) on the composite cognitive map error
score were identified, resulting in 16 participants in the accurate cognitive map group and
16 in the inaccurate cognitive map group. Eye tracking data were only examined for these
Figure 2: Participant classification.
Selection and classification of participants into most and least accurate cognitive map groups based on calculated cognitive map error score using performance on the direction estimation and map building tasks. Points (circles, triangles, and squares) represent individual composite cognitive map scores. Triangles represent the top 20% of
participants with the most accurate cognitive maps. Circles represent the bottom 20% of participants with the least accurate cognitive maps. Squares represent the middle 60% of participants.
Comparisons of Individuals with Accurate and Inaccurate
Cognitive Maps
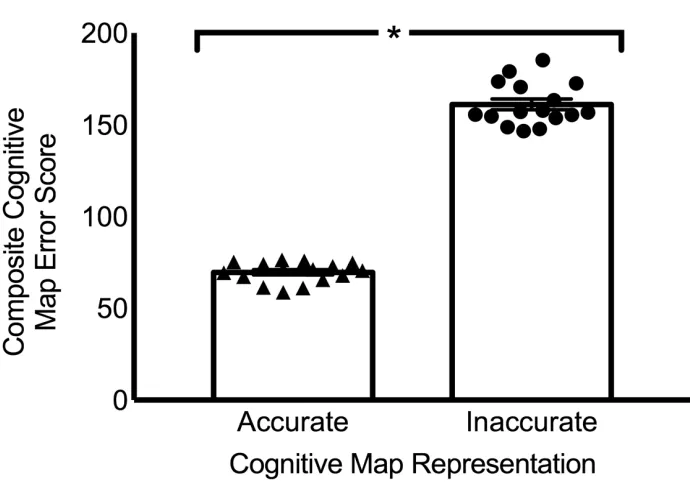
Cognitive assessments.As expected, a Levene’s corrected, F(1, 30) = 9.65, p
= -28.32, p < .001, d = -54.85. The means, standard errors, and individual scores for those with accurate and inaccurate cognitive maps are shown in Figure 3.
Reports of the most frequent mode of transportation showed a similar pattern for
both individuals with accurate cognitive maps and individuals with inaccurate cognitive
maps. Both accurate and inaccurate cognitive map groups reported taking the city bus as
their most frequent mode of transportation (accurate: 37.5%, inaccurate: 50%), followed
by walking (accurate: 31.25%, inaccurate: 18.75%), then driving a car (accurate: 18.75,
inaccurate: 12.5%), riding a bicycle (accurate: 12.5%, inaccurate: 6.25%), and riding in a
car (accurate: 0%, inaccurate: 6.25%). A Fischer’s exact Chi-square test revealed that
most frequent mode of transportation reported was not significantly associated with
group, p = .77.
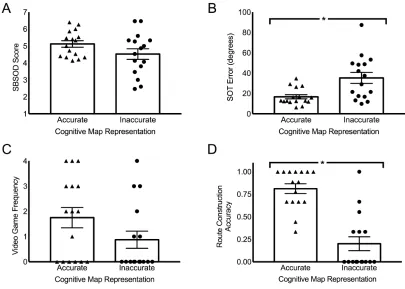
Independent two-tailed t tests were conducted to compare individuals with accurate cognitive maps to individuals with inaccurate cognitive maps on video game
frequency, SBSOD ratings, and performance on the SOT and route construction task (see
Figure 4). As can be seen in Figure 4d, route construction accuracy was significantly
better for individuals with accurate cognitive maps (M = .81, SD = .22) compared to individuals with inaccurate cognitive maps (M = .20, SD = .31), t(30) = 6.46, p < .001, d
= 12.51, indicating that individuals with accurate cognitive maps were better able to
create shortcuts through Silcton than individuals with inaccurate cognitive maps. Shown
in Figure 4a, those with inaccurate cognitive maps rated their spatial abilities on the
Figure 3: Composite cognitive map error scores.
Composite cognitive map error scores for participants selected from the original full
sample as falling in the most accurate 20% (N = 16) and least accurate 20% of cognitive
maps in the sample (N = 16). Triangles represent individuals with accurate cognitive
maps. Circles represent individuals with inaccurate cognitive maps. Error bars represent
standard error of the mean.
For the SOT (see Figure 4b), an independent t test not assuming homogenous variances,
Levene’s F(1, 30) = 13.51, p = .001, was calculated and indicated that SOT performance
was significantly better (i.e., lower error) for participants with accurate cognitive maps
(M = 16.74, SD = 8.26) than participants with inaccurate cognitive maps (M = 35.33, SD
= 21.45), t(19.36) = -3.24, p < .01, d = -6.27, indicating better small-scale
perspective-taking ability for the group with accurate cognitive map representations. Finally, video
Figure 4: Performance on assessments of spatial ability and gaming frequency.
(A) Self-ratings on the SBSOD scale for participants with accurate cognitive map
representations and participants with inaccurate cognitive map representations. (B) SOT
performance for participants in the accurate and inaccurate cognitive map groups. (C)
Video game playing frequency for participants with accurate cognitive map
representations and participants with inaccurate cognitive map representations. (D)
Performance on the route construction task for participants in the accurate and inaccurate
cognitive map groups. Triangles represent individuals with accurate cognitive map
representations. Circles represent individuals with inaccurate cognitive map
accurate cognitive maps (M = 1.75, SD = 1.61) and those with inaccurate cognitive maps
(M = .88, SD = 1.36), t(30) = 1.66, p = .11, d = 3.21.
Eye tracking data. Each participant’s looking time to each Silcton item category
was converted to a proportion based on total looking time for that participant. Participants
with accurate cognitive map representations differed from participants with inaccurate
cognitive map representations on looking times to items in Silcton in some respects but
not others. A mixed 2 (Group: accurate cognitive map, inaccurate cognitive map) x 4
(Silcton item type: target buildings, non-target buildings, objects, other) ANOVA with
Group as the between subjects factor and Silcton items as the repeated factor was
conducted on the proportion of total looking time data. The Greenhouse-Geisser
correction for F was used for all repeated measures effects. The ANOVA revealed a
significant main effect of Silcton items, F(1.29, 38.69) = 288.54, p < .001, ηp2 = .91. Bonferroni-corrected post hoc tests showed that the proportion of time spent looking at
target buildings (M = .09, SD = .04) was not significantly different than the proportion of
time spent looking at non-target buildings (M = .08, SD = .03), p = .18. The proportion of
looking time to target buildings was significantly less than looking time to objects (M
= .26, SD = .07), p < .001, and less than items in the other category (M = .57, SD = .11),
p < .001. The proportion of time spent looking at non-target buildings was also
significantly less than time spent looking at objects, p < .001, and items in the other
category, p < .001. Looking time for objects was significantly less than time spent
looking at items in the other category, p < .001. All other comparisons were not
statistically significant, ps> .05. The main effect of group was not significant, as looking
The Group x Silcton Items ANOVA on looking time data also revealed an
interaction, where the proportion of time spent looking at different categories of items in
Silcton was dependent on the whether an individual had an accurate or inaccurate
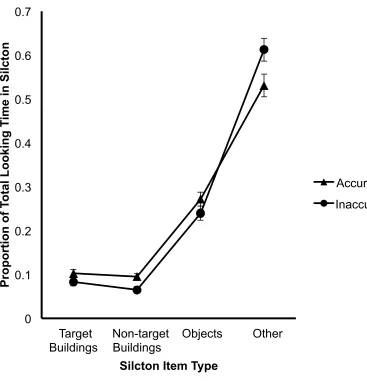
cognitive map representation, F(1.29, 38.69) = 4.09, p = .04, ηp2 = .12. Figure 5 depicts the Group x Silcton Items interaction.
A simple main effects analysis for the effect of group at each Silcton item
category was conducted to investigate which items showed differences in proportion of
looking time between those with accurate cognitive maps and those with inaccurate
cognitive maps. For target buildings, looking times to target buildings by participants
with accurate cognitive maps (M = .10, SD = .04) and participants with inaccurate
cognitive maps (M = .08, SD = .04) did not differ significantly, F(1, 30) = 2.05, p = .16,
ηp2 = .00. Looking times to non-target buildings were significantly different, indicating that those with accurate cognitive maps (M = .10, SD = .03) spent significantly more time
looking at non-target buildings than those with inaccurate cognitive maps (M = .07, SD
= .02), F(1, 30) = 8.34, p = .007, ηp2 = .25. Similar to the pattern for target buildings, looking time to objects in Silcton did not differ significantly between the accurate
cognitive map group (M = .27, SD = .07) and the inaccurate cognitive map group (M
= .24, SD = .06), F(1, 30) = 1.94, p = .17, ηp2 = .07. For Silcton items in the “other” category, the inaccurate cognitive map group (M = .61, SD = .09) looked significantly
longer at items in this category, such as the ground and the sky, than the accurate
cognitive map group (M = .53, SD = .11), F(1, 30) = 4.86, p = .04, ηp2 = .13.
Next, to investigate whether the pattern of looking times to Silcton items varied
Figure 5: Attention to Silcton item categories.
Proportion of looking time attributed to each of the four Silcton item categories for the
accurate and inaccurate cognitive map groups. Triangles represent the accurate cognitive
map group. Circles represent the inaccurate cognitive map group. Error bars represent
standard error of the mean.
different Silcton items for each group was conducted. Proportion of total looking time to
the Silcton item categories differed significantly for those with an accurate cognitive map,
F(3, 90) = 115.04, p < .001, ηp2 = .79, and those with an inaccurate cognitive map, F(3,
0 0.1 0.2 0.3 0.4 0.5 0.6 0.7 Target Buildings Non-target Buildings
Objects Other
Pr o p o rti o n o f To ta l L o o ki n g T im e in Si lc to n
Silcton Item Type
90) = 177.59, p < .001, ηp2 = .86. Bonferroni-corrected post hoc analyses on the simple main effect for the group with accurate cognitive maps revealed that they spent more time
looking at objects (M = .27, SD = .07) than target buildings (M = .10, SD = .04), p < .001.
They also spent significantly more time looking at items in the other category (M = .53,
SD = .11) compared to target buildings, p < .001 and more time looking at items in the
other category than non-target buildings (M = .09, SD = .03), p < .001. Participants with
an accurate cognitive map also spent significantly more time looking at items in the other
category than looking at objects, p < .001, but more time looking at objects than
non-target buildings, p < .001. There was no significant difference between time spent looking
at target buildings compared to non-target buildings, however, p = 1.00.
Like the group with accurate cognitive maps, the group with inaccurate cognitive
maps also spent the majority of their time looking at items in the other category (M = .61,
SD = .09). The other category had a significantly higher proportion of looking time
compared to target buildings (M = .08, SD = .04), p < .001, non-target buildings (M = .06,
SD = .02), p < .001, and objects (M = .24, SD = .06), p < .001. Similar to the pattern for
the group with accurate cognitive maps, the group with inaccurate cognitive maps spent
less time looking at target buildings compared to objects, p < .001, and non-target
buildings were also looked at significantly less than objects, p < .001. Similar to
participants with an accurate cognitive map, time spent looking at target buildings did not
significantly differ from time spent looking at non-target buildings, p = .28.
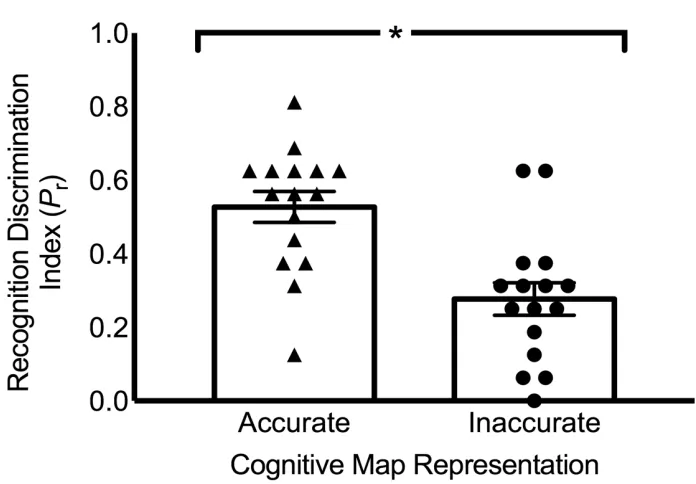
An analysis of performance on the landmark recognition task, via a two-tailed
independent t test, revealed that individuals with an accurate cognitive map (M = .53, SD
from foils than individuals with an inaccurate cognitive map (M = .27, SD = .18), t(30) = 4.08, p < .001, d = 7.91. Figure 6 shows that although there were a few participants in the accurate cognitive map group that performed poorly on the recognition task, overall, individuals with an accurate cognitive map outperformed individuals with an inaccurate cognitive map.
Finally, it is possible that individuals with an accurate cognitive map simply spent more time in Silcton than individuals with an inaccurate cognitive map, since participants determined the length of the exploration period themselves (within the 10 - 20 minute allowance). Given a violation of Levene’s test for homogeneity of variances, F(1, 30) = 4.88, p = .04, an independent t test not assuming homogenous variances was calculated and showed that exploration time for the accurate cognitive map group (M = 15.84 min, SD = 2.99 min) did not significantly differ from the inaccurate cognitive map group (M =
Figure 6: Landmark recognition task performance.
Triangles represent individuals with an accurate cognitive map. Circles represent
individuals with an inaccurate cognitive map. Error bars represent standard error of the
mean.
Discussion
The current study used dynamic eye tracking technology to measure fixations to
landmarks within a novel virtual environment during a free exploration navigation task.
The aim was to determine whether the ability to form an accurate mental representation
of a novel environment is related to differences in the allocation of visual attention.
Analyses of data from all 80 participants revealed sex differences where being younger
and being male was associated with higher video game playing frequency. There was also
a sex difference for the landmark recognition task and the SBSOD, where males
SBSOD. For the SBSOD, higher self-ratings were also associated with a more accurate
ability to estimate the directions between buildings in Silcton. In addition, performance
on the small-scale spatial perspective-taking SOT was related to performance on all tasks
that assessed memory for Silcton.
After classifying selected participants into two groups based on cognitive map
accuracy, analyses of performance on spatial assessments revealed that individuals with
an accurate cognitive map had better composite cognitive map error scores, were more
accurate in constructing shortcuts, and had better perspective-taking ability, yet both
groups had similar self-ratings of spatial abilities and levels of video game playing
frequency. During Silcton exploration, individuals with accurate and inaccurate cognitive
maps looked at to-be-remembered target buildings for similar amounts of time, yet those
with inaccurate cognitive maps correctly identified fewer items overall from Silcton than
individuals with accurate cognitive maps. This pattern of similar looking times was
repeated for objects, however, the group with accurate cognitive maps looked at
non-target buildings more than the group with inaccurate cognitive maps, and those with
inaccurate cognitive maps looked at the sky and ground more than those with accurate
cognitive maps. Both groups spent the same amount of time exploring Silcton.
In our samples of individuals with accurate and inaccurate cognitive maps,
looking times to target buildings and objects in Silcton were similar in both groups, but
different for non-target buildings and the other category. Interestingly, the groups
differed in both spatial and non-spatial memory for items in all categories, whereby
individuals with an accurate cognitive map were more accurate in distinguishing
also had better small-scale perspective-taking abilities. Thus, the current findings
resemble those of Strayer et al. (2003), where some individuals demonstrated a
significant impairment in remembering items that they had directly looked at. Strayer et
al. suggest that despite looking at the billboards while driving, the attention of drivers
who were talking on a cell phone was diverted to the concurrent phone conversation,
which produced memory interference. The fact that the current results show that
landmarks in the environment were not remembered despite having looked directly at
them, albeit without a secondary task, is a novel finding in the spatial cognition literature.
They suggest that differences in cognitive map accuracy may not be due to differences in
the landmarks that an individual looks at, but rather due to differences in general memory
encoding and/or retrieval ability. Differences such as these further downstream from
attention in information processing could affect cognitive map accuracy because an
inability to remember the locations and visual features of landmarks in the environment
would make it difficult to form a cognitive map of the environment since a cognitive map
is based on landmark information.
Navigation is known to involve working memory processes (Wolbers & Hegarty,
2010), as spatial and non-spatial landmark information needs to be updated when more
information about the environment is acquired. In the current study, information may
have passed through the attention stage, but was disrupted for individuals with inaccurate
cognitive maps at the working memory encoding and/or retrieval stage. These findings
add to mixed literature regarding the role of memory for navigation. Weisberg and
Newcombe (2016) showed that weak navigators had poor working memory (both spatial
association between cognitive map accuracy and spatial working memory ability in a
sample of teenagers. Therefore, working memory ability may be a contributing factor in
cognitive map accuracy.
It is possible that individuals with inaccurate cognitive maps experienced
information overload during the information encoding and/or retrieval stages. Navigation
is a complex task, requiring an individual to pay attention to a variety of aspects both of
one’s self and items within the environment. An individual needs to maintain a sense of
their location and update the locations of landmarks around them (Wolbers & Hegarty,
2010), information that must be stored in memory and can later be used to make
inferences when solving navigation tasks. The findings of the current study did not
support Hamid et al.’s (2010) conclusion that individuals encode the landmarks they look
at into memory, at least for individuals with inaccurate cognitive maps. This may be
because individuals with inaccurate cognitive maps remember landmarks in different,
perhaps less effective, ways. Previous research has indicated that in comparison with
individuals who perform poorly on navigation tasks, those who perform well on
navigation tasks do in fact use working memory in different ways to encode information
about the environment (Ploran, Rovira, Thompson, & Parasuraman, 2015; Wen, Ishikawa,
& Sato, 2011; 2013). For instance, in a study where people learned routes from a video
and completed memory interference tasks, good navigators used a combination of verbal
and spatial working memory to store cognitive map knowledge, while poor navigators
relied only on verbal working memory (Wen et al., 2011; 2013). In addition, Ploran et al.
(2015) showed that success in finding targets in a large-scale navigation task was
retrieval ability might be responsible for differences in cognitive map accuracy, future
work should further evaluate the relationship between working memory capacity and
performance differences between those with accurate cognitive maps and those with
inaccurate cognitive maps.
In addition to memory capabilities, good perspective-taking ability may play a
critical role in forming an accurate cognitive map. There was a significant association
between SOT performance and performance on all of the Silcton spatial measures in the
current study. The relationship was evident for the landmark recognition task, the
direction estimation task, the map building task, and the route construction task, in both
the overall sample and after participants were classified as having an accurate or
inaccurate cognitive map. Similar findings have been shown in our other work with a
different virtual environment (Sutton et al., 2014). It is possible that good
perspective-taking ability allows an individual to form a more accurate cognitive map because one
can imagine the location of landmarks in the environment from multiple viewpoints. In
theory, this ability could potentially make scaling and interrelating various segments of
the environment, a process proposed by Siegel and White (1975), easier, resulting in a
more accurate map-like representation. Since a cognitive map is orientation-independent,
visualization of the environment with good perspective-taking skills may facilitate
localizing oneself in the environment, the direction one must travel to get to a goal
destination, and visualizing the landmarks that one will encounter along the way through
the recruitment of both the egocentric and allocentric reference frames. Good
perspective-taking ability and use of both reference frames would result in superior
The way individuals with inaccurate cognitive maps distributed their looking time
in Silcton may have negatively affected their performance. Since individuals with
inaccurate cognitive maps attributed less attention to non-target buildings, they may have
consequentially received less contextual information about the environment. For instance,
non-target buildings may assist in remembering the locations of the target buildings and
aid an individual in building an accurate cognitive map. An individual may remember the
location of the target building Sauer Center by remembering that it is next to the bank (a
non-target building), which is also in close proximity to another target building known as
Snow Church. The amount of time that individuals with inaccurate cognitive maps did
not spend looking at non-target buildings seemed to be directed to items in the other
category instead. Time spent looking at items in the other category, specifically the
ground and the sky, might be considered time wasted, as these items should provide little
information in terms of cues for navigation because they lack distinguishable features that
would allow an individual to maintain a sense of their position in the environment.
Therefore, directing less looking time to potentially informative landmarks and more
looking time to uninformative features of the environment seems to significantly impair
cognitive map accuracy.
Interestingly, self-ratings on the Santa Barbara Sense of Direction scale were not
reflective of differences in cognitive map accuracy. Although, previous work has found
that SBSOD ratings are associated with performance on large-scale navigation tasks
requiring an accurate cognitive map (Hegarty et al., 2002; Kozhevnikov & Hegarty,
2001), no such association was found in the current study. While there was a relationship
relationship was not found in individuals with the most and least accurate cognitive maps.
There was considerable variation in self-reported ratings of spatial abilities in the group
with inaccurate cognitive maps. However, overall, despite their poor performance on the
spatial tasks, those with an inaccurate cognitive map still rated their spatial skills on the
SBSOD to be nearly as high as those with a highly accurate cognitive map. This finding
may highlight a lack of awareness that individuals with inaccurate cognitive maps have
of their own spatial abilities to the point that some individuals with inaccurate cognitive
maps may have an inflated sense of their navigation abilities. In comparison with
previous work with early career civil aviation pilots, a population with demonstrably
more advanced spatial abilities than the average population (Sutton et al., 2014), both
individuals with accurate and inaccurate cognitive maps in the current study rated their
spatial abilities nearly as high as pilots. Thus, some individuals with inaccurate cognitive
maps in our sample seem to have been overly confident in their perceptions of their own
spatial abilities. Alternatively, participants’ self-ratings might have been reflective of
their true abilities but the tasks used in the current study may not have accurately probed
real world performance. More research would be needed to rule out this possibility.
For assessing navigation abilities, virtual reality is a methodology with high
validity in a laboratory setting and offers significant control over what is presented to the
participant (Waller & Greenauer, 2007). Unlike most previous research that has used
simple virtual environments with dynamic eye tracking, the current study utilized a
naturalistic virtual environment. However, despite Silcton’s realistic features, the
environment lacked moving objects (such as cars, birds, and people) that would normally
sudden onsets capture attention automatically (Yantis, 1993; Yantis & Jonides, 1990). An
individuals’ spatial and non-spatial memory for landmarks would likely be more
adversely affected if, while navigating a new city and paying special attention to
landmarks attention is interrupted by a car that nearly hits the individual. To be certain,
however, more research using dynamic eye tracking and manipulating the amount of
moving stimuli in either virtual or real environments to examine the effect on spatial and
non-spatial memory is needed.
In conclusion, cognitive map accuracy appears not to be associated with the
landmarks that are looked at while exploring a new environment, but is, in part,
associated with the ability to remember elements of the landmarks that one directs visual
attention to and perspective-taking ability. The results indicated that some individuals
experience significant memory difficulties for the landmarks that they look at. While the
current study advances the field by providing evidence against the hypothesis that
differences in cognitive map accuracy have their roots in differences in attention to
landmarks, more research is required to tease apart potential differences in memory
capabilities by exploring differences that may lie further downstream in information
processing, such as whether information about landmarks is properly encoded or whether
those with inaccurate cognitive maps are able to encode landmark information but
experience trouble retrieving the information. This will further enhance our
understanding of the factors that contribute to the ability to build an accurate cognitive
map, conceivably leading to the development of interventions to improve navigation
ability for those who struggle.
References
Aguirre, G. K., & D’Esposito, M. (1999). Topographical disorientation: A synthesis and taxonomy. Brain: A Journal of Neurology, 122, 1613-1628.
Allen, G. L., Kirasic, K. C., Siegel, A. W., and Herman, J. F. (1979). Developmental issues in cognitive mapping: The selection and utilization of environmental landmarks. Child Development, 50, 1062-1070.
Andersen, N. E., Dahmani, L., Konishi, K., & Bohbot, V. D. (2012). Eye tracking, strategies, and sex differences in virtual navigation. Neurobiology of Learning and Memory, 97, 81-89.
Bennett, A. T. (1996). Do animals have cognitive maps? Journal of Experimental Biology, 199, 219-224.
Cohen, R., & Schuepfer, T. (1980). The representation of landmarks and routes. Child Development, 51, 1065-1071.
Cousins, J. H., Siegel, A. W., & Maxwell, S. E. (1983). Way finding and cognitive
mapping in large-scale environments: A test of a developmental model. Journal of Experimental Child Psychology, 35, 1-20.
Curtis, L. E., Siegel, A. W., & Furlong, N. E. (1981). Developmental differences in cognitive mapping: Configurational knowledge of familiar large-scale environments. Journal of Experimental Child Psychology, 31, 456-469. Evans, G. W., Marrero, D. G., & Butler, P. A. (1981). Environmental learning and
cognitive mapping. Environment and Behaviour, 13, 83-104.
Foo, P., Warren, W. H., Duchon, A., & Tarr, M. J. (2005). Do humans integrate routes into a cognitive map? Map- versus landmark-based navigations of novel shortcuts. Journal of Experimental Psychology: Learning, Memory, and Cognition, 31, 195-215.
Friedman, A., & Kohler, B. (2003). Bidimensional regression: Assessing the configural similarity and accuracy of cognitive maps and other two-dimensional data sets. Psychological Methods, 8, 468-491.
Gallistel, C. R. (1990). The organization of learning. Cambridge, MA: MIT Press. Golledge, R. G. (1999). Wayfinding behavior: Cognitive mapping and other spatial
processes. Baltimore, MA: The Johns Hopkins University Press.
Hamid, S. N., Stankiewicz, B., & Hayhoe, M. (2010). Gaze patterns in navigation: Encoding information in large-scale environments. Journal of Vision, 10, 1–11, http://www.journalofvision.org/content/10/12/28, doi:10.1167/10.12.28.
Harris, M. A., & Wolbers, T. (2014). How age-related strategy switching deficits affect wayfinding in complex environments. Neurobiology of Aging, 35, 1095-1102. Hazen, N. L., Lockman, J. L., and Pick, H. L. (1978). The development of children’s
Hegarty, M., Montello, D. R., Richardson, A. E., Ishikawa, T., & Lovelace, K. (2006). Spatial abilities at different scales: Individual differences in aptitude-test performance and spatial-layout learning. Intelligence, 34, 151-176.
Hegarty, M., Richardson, A. E., Montello, D. R., Lovelace, K., & Subbiah, I. (2002). Development of a self-report measure of environmental spatial ability. Intelligence, 30, 425-447.
Hegarty, M., & Waller, D. (2004). A dissociation between mental rotation and perspective-taking spatial abilities. Intelligence, 32, 175-191.
Ishikawa, T., & Montello, D. R. (2006). Spatial knowledge acquisition from direct experience in the environment: Individual differences in the development of metric knowledge and the integration of separately learned places. Cognitive Psychology, 52, 93-129.
Klatzky, R. L., Loomis, J. M., Golledge, R. G., Cicinelli, J. G., Doherty, S., & Pellegrino, J. W. (1990). Acquisition of route and survey knowledge in the absence of vision. Journal of Motor Behvavior, 22, 19-43.
Kozhevnikov, M., & Hegarty, M. (2001). A dissociation between object manipulation spatial ability and spatial orientation ability. Memory & Cognition, 29, 745-756. Lahiri, U., Trewyn, A., Warren, Z., & Sarkar, N. (2011). Dynamic eye gaze and its
potential in virtual reality based applications for children with Autism Spectrum Disorders. Autism Open Access, 1, 10000101.
Landau, B., Spelke, E., & Gleitman, H. (1984). Spatial knowledge in a young blind child. Cognition, 16, 225-260.
Loomis, J. M., Klatzky, R. L., Golledge, R. G., Cicinelli, J. G., Pellegrino, J. W., & Fry, P. (1993). Nonvisual navigation by blind and sighted: Assessment of path integration ability. Journal of Experimental Psychology: General, 122, 73-91. Montello, D. R. (1998). A new framework for understanding the acquisition of spatial knowledge in large-scale environments. In M. J. Egenhofer, & R. G. Golledge (Eds.), Spatial and temporal reasoning in geographic information systems. (pp.143-154). Oxford: Oxford University Press.
Munn, S. M., Stefano, L., & Pelz, J. B. (2008). Fixation-identification in dynamic scenes: Comparing an automated algorithm to manual coding. Proceedings of the 5th Symposium on Applied Perception in Graphics and Visualization. Los Angeles, California.
Nazareth, A., Odean, R., & Pruden, S. M. (2017). The Use of Eye-tracking in Spatial Thinking Research. In C. Was, F. Sansosti, & B. Morris (Eds.), Eye-Tracking Technology Applications in Educational Research (pp. 239-260). Hershey, PA: IGI Global.
Ploran, E. J., Rovira, E., Thompson, J. C., & Parasuraman, R. (2015). Underlying spatial skills to support navigation through large, unconstrained environments. Applied Cognitive Psychology, 29, 608-613.
Presson, C. C., & Montello, D. R. (1988). Points of reference in spatial cognition: Stalking the elusive landmark. British Journal of Developmental Psychology, 6, 378-381.
Psychology Software Tools, Inc. [E-Prime 2.0]. (2012). Retrieved from http://www.pstnet.com.
Salvucci, D. D., & Goldberg, J. H. (2000). Identifying fixations and saccades in eye-tracking protocols. In Proceedings of the Eye Tracking Research and Applications
Symposium (pp.71-78). New York: ACM Press.
Siegel, A. W., & White, S. H. (1975). The development of large-scale environments.
Advances in Child Development and Behaviour, 10, 9-55.
Snodgrass, J. G., & Corwin, J. (1988). Pragmatics of measuring recognition memory: Applications to dementia and amnesia. Journal of Experimental Psychology:
General, 117, 34-50.
Sorrows, M. E., & Hirtle, S. C. (1999). The nature of landmarks for real and electronic spaces. In C. Freksa, D. M. Mark (Eds.), Spatial information theory: Cognitive and computational foundations of geographic information science, COSIT ’99,
Vol. 1661 Lecture Notes in Computer Science (pp. 37-50). Berlin: Springer.
Strayer, D. L., Drews, F. A., & Johnston, W. A. (2003). Cell phone-induced failures of visual attention during simulated driving. Journal of Experimental Psychology:
Applied, 9, 23-32.
Sutton, J. E., Buset, M, & Keller, M. (2014). Navigation experience and mental
representations of the environment: Do pilots build better cognitive maps? PLoS
ONE, 9, e90058.
Sutton, J. E., Keller, M., & Vollebregt, M. (2017). Navigating (in) the second decade of life: Cognitive maps improve across adolescence. Manuscript submitted for publication.
Sutton, J. E., Vollebregt, M., & Grogan, B. (2016, November). Self-guided exploration of a novel environment results in a more accurate cognitive map than learning via route integration. Paper presented at the 57th annual meeting of the
Psychonomic Society, Boston, MA.
Tolman, E. C. (1948). Cognitive maps in rats and men. The Psychological Review, 55, 189-208.
Tolman, E. C., Ritchie, B. F., & Kalish, D. (1946). Studies in spatial learning: I. Orientation and the short-cut. Journal of Experimental Psychology, 36, 13-24. Waller, D., & Greenauer, N. (2007). The role of body-based sensory information in the
Weisberg, S. M., & Newcombe, N. S. (2016). How do (some) people make a cognitive map? Routes, places, and working memory. Journal of Experimental Psychology: Learning, Memory, and Cognition, 42, 768-785.
Weisberg, S. M., Schinazi, V. R., Newcombe, N. S., Shipley, T. F., & Epstein, R. A. (2014). Variations in cognitive maps: Understanding individual differences in navigation. Journal of Experimental Psychology: Learning, Memory, and Cognition, 40, 669-682.
Wen, W., Ishikawa, T., & Sato, T. (2011). Working memory in spatial knowledge acquisition: Differences in encoding processes and sense of direction. Applied Cognitive Psychology, 25, 654-662.
Wen, W., Ishikawa, T., & Sato, T. (2013). Individual differences in the encoding
processes of egocentric and allocentric survey knowledge. Cognitive Science, 37, 176-192.
Wolbers, T., & Hegarty, M. (2010). What determines our navigational abilities? Trends in Cognitive Sciences, 14, 138-146.
Yantis, S. (1993). Stimulus-driven attentional capture and attentional control settings. Journal of Experimental Psychology: Human Perception and Performance, 19, 676-681.
Curriculum Vitae
Name: Mikayla Keller
Post-secondary Education and Degrees:
Brescia University College; TheUniversity of Western Ontario
London, Ontario, Canada 2010 - 2014
B.A. Psychology, Honours Specialization
The University of Western Ontario London, Ontario, Canada
2015 - Present
M.Sc. Psychology, Cognition
Honours and Awards:
Academic Dean’s Entrance Scholarship
2010 – 2011, 2011 – 2012, 2012 – 2013, 2013 – 2014
Western Graduate Research Scholarship 2015 – Present
Stanley Nelson Roscoe Best Student Paper Award – Finalist and Second
Runner-up – 19th International Symposium on Aviation Psychology
2017
Related Work Experience:
Research Assistant to Dr. Jennifer Sutton
Spatial Cognition Laboratory, Department of Psychology Brescia University College
March 2013 – September 2015
Teaching Assistant
The University of Western Ontario September 2015 – Present
Publications:
Sutton, J. E., Buset, M., & Keller, M. (2014). Navigation experience and mental representations of the environment: Do pilots build better cognitive
Keller, M., & Sutton, J. E. (2017). Flight experience and mental representations of space. In Proceedings of the 19th International
Symposium on Aviation Psychology (pp. 256 - 261). Dayton, OH:
Association of Aviation Psychology.