PHENOTYPIC CHARACTERIZATION AND GENETIC DIVERSITY STUDIES OF SELECTED RICE (ORYZA SATIVA L.) POPULATIONS BASED ON AROMA
AND COOKED KERNEL ELONGATION
Wambua Festus Kioko
I56/27393/2013
A Thesis Submitted in Partial Fulfillment of the Requirements for the Award of the Degree of Master of Science (Biotechnology) in the School of Pure and Applied Sciences of Kenyatta University
DECLARATION
I declare that this thesis is my original work and has not been presented for a degree in
any other University or any other award.
Festus Kioko Wambua,
Department of Biochemistry and Biochemistry, Kenyatta University.
Signature………..Date……….
We confirm that the work reported in this thesis was carried out by the candidate under our supervision.
Dr. Mathew Piero Ngugi,
Department of Biochemistry and Biotechnology, Kenyatta University.
Signature………....………..Date………..………
Dr. Geoffrey Muriira Karau, Molecular Biology Laboratory, Kenya Bureau of Standards.
DEDICATION
This thesis is special dedication to my dear parents who brought me into being and
ACKNOWLEDGEMENTS
I thank the almighty God for the gift of life and good health that enabled me to pursue
my education dreams. I am forever indebted to my supervisors, Dr. Mathew Piero
Ngugi and Dr. Geoffrey Muriira Karau for their dedicated mentorship during my
project work. This work would not have been a success without the support and
provision of resources from Kenya Bureau of Standards, Molecular Biology
laboratory where I carried out my research. Thanks to my colleague Amos Mawia for
his encouragement and support. I recognize, with appreciation, Samantha Mary
Nyawira and Maureen Langat for offering their technical assistance whenever I
needed them. My gratitude goes also to my family for their financial and moral
TABLE OF CONTENTS
DECLARATION... ii
DEDICATION... iii
ACKNOWLEDGEMENTS ... iv
TABLE OF CONTENTS ... v
LIST OF TABLES ... viii
LIST OF FIGURES ... ix
ABBREVIATIONS AND ACRONYMS ... xii
ABSTRACT ... xiii
CHAPTER ONE ... 1
INTRODUCTION... 1
1.1Background information ... 1
1.2Statement of the problem ... 5
1.3 Justification ... 5
1.5 Objectives ... 6
1.5.1 General Objective ... 6
1.5.2Specific Objectives ... 6
1.6 Significance of the study ... 6
CHAPTER TWO ... 8
LITERATURE REVIEW ... 8
2.1 The biology of rice ... 8
2.2 Origin and geographical distribution of rice ... 9
2.3 Global economic impact of rice ... 13
2.4 Quality traits of rice grain ... 14
2.4.1 Rice aroma ... 14
2.4.2 Cooked kernel elongation ... 15
2.5 Rice genetic diversity ... 15
2.6 Measurement of genetic diversity ... 16
2.6.1 Morphological markers ... 17
2.6.2 Biochemical markers ... 17
2.6.3.1 Restriction Fragment Length Polymorphism (RFLP)... 18
2.6.3.2 Random Amplified Polymorphic DNA (RAPD) ... 19
2.6.3.3 Amplified Fragment Length Polymorphism (AFLP) ... 19
2.6.3.4 Single Nucleotide Polymorphism (SNP) ... 19
2.7 Simple Sequence Repeats (SSR) Markers ... 20
CHAPTER THREE ... 22
MATERIALS AND METHODS ... 22
3.1 Plant material ... 22
3.2 Determination of phenotypic diversity ... 23
3.2.1 Measurement of grains and kernel traits ... 23
3.3 Determination of genetic diversity ... 23
3.3.1 Genomic DNA extraction ... 23
3.3.2 Quantification of genomic DNA ... 24
3.3.3 Simple Sequence Repeat (SSR) analysis ... 25
3.3.4 Polymerase Chain Reaction (PCR) ... 26
3.3.5 Electrophoretic separation and visualization of PCR products... 28
3.4 Data management and analysis ... 29
CHAPTER FOUR ... 31
RESULTS ... 31
4.1 Determination of phenotypic diversity ... 31
4.1.1 Measurement of grain and kernel traits ... 31
4.1.2 Principal Component Analysis ... 36
4.1.3 Cluster analysis of rice varieties based on morphological traits ... 38
4.2 Determination of genetic diversity ... 40
4.2.1 Quality of extracted DNA ... 40
4.2.2 Simple Sequence Repeat (SSR) analysis, allele number and PIC ... 40
4.2.2.1 Simple Sequence Repeat (SSR) analysis ... 40
4.2.2.2 Number of alleles ... 41
4.2.2.3 Rare alleles ... 42
4.2.2.4 Polymorphic Information Content (PIC) values ... 42
4.3 Determination of genetic relatedness ... 45
4.3.1 Genetic distance ... 45
4.3.2 Cluster analysis ... 47
4.3.3 Analysis of molecular variance (AMOVA) ... 48
4.3.4 Principal coordinates analysis (PCoA) ... 49
CHAPTER FIVE ... 51
DISCUSSION, CONCLUSIONS, RECOMMENDATIONS AND SUGGESTIONS FOR FURTHER RESEARCH ... 51
5.1 Discussion ... 51
5.2 Conclusions ... 64
5.3 Recommendations ... 66
5.4 Suggestion for further research ... 67
REFERENCES ... 68
LIST OF TABLES
Table 1.1: Taxonomy of rice ... 1
Table 2.1: Species complexes of the genus Oryza and their geographical distribution ... 12
Table 3.1:Profiles of rice varieties used in the study ... 22
Table 3.2: Profiles of rice microsatellite (RM) or SSR makers used in this study ... 27
Table 4.1: Analysis Of Variance (ANOVA) ... 35
Table 4.2: Eigen values and percent of variation for 7 principal component axes………. in 13 ricevarieties………...….37
Table 4.3: Profiles of Simple Sequence Repeat (SSR) analysis ... 44
Table 4.4: C.S. Cord coefficients of dissimilarity among pairs of 13 rice varieties ... 46
LIST OF FIGURES
Figure 2.1:Schematic representation of the evolutionary pathways of Asian and African rice .. 10
Figure 2.2:Global rice production in the world. ... 13
Figure 4.1: Scatter plot of 13 rice varieties based on the first two principal components… ……38
Figure 4.2: Dendrogram generated by cluster analysis of morphological characters ... 39
Figure 4.3:Neighbor joining tree, 1000 bootstraps, dissimilariy matrix index………
presence/ absence (Jaccards coefficient)……… ... 48
Figure 4.4:Two-dimensional scatter plot of principal coordinate analysis for all………
LIST OF PLATES
Plate 4.1: A gel picture showing fourteen rice DNA samples extracted using CTAB method. . 40
LIST OF APPENDICES
APPENDIX 1: One-way ANOVA: GL versus genotype ... 76
APPENDIX 2: Tukey Pairwise Comparisons ... 76
APPENDIX 3: One-way ANOVA: GB versus genotype ... 77
APPENDIX 4: Tukey Pairwise Comparisons ... 77
APPENDIX 5: One-way ANOVA: GL/B versus genotype ... 78
APPENDIX 6: Tukey Pairwise Comparisons ... 78
APPENDIX 7: One-way ANOVA: KL versus genotype ... 79
APPENDIX 8: Tukey Pairwise Comparisons ... 79
APPENDIX 9: One-way ANOVA: KB versus genotype ... 79
APPENDIX 10: Tukey Pairwise Comparisons ... 80
APPENDIX 11: One-way ANOVA: KL/B versus genotype ... 80
APPENDIX 12: Tukey Pairwise Comparisons ... 81
APPENDIX 13: One-way ANOVA: 10GW versus genotype ... 82
APPENDIX 14: Tukey Pairwise Comparisons ... 82
ABBREVIATIONS AND ACRONYMS
2AP 2-Acetyl-1-Pyroline
BAD Betaine Aldehyde Dehydrogenase
Cm Centimorgan
Fgr Fragrance
CTAB Cetyl Trimethyl Ammonium Bromide
DNA Deoxyribonucleic Acid
GC-MS Gas Chromatography Mass Spectroscopy
MAS Marker Assisted Selection
MAB Marker Assisted Breeding
PCR Polymerase Chain Reaction
QTL Quality Trait Loci
RFLP Restriction Fragment Length Polymorphism
RAPD Random Amplified Polymorphic DNA
SNP Single Nucleotide Polymorphism
SSR Simple Sequence Repeats
UPGMA Unweighted Pair Group Method with Arithmetic Mean
PCA Principal Component Analysis
PCoA Principal Coordinate Analysis
AMOVA Analysis of Molecular Variance
PIC Polymorphic information Content
MIAD Mwea Irrigation and Agricultural Development
ABSTRACT
CHAPTER ONE
INTRODUCTION
1.1Background information
Rice (Oryza sativaL.) is a member of the grass family (Gramineae) belonging to the genus Oryza(Table 1.1). The genus Oryza includes 23 wild species and 2 cultivated species. Of the two cultivated species, African rice (Oryza glaberrima) is highly
grown in West Africa whereas the Asian rice (Oryza sativa L.) has spread overtime and is grown in all continents in the world. Being able to grow in a wide spectrum of
climates and conditions, rice is a staple food for one third of the world’s population
(Chakravarthi and Naravaneni, 2006).
Table 1.1:Taxonomy of rice
Taxonomic level Name
Kingdom Plantae
Division Magnoliophyta
Class Liliopsida
Order Poales
Family Graminineae or poaceae
Tribe Oryzae
Genus Oryza
Rice (Oryza sativa L.) is regarded as one of the major cereal crops with high agronomic and nutritional importance.It is one of the food crops for which complete
genome sequence is available. Therefore, it is an ideal model plant for the study of
grass genetics due to its relatively small genome size of 430 Mb compared to other
plants (Causse et al., 1994).
The current global production of rice is about 738.1 million metric tonnes per year.
This constitutes more than a quarter of all cereal grains. Of these, Asia accounts for
the largest production totaling to about 584 million tones, whereas Africa produces
approximately 21.9 million tones. In Kenya, rice is the third most important staple
food after maize and wheat. The local production is estimated at between 45,000 to
80,000 tones whereas its consumption is about 300,000 tones. This huge production -
consumption gap is met through imports. About 80% of the rice grown in Kenya is
from irrigation schemes in Mwea, Ahero, Bunyala, West Kano and Yala swamp. The
remaining 20% is produced under rain fed conditions (Ouma, 2014).
Rice is mainly used as a major source of human food.However, it has other uses such
as animal feed, production of alcoholic beverages such as wine, rice bran oil, fuel and
manufacture of insulation materials (Chakravarthi and Naravaneni, 2006).
There is a wide genetic diversity available in rice among and between landraces,
leaving a wide scope for future crop improvement. Landraces are the local or
traditional varieties of a domesticated plant species which have developed overtime
homogeneous crops has led to development of a small number of standard, high
yielding varieties. This has consequently resulted to tremendous loss of
heterogeneous traditional cultivars through genetic erosion. Landraces preserve much
of this lost diversity and are known to harbor great genetic potential for breeding new
crop varieties that can cope with environmental and demographic changes
(Esquinas-Alacazar, 2005).
Proliferation of rice varieties has narrowed down the number of combinations of
morphological descriptors available to describe the uniqueness of a variety.
Therefore, characterization and varietal identification of available landraces and
improved varieties have become important in modern day crop improvement
(Vanniarajanet al.,2012).
There are more than 120,000 rice varieties worldwide but the major categories
include; indica, japonica, basmati and glutinous. These varieties differ in their grain
qualities which include: milling quality, grain shape, cooking quality and nutritional
quality. These traits are crucial determinants of cooked rice grain quality. In rice,
aroma is caused by accumulation of 2-acetyl-1-pyroline (2-AP). This compound is
encoded by betaine aldehyde dehydrogenase 2 (BAD2) gene which is also called
fragrance (fgr) gene located on chromosome 8. Accumulation of 2-AP is caused by
Kernel elongation trait is influenced by several physicochemical and genetic factors,
including genotypes, aging temperature, aging time, water uptake, amylose content
and gelatinization temperature. Cooked kernel elongation is influenced by kne gene and the major QTL has been mapped on chromosome 8. Previous studies on genetic
analysis have shown that genes and / or QTLs of cooked kernel elongation and
aroma are linked (Ahn et al., 1993).
Various methods previous used in quality trait studies in rice include sensory and
chemical methods for determining aroma and measuring kernel length and breadth
before and after cooking. Sensory and chemical methods require panels of analysts
to distinguish fragrant and non-fragrant rice samples hence are unreliable and
inconsistent. Other methods include use of spectroscopy, stable isotope dilution, gas
chromatography – mass spectrometry (GC–MS) and near-infrared reflectance
(Yoshihashi et al., 2005). These methods have various limitations that include low
sensitivity, time consuming and large sample volume requirement hence they are not
reliable (Garland et al., 2000).
Simple sequence repeat (SSR) markers offer a simple way of detecting genetic
variation in rice varieties with high level of polymorphism (Bligh et al., 1999).
These markers are preferred over other PCR-based molecular markers due to their
ease of application, easy scoring patterns, high reproducibility, greater allelic
diversity and their relative distribution throughout the genome (Blair and McCouch,
This study was aimed at assessing the phenotypic variation and genetic diversity
among rice varieties based on aroma and kernel elongation. This was achieved by
measuring morphological traits and using previously mapped PCR based SSR
markers to determine the genetic diversity.
1.2Statement of the problem
Kenya is home to many varieties of rice varieties and land races. These varieties
were developed through selection based on agronomic traits. This resulted in a wide
spectrum of varieties that are highly valued both in domestic and foreign markets. In
Kenya, rice consumers prefer the aromatic rice, which is high in quality, and hence
price. Fragrant rice is often blended with low quality non-fragrant rice and sold as
premium rice. In addition, lack of genetic background information on these varieties
has constrained development of better varieties (Vlachos and Arvanitoyannis, 2008).
Various conventional methods routinely used to evaluate and grade rice varieties
include sensory and chemical methods. These methods are inconsistent and have
failed to address these concerns due to low sensitivity, time consumption and large
sample volume requirement.
1.3 Justification
Molecular characterization using PCR-based SSR markers provides a suitable
method, which can be used for varietal identification in rice supplies and to
differentiate between the various grades of fragrant rice. This is because they are
highly reproducible, co-dominant, interspersed throughout the genome and require
addition, grain quality evaluation is a key step in development of better rice varieties
through marker-assisted selection. This project was therefore aimed at validating the
SSR markers for diversity as a tool for grading of Kenyan rice.
1.4Research questions
i. What are the levels of phenotypic diversity among selected Kenyan and
Tanzanian rice varieties?
ii. What are the levels of heterozygosity among selected Kenyan and
Tanzanian rice varieties?
iii. What are the levels of genetic diversity among selected Kenyan and
Tanzania rice varieties?
1.5Objectives
1.5.1 General Objective
Tocarry out phenotypiccharacterizationand genetic diversity studies on selected rice
(Oryza sativa L.) populations based on aroma and coked kernel elongation using microsatellite markers.
1.5.2 Specific Objectives
i. To determine phenotypic diversity among selected Kenyan and Tanzanian
rice varieties.
ii. To determine heterozygosity among selected Kenyan and Tanzanian rice
varieties based on aroma and cooked kernel elongation traits.
iii. To determine genetic diversity among selected Kenyan and Tanzanian rice
1.6 Significance of the study
Information on the phenotypic diversity, genetic relatedness and heterozygosity
among the rice varieties was developed in this study. This can be used for quality
assurance in discriminating between good quality from low quality rice in the
market. This information is also imperative in Molecular Assisted Breeding (MAB)
in the era of modern biotechnology to add value to our own local rice varieties and
CHAPTER TWO
LITERATURE REVIEW
2.1 The biology of rice
Rice (Oryza sativa L.) belongs to the grass family Gramineae and is a member of the
genus Oryza. The genus Oryza includes 25 species, of which 23 are wild species and two (O. sativa and O. glaberrima) arecultivated species (Londoet al., 2006). Rice is normally grown as a monocarpic annual plant but can also survive as a perennial crop
in tropical areas and can produce a ratoon crop for up to 20 years (Linares, 2002).
Rice plant can grow up to 2 - 6 ft (61–183 cm) tall, depending on the variety and soil
fertility. As a member of grass family, it has a long, pointed leaves between
50-100cm long and 2-2.6cm broad. It has small wind pollinated flowers that are
produced in a branched arching to the pendulous inflorescence. The edible part of the
rice plant is the rice grain which is a caryopsis, 5-12mm long and 2-3mm thick and
includes glumes, endosperm, and embryo (Izawa and Shimamoto, 1996).
Rice endosperm consists mostly of starch granules in a crude fiber, together with
sugar, fats, proteinaceous matrix, and organic matter. Oryza sativa has a relatively small diploid genome (2n = 24) of about 430 million base pairs. This is the smallest
genome of all food crops and approximately half of the genome is composed of
repetitive sequences (Sang et al., 2007). The basic chromosome number of the genus
Oryza is 12. Both O. sativa, O. glaberrima and 14 wild species are diploids with 24
48). Incompatibility exists among species having different genomes. Partial sterility
in hybrids is common when different ecogeographic races of Oryza sativa are
hybridized (Vaughan et al., 2005).
2.2 Origin and geographical distribution of rice
It is generally agreed that Oryza sativa could have originated from the river valleys of
Yangtze and Mekon in China. On the other hand,the delta of Niger River in Africa is
believed to be the primary center of origin of Oryza glaberrima (Sweeney and McCouch, 2007). The foothills of the Himalayas, northeastern India, Chattisgarh,
Jeypore Tract of Orissa, northern parts of Myanmar and Thailand, and Yunnan
Province of China are some of the centersof diversity for Asian varieties. The Inner
delta of Niger River and some areas around Guinean coast of the Africa are the
centers of diversity of the African species of Oryza glaberrima (Linares, 2002).
Oryza sativa and Oryza glaberrima are believed to have evolved independently from two different progenitors, Oryza nivara and Oryza barthiias shown in figure 2.1.
These two types of rice are believed to be domesticated in South or South East Asia
and tropical West Africa respectively. The progenitors of Oryza sativa are considered
Figure 2.1:Schematic representation of the evolutionary pathways of Asian and African cultivated rice; Source:(Chang, 1976).
Of the two cultivated species, the Asian rice, Oryza sativa is the most widely grown. It is grown worldwide, including in Asian, European Union, North and South American,
Middle Eastern and African countries. Oryza glaberrima, however, is grown solely in West African countries. Asian rice (both indica and japonica) was domesticated about
8,200–13,500 years ago in the Pearl River valley region of china and later spread from
East Asia to Southeast and South Asia. The crop was then introduced to Europe
through Western Asia route and to the Americas during European colonization (Huang
et al., 2012).
African rice was domesticated in inland delta of upper Niger river, which is today Mali
about 3500 years ago and extended to Senegal. However, this rice species did not
spread further from its original region because the Asian species was introduced
The wild species are widely distributed in the tropics of Africa, Central and South
America, Asia, and Australia(Vaughan et al., 2005). The geographical distribution of
Table 2.1: Species complexes of the genus Oryza and their geographical distribution
Source: Brar and Khush,(2003).
Sativa complex Chromosome
Number
Genome Geographical Distribution
I 1. O. sativa L. 24 AA Worldwide: originally
South & Southeast Asia 2. O. nivara Sharma et Shastry 24 AA South & Southeast Asia
3. O. rufipogon Griff. 24 AA South & Southeast Asia,
South China
4. O. meridionalis Ng 24 AA Tropical Australia
5. O. glumaepetula Steud. 24 AA Tropical America
6. O. glaberrima Steud. 24 AA Tropical West Africa
7. O. barthii A. Chev. et Roehr 24 AA West Africa
8. O. longistaminata A. Chev. et Roehr. 24 AA Tropical Africa II Officinalis Complex
9. O. punctata Kotschy ex Steud. 24 BB East Africa
10. O. rhizomatis Vaughan 24 CC Sri Lanka
11. O. minuta J.S.Pesl. ex C.B.Presl. 48 BBCC Philippines, New Guinea
12. O.malamphuzaensis Krishn 48 BBCC Kerala & Tamil Nadu
13. O. officinalis 24 CC South & Southeast Asia
14. O. eichingeri A. Peter 24 CC East Africa & Sri Lanka
15. O. latifolia Desv. 48 CCDD Central & South
America
16. O. alta Swallen 48 CCDD Central & South
America
17. O. grandiglumis (Doell) Prod. 48 CCDD South America
18. O. australiensis Domin. 24 EE Northern Australia
19. O. schweinfurthiana Prod. 48 BBCC Tropical Africa
III Meyeriana Complex
20. O. granulata Nees et Arn. ex Watt 24 GG South & Southeast Asia 21. O. meyeriana (Zoll. et Mor. ex
Steud.) Baill.
24 GG Southeast Asia
IV Ridleyi Complex
22. O. longiglumis Jansen 48 HHJJ Indonesia, New Guinea
23. O. ridleyi Hook. f. 48 HHJJ Southeast Asia
V Unclassified (belonging to no complex)
24. O. brachyantha A. Chev. et Roehr. 24 FF West & Central Africa
2.3 Global economic impact of rice
Rice is cultivated in about 162.3 million hectares in the world accounting for the total
production of about 738.1 million tones (Choudhury et al., 2004). Of these, developing countries account for 95% with the largest producers being china, India, Indonesia,
Bangladesh, Vietnam, and Thailand as shown in figure 2.2. It is therefore a major
economic mainstay for majority of rural populations, being mainly cultivated by small
scale farmers and is a source of income for workers in the non-agricultural sectors.
In Africa, rice is largely cultivated in West Africa with Benin, Cameroon, Burkinafaso
and Chad being the greatest producers. However, rice production in Africa has not kept
pace with increasing demand. Consequently, only 54% of the Sub-Saharan Africa’s rice
consumption is supplied locally. It is estimated that 3.4 billion people derive 20% of
their daily calories from rice hence it is regarded the most important grain with respect
to human nutrition and calorific intake (Smith, 2001).
2.4 Quality traits of rice grain
In the major rice producing countries, grain quality traits highly determine the market
value of the rice. The quality traits of rice grain range from physical to biochemical
properties and include, grain shape and appearance, milling efficiency, cooking easiness,
eating palatability, and nutrition. In particular, the cooking and eating qualities are very
crucial determinants of cooked rice grain quality (Fitzgeraldet al., 2009).
The cooking and eating qualities of rice are influenced by several factors with amylose
content being the most important determinant of cooked rice quality. Others include
gelatinization temperature, gel consistency, and aroma (Fitzgeraldet al., 2009). In particular, aroma and cooked kernel elongation are the most important quality traits of
rice, which differentiate the highly valued aromatic rice from the other rice types.
2.4.1 Rice aroma
Aromatic rice is preferred by consumers and fetches a high price both in domestic and
international markets. In Kenya, rice consumers prefer the aromatic basmati rice which
has superior cooking and eating qualities compared to the other local and imported
varieties. Rice grain aroma results from the production of many biochemical compounds
(Lorieux et al., 1996). Sakthivelet al. (2009) reported that accumulation of
2-acetyl-1-pyrroline (2AP) is the most important compound responsible for aroma. Aroma
compound is encoded by betaine aldehyde dehydrogenase 2(BAD2) gene which is located on chromosome 8 and the level of aroma depends on this gene caused by 8 bp
2.4.2 Cooked kernel elongation
Linear elongation of the kernel after cooking is one of the major characteristics of fine
rice (Govindarajet al., 2009). It is considered to be a physical phenomenon which is influenced by several physicochemical and genetic factors which include;water uptake,
amylose content, aging temperature, gelatinization temperature, aging time and
genotypes. During cooking, rice kernels absorb water and increase in volume through
increase in length or breadth. Length-wise increase without increase in girth is a
desirable characteristic in high-quality premium rice. Conventional methods routinely
used to evaluate kernel elongation include measuring grain length and breadth before
and after cooking to obtain grain elongation ratio hence the proportionate change (Cruz
and Khush, 2000).
2.5 Rice genetic diversity
Genetic diversity refers to the total number of genetic characteristics in the genetic
makeup of a species. It occurs as a result of recombination, mutation, selection and
genetic drift. Mutation and recombination leads to development of new varieties in a
population, whereas selection and genetic drift remove some alleles.
Land races or traditional which are maintained through traditional farming practices
contain huge genetic variability which can be used to improve and widen the gene pool
of existing genotypes (Villa et al., 2005).Information about genetic diversity and relationships among rice varieties is very crucial in crop improvement strategies.
adaptation tothe prevailing environmentalstress. Genetic diversity determines the
inherent potential of a cross and frequency of desirable recombinants in advanced
generations.
In a breeding programme, genetic distance or parental diversity of optimum magnitude
is a prerequisite to obtain superior genotypes. The analysis of genetic variation among
breeding materials is of critical interest to plant breeders, as it contributes immensely to
selection, prediction of potential genetic gainsand monitoring of germplasm
(Chakravarthi and Naravaneni, 2006).
2.6 Measurement of genetic diversity
The assessment of genetic diversity among plant populations is done using various
techniques such as morphological markers, biochemical markers and DNA or molecular
marker analysis. Of these, DNA markers are considered best for analysis of genetic
diversity and varietal identification since they are not influenced by the stage of plant
development and environment changes (Virk et al., 2000).
Further, these markers can also be utilized in detection of genes influencing
agronomically important traits. Molecular marker technology provides an essential tool
for evaluation of genetic diversity among different varieties as well as, identification of
cultivars and thus adds to management plant genetic resources (Virk et al., 2000). They include; restriction fragment lengthpolymorphism (RFLP) (Devos and Gale, 1992),
simple sequence repeat (SSR) (McCouch etal., 2002), amplified fragment length polymorphism (AFLP) (Vekemans et al., 2002), and single nucleotide polymorphism
(SNP) (Ganal et al., 2009).
2.6.1 Morphological markers
They are based on visually accessible traits such as plant height, seed shape and colour.
They involve field experiments hence requires large tracts of land and this makes it more
expensive than other techniques. In addition, morphological markers are less abundant,
vary during plant development and are adversely affected environmental variation.
Therefore, morphological markers are not reliable (Staub et al., 1996).
2.6.2 Biochemical markers
Theyare also called isozymes. Isozymes are allelic variants of enzymes and they are
usually detected by electrophoresis and specific staining. They are as a result of amino
acid alterations which cause net charge changes or conformational (spatial structural)
changes which results in a shift in their electrophoretic morbidity. Addition of a specific
enzyme stain can reveal isozyme profile of individual samples (Knapp and
Rice,1998).Isozyme markers are codominant in nature. They detect diversity at
functional gene level and have the advantage of requiring small amount of material for
detection and are less influenced by the environment. However, these markers offer
limited polymorphism, only a limited number areavailable, and often do not allow
2.6.3 Molecular markers
A molecular marker is a DNA sequence that is readily detected and whose inheritance
can be easily monitored. They are the most widely used genetic marker type, comprising
a large variety of DNA molecular markers. They offer a wide range of advantages over
morphological and biochemical markers as they are stable and detectable in all tissues
regardless of growth, differentiation, development, or defense status of the cell.
Additionally, they are not confounded by environmental, pleiotropic, and epistatic
effects. Molecular markers can cover the whole genome hence they are able to detect the
variation that arises from deletion, duplication, inversion, and/or insertion in the
chromosomes. They are neutral and therefore, do not affect the phenotype of the traits of
interest because they are located only near or linked to genes controlling the traits. Many
DNA markers are co-dominant and can differentiate between the homozygous and
heterozygous genotypes (Kurma et al., 2009).
2.6.3.1 Restriction Fragment Length Polymorphism (RFLP)
Restriction Fragment Length Polymorphism (RFLP) is a technique in which varietiesare
differentiated by analysis of patterns derived from cleavage of their DNA. This
technique is mainly based on the special class of enzyme called restriction
endonucleases. The two main advantages of RFLP markers are co-dominance and high
reproducibility. Disadvantages are the requirement of relatively large amounts of pure
2.6.3.2 Random Amplified Polymorphic DNA (RAPD)
RAPD markers involve PCR amplification technique of random DNA segments with
single, typically short primers of arbitrary nucleotide sequence. A disadvantage of
RAPD markers is the fact that the polymorphisms are detected only as the presence or
absence of a band of a certain molecular weight, with no information on heterozygosity.
Besides being dominantly inherited, RAPDs also show some problems with
reproducibility of data. Their major advantages are the technical simplicity and the
independence of any prior DNA sequence information (Williams et al., 1990).
2.6.3.3 Amplified Fragment Length Polymorphism (AFLP)
The AFLP technique combines elements of RFLP and RAPD. It is based on the
selective PCR amplification of restriction fragments. Possible reasons for
AFLP-Polymorphisms are; sequence variations in a restriction site, insertions or deletions
within an amplified fragment and differences in the nucleotide sequence immediately
adjoining the restriction site (not detected with RFLPs). Thus, the usage of AFLP
technologies results in the detection of higher levels of polymorphisms compared with
RFLPs. Amplified fragment length polymorphisms (AFLPs) also have a much higher
multiplex ratio (more markers per experiment) and better reproducibility than RAPDs. A
drawback can be that most AFLP markers are dominant rather than co-dominant, due to
the complex banding patterns (Vos et al., 1995).
2.6.3.4 Single Nucleotide Polymorphism (SNP)
SNP markers are based on sequence differences at single-base pair positions in
markers provide a great marker density. Another important advantage of SNP is that it is
not a gel-based technology. For the large-scale genotyping required in marker assisted
breeding programs, technologies based on gel electrophoresis are often too labor
intensive and time consuming. Among these markers, SSR markers have several
advantages, their co-dominant, stable and highly polymorphic characteristics have been
used intensively for rice cultivar identification, genetic diversity evaluation and
phylogenetic comparison and marker assisted selection (Ganal et al., 2009).
2.7 Simple Sequence Repeats (SSR) Markers
Simple sequence repeats (SSRs) are DNA sequences with repeat lengths of a few base
pairs that are well distributed throughout the genome and are flanked by highly
conserved region. Variation in the number of nucleotide repeats can be detected with
PCR by selecting the conserved DNA sequences flanking the SSR primers.Among
different PCR based markers, SSR markers based are preferred over other molecular
markers due to their ease of application, high reproducibility, rapid analysis, low cost,
easy scoring patterns, and relative distribution throughout the genome (Chen et al., 1997).
Simple sequences repeat (SSR) markers have been widely applied in genetic diversity
studies as they are able to detect high levels of polymorphism (McCouch et al., 1997). In rice, SSRs have been used to assess the genetic diversity of both cultivated and wild
species (Neeraja et al., 2005). More than 2,000 rice SSR markers are available from
selection of the most informative and well distributed SSR loci in the rice genome for
use in molecular analysis. Simple Sequence Repeat (SSR) are better markers for good
quality rice discrimination because they are genetically linked to fgr and kne loci (Cordeiro et al., 2002).
Specific SSR markers that are genetically linked to fragrance (fgr) locus can be used to discriminate fragrant and non-fragrant rice varieties (Bradbury et al., 2005b) According
to Lorieux et al. (1996), fgr gene is flanked by RLFP molecular markers RG28 and RG1 at a genetic distance of 6.4 ± 2.6 and 5.3 ± 2.7 cM, respectively. There is close
linkage between RG28 and fgr (5.8 cM) and two quantitative trait loci for fragrance, one on chromosome 4 and the other on chromosome 12. Several SSR markers based on RG
28 locus have been developed for discrimination of fragrant and non-fragrant rice
varieties (Garland et al., 2000).
A major quantitative trait loci (QTL) for cooked kernel elongation trait has been
identified with close proximity to the RFLP marker RZ 323 in linkage group 8. Kernel
elongation without increase in breadth on cooking is an equally important characteristic
of high quality rice. Previous studies on genetic analysis have shown that genes and or
QTLs of cooked kernel elongation and aroma are linked and present on chromosome
number 8.RM 44 primer set has been identified for use as a selection marker for
CHAPTER THREE
MATERIALS AND METHODS
3.1 Plant material
A total of 500 g of thirteen different rice varieties were collected from Mwea
Irrigation Agricultural Development (MIAD) and Kilimanjaro Agricultural Training
Center (KATC). The names and attributes of the rice varieties and the names of the
corresponding sources are detailed in table 3.1. The rice seeds were stored in the
Molecular Biology laboratory at Kenya Bureau of Standards, Nairobi, Kenya.
Table 3. 1: Profiles of rice varieties used in the study
Sr.no Genotype Source Attribute
1 IR 2793 MIAD Improved variety
2 BS 217 MIAD Improved variety
3 BS 370 MIAD Improved variety
4 BW 196 MIAD Improved variety
5 ITA 310 MIAD Improved variety
6 Red Afaa KATC Landrace
7 IR 54 KATC Improved variety
8 Kilombero KATC Landrace
9 IR 64 KATC Improved variety
10 Kahogo KATC Landrace
11 Saro 5 KATC Improved variety
12 Wahiwahi KATC Landrace
3.2 Determination of phenotypic diversity
3.2.1 Measurement of grains and kernel traits
A total of seven traits were measured in this study. They included; grain length (GL),
grain breadth (GB), grain length/breadth (G-L/B), grain weight (GW), kernel length
(KL), kernel breadth (KB), kernel length/breadth (K-L/B). Ten randomly selected raw
rice grains and kernels from each rice variety were measured for their length and
breadth traits using a digital vernier caliper. The measurements were repeated 10 times
in each and thus an average of 10 grains was recorded. The grain weight of 100
randomly counted rice kernels from each variety was determined using a weighing
balance (METTLER TOLEDO) and an average recorded (Varnamkhasti et al., 2008).
The grain and kernel length / breadth ratio (measure of slenderness) for each variety
was obtained by dividing length/breadth.
3.3 Determination of genetic diversity
3.3.1 Genomic DNA extraction
DNA was extracted from each sample by Cetyl Trimethyl Ammonium Bromide
(CTAB) with slight modifications (Ferrari et al., 2007).
The rice grains were grinded using a blender until a fine powder was formed. Further
20g of the ground samples were transferred to 50 ml falcon tubes and soaked in 600 μl
ice-cold extraction buffer. The samples were incubated for 30 min at 65°C and then
the mixture was centrifuged at 6500 x g for 10 min at 17°C. The supernatant was
The mixture was then incubated at room temperature for 5 min for precipitation of the
DNA. The content was centrifuged at 13000 x g for 10 min after which the supernatant
was discarded and the DNA pellet was left to dry overnight.
The dried DNA pellet was dissolved in 200 μl TE buffer containing RNase and
incubated at 37°C for 2 hours. CTAB buffer (400 μl) was added and the tubes
incubated for 15 min at 65°C. Five hundred microliters of chloroform-iso amyl alcohol
was added and the tubes centrifuged for 5 min. After centrifugation, the upper phase
was transferred into fresh eppendorf tubes and mixed with 1.4 μl of ethanol (96%) and
the mixture was incubated at room temperature for 15 min for DNA precipitation. The
mixture was then centrifuged at 13000 x g for 10 min. After centrifugation, the
supernatant was discarded and the DNA pellet washed with 500 μl of 70% ethanol.
This was centrifuged at 13000 x g for 10 min at 17°C. Finally, the supernatant was
discarded and the pellet dissolved in 20 μl of sterile TE buffer for purification and
stored at -20°C.
3.3.2 Quantification of genomic DNA
The purity of the extracted genomic DNA for each sample solution was determined
using a nanodrop spectrophotometer (JENWAY Genova plus) at a wavelength
(A260/A280) nm of for protein contaminants and (A260/A230) nm for polyphenol buffers
and carbohydrate contaminants. The DNA was also quantified by 1% agarose gel
electrophoresis.A suitable gel tray and combs were cleaned with a tissue paper soaked
in rectified spirit.The ends of the gel tray were then sealed with an adhesive tape.
in a microwave oven till ahomogenous, clear, boiling solution was formed.The gel
solution was cooled to ~45°C. Ethidium bromide was added when temperature
reached 45-50° C as a staining agent.
Gel was poured into the gel tray with the combs avoiding trapping of air bubbles. It
was allowed to set for at least 15 min at room temperature. TAE buffer (1X) was then
poured into the buffer-tank of the electrophoresis unit. The comb was removed
carefully from the gel and the tapes were pulled off the gel tray and the gel tray was
immersed in the buffer tank.
DNA sample dissolved in TE was pipetted onto a parafilm and mixed well with 3 μl
of 10X loading dye by pipetting up and down several times and the samples were
loaded into the gel wells. The lid was closed and the electrodes were fixed. It was
made sure that the negative terminal is at the same end of the unit as the sample
loading wells are. The power supply was turned on and the constant voltage was
adjusted to 75 volt and allowed to run for 40 min till the dye front was ~2cm from the
opposite end. DNA bands were detected by direct examination of the gel in ultraviolet
light and photographed using Uvitec gel documentation system (Cambridge, UK).
The quantified DNA was used to run PCR using trait specific SSR markers.
3.3.3 Simple Sequence Repeat (SSR) analysis
Genetic diversity among the rice varieties was assessed using 8 SSR markers of the
the markers used in this studyare described in table 3.2. The basis for selection was
annealing temperature of 55°C to 62°C and amplicon size less than 300bp. Based on
the information available on the genome wide SSR markers in rice, a total of 35 SSR
primer pairs were initially screened and 8 SSRs that were consistently amplified in
our analysis were used.
3.3.4 Polymerase Chain Reaction (PCR)
The quantified DNA samples were amplified in 25 μl reaction volumes containing of
5.0 μl template DNA, 5.4 μl ddH2O, 6 μl PCR buffer, 3.0 μl MgCl2, 3.6 μl dNTPs,
0.6 μl of each primer and 0.8 μl of Taq DNA Polymerase.
This was carried out in a thermal cycler with a cycle profile: Initial denaturation at
94°C for 4 min, 40 cycles of 1 min denaturation at 94°C, 30 sec annealing at 55°C or
62°C (depending on the marker used) and 1 min extension at 72°C, and then 4 min at
72°C for the final extension. Variety IR 64, an international check variety was used as
the positive control in PCR.The resultant PCR products were analysed by
Table 3. 2:Profiles of rice microsatellite (RM) or SSR makers used for this study
Name, motif, chromosomal location (C*), annealing temperature (A*) and product size (bp) of rice microsatellite.
Sr no. Locus Sequence Motif A* C* Amplicon size(bp)
1 RM 277 Forward: CGGTCAAATCATCACCTGAC
Reverse: CAAGGCTTGCAAGGGAAG
(GA)11 55 8 124
2 RM 232 Forward: CCGGTATCCTTCGATATTGC
Reverse: CCGACTTTTCCTCCTGACG
(CT)24 55 3 158
3 RM 252 Forward: TTCGCTGACGTGATAGGTTG
Reverse: ATGACTTGATCCCGAGAACG
(CT)19 55 4 216
4 RM 282 Forward: CTGTGTCGAAAGGCTGCAC
Reverse: CAGTCCTGTGTTGCAGCAAG
(GA)15 55 3 136
5 RM 241 Forward: GAGCCAAATAAGATCGCTGA
Reverse: TGCAAGCAGCAGATTTAGTG
(CT)31 55 4 138
6 RM 215 Forward: CAAAATGGAGCAGCAAGAGC
Reverse: TGAGCACCTCCTTCTCTGTAG
(CT)16 55 9 148
7 RM 339 Forward: GTAATCGATGCTGTGGGAAG
Reverse: GAGTCATGTGATAGCCGATATG
(CTT)8CCT(CTT)5 55 8 167
8 RM 225 Forward: TGCCCATATGGTCTGGATG
Reverse: GAAAGTGGATCAGGAAGGC
3.3.5 Electrophoretic separation and visualization of PCR products
Five microliters of PCR products were separated by electrophoresis on 2% agarose
gel. A loading dye comprising of (0.25% xylene cyanol, 0.25% bromophenol blue,
30% glycerol and 1 mM EDTA) was used for each PCR-product for purposes of
monitoring the loading, progress of electrophoresis and to increase the weight of the
sample so that it stays in the well of the gel.
A gel tray and combs were cleaned and dried with a tissue paper soaked in rectified
spirit. The open ends of the gel casting plate were sealed with cello tape and placed
on a horizontal perfectly leveled platform. Two percent agarose was added to 1X
TAE buffer and boiled till the agarose dissolved completely and then cooled.
Ethidium bromide was used as a staining agent at the final concentration of 1 μg/ml.
The gel was carefully placed in the electrophoresis gel chamber keeping the gel
horizontal and submerged in the running buffer (1× TBE) and final level of buffer
was ~5mm above the gel. The comb was placed properly and allowed to solidify.
After solidification of the agarose, the comb and cello tape were removed. 2μl of
loading dye was mixed with amplified DNA samples on a parafilm using a pipette
and were loaded into the gel wells. A molecular weight marker DNA 100 bp was
loaded on either side of the gel.
To achieve good separation of the PCR products, agarose gel electrophoresis was
had reached three quarters of the gel length. The gel was then taken out from the
electrophoresis chamber and placed on a high performance ultraviolet Trans-
illuminator. It was examined, photographed using gel documentation instrument and
saved in a computer. The size of the amplified DNA bands (microsatellite alleles) was
determined with reference to the 100 bp DNA ladder included in the gel as a size
marker.
3.4 Data management and analysis
The phenotypic data was analysed using Analysis Of Variance (ANOVA) followed
by Tukey’s post hoc statistical tools as implemented in Minitab 17 software package
(State College, Pennsylvania). A dendrogram was obtained from the mean values of
the seven traits across all the test varieties with the help of Minitab 15 software
package. Principal Component Analysis (PCA) was carried out to investigate the
overall pattern of phenotypic diversity and the individual trait contributions to
observed phenotypic diversity (Ray et al., 2013).
On the other hand, genetic data was analysed using power marker version 3.25 (Liu
and Muse, 2005) and Gen Alex version 6.5 (Peakall and Smouse,2012) statistical
software packages. Clearly resolved bands of the genotypes were manually scored
using the binary coding system, ‘1’ for presence of band and ‘0’ for absence of band.
The resultant binary matrix was subjected to Power Marker software to analyse the
genetic diversity of each variety on the basis of five parameters: major allele
diversity (Devos and Gale, 1992). A dendrogram of cluster analysis was constructed
using the Un-weighted Pair Group Method with Arithmetic average (UPGMA) as
implemented on Power Marker software and was viewed using TreeView.
Analysis of Molecular Variance (AMOVA) was used to reveal the partitioning of
variation within and among the populations. Principal Coordinate Analysis (PCoA)
was carried out based on SSR data to generate a 2- dimensional representation of
CHAPTER FOUR
RESULTS
4.1 Determination of phenotypic diversity
4.1.1 Measurement of grain and kernel traits
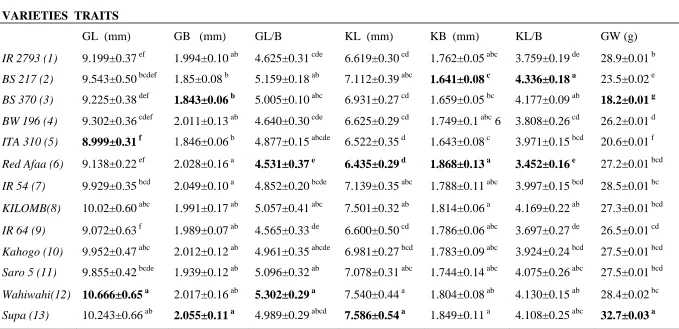
Seven grain and kernel trait measurements were found to vary across the 13 studied
rice varieties as shown in table 4.1. Of all the traits, the highest variation was
observed in grain weight where most of the rice varieties significantly differed
(P<0.05; Table 4.1).Suparice variety showed the highest grain weight followed by IR 2793 and IR 54 whereas BS 370, ITA 310 and BS 217 showed the lowest grain weight
mean values. It was observed that short and bold grains were heavier compared to
long and slender grains. High grain length coupled with grain breadth was associated
with high weight values for Supaand most of improved rice varieties. However,
Kahogo, Saro 5, Kilombero and Red Afaahad no significant variation in grain weight (P>0.05; Table4.1).
Moderate variation was observed in kernel length where dimensions ranged from
6.520 mm to 7.586 mm. Based on this trait, Supa and Wahiwahi which showed the
highest kernel length mean values were significantly different from the rest of the test
varieties (P<0.05; Table 4.1). The lowest kernel length mean values were identified in
ITA 310and Red Afaaand the two varieties significantly differed from other varieties (P<0.05; Table 4.1). All the varieties that had high and low values for grain length
Low variation was observed in grain and kernel breadth traits where grain breadth
dimensions across the rice varieties ranged from 1.846 to 2.055 mm. The highest
grain breadth mean values were observed in Supa, followed closely by Red Afaa and
IR 54and they significantly differed from the rest of the varieties (P<0.05); Table
4.1).The lowest grain breadth mean values were observed in BS 370, BS 217 and ITA 310 respectively and based on this trait, they were significantly different from other test varieties (P<0.05; Table 4.1).
On the other hand, kernel breadth dimensions ranged from 1.64 mm to 1.87mm where
the highest mean values were observed in Red Afaa, Supa and Kilombero. The three rice varieties had almost similar kernel breadth dimensions but differed significantly
when compared to the rest of the varieties in this study (P<0.05; Table 4.1). The
lowest kernel breadth mean values for were identified in BS 217, BS 370andITA 310. These results indicated that there was an association between grain and kernel breadth
traits since similar varieties showed consistency in high and low kernel breadth
values.
Grain length measurements ranged from 8.999 mm to 10.666 mm. Wahiwahihad the
longest grain size followed by Supa and Kilombero. Unlike other traits, the three rice
varieties that had the longest grain sizes were significantly different from each other
(P<0.05; Table 4.1).On the other hand, ITA 310and IR 64 had the shortestgrain sizes and were significantly different from other rice varieties. It was observed that
common source, Tanzania. On the other hand,non-aromatic improved varieties were
found to have the shortest grains and shared a common origin, as shown by the IR
codes which indicates are improved varieties from Philippine.
Grain length/ breadth ratio was calculated and the highest mean values were observed
in Wahiwahi, BS 217 and Saro 5 varieties. The lowest values were observed in Red Afaa, IR 54 and IR 2793. Combination of the two traits depicted IR 54 and IR 2793 as
short and bold grains.
Kernel length / breadth ratio which is the measure of slenderness mean values ranged
from 3.45 mm to 4.34 mm. The highest mean values for this trait were observed in BS 217, BS 370 and Wahiwahiwhere BS 217, an improved aromatic variety from Kenya,
was the most slender kernel and significantly differed from the rest of the rice
varieties (P<0.05; Table 4.1). On the other hand,Red Afaa, IR 64 and IR 2793 had the
lowest mean values for kernel length/breadth ratio.
Red Afaa, IR 64 and IR 2793 with KL/B ratio of less than 3.80 was categorized as
short grain varieties whereas Kahogo, IR 54, ITA 310, and BW 196 rice varieties having KL/B ratio of less than 4.0 were considered as medium grain varieties. BS
217, BS 370, Kilombero, Saro 5, Wahiwahi and Supa showed a KL/B ratio greater than 4.0 and were categorized as long grain varieties.From these results, it was
Wahiwahi, Kilombero and Saro 5 which had medium grain sizes. Red Afaa, IR 64
and IR 2793 varieties had short and bold kernels.
High variability was revealed by analysis of variance of the seven traits across all the
varieties are shown in table 4.1. The ANOVA table clearly showed that the means of
Table 4.1: Analysis Of Variance (ANOVA) of seven grain and kernel traits of the 13 studied rice genotypes
The values are mean± SEM of ten independent determinations at 5% level of significance. Data was analysed using Analysis Of Variance (ANOVA) followed by Tukey’s post hoc test. Means that do not share a superscript are significantly different (P˂0.05).
VARIETIES TRAITS
GL (mm) GB (mm) GL/B KL (mm) KB (mm) KL/B GW (g)
IR 2793 (1) 9.199±0.37 ef 1.994±0.10 ab 4.625±0.31 cde 6.619±0.30 cd 1.762±0.05 abc 3.759±0.19 de 28.9±0.01 b
BS 217 (2) 9.543±0.50 bcdef 1.85±0.08 b 5.159±0.18 ab 7.112±0.39 abc 1.641±0.08 c 4.336±0.18 a 23.5±0.02 e
BS 370 (3) 9.225±0.38 def 1.843±0.06 b 5.005±0.10 abc 6.931±0.27 cd 1.659±0.05 bc 4.177±0.09 ab 18.2±0.01 g
BW 196 (4) 9.302±0.36 cdef 2.011±0.13 ab 4.640±0.30 cde 6.625±0.29 cd 1.749±0.1 abc 6 3.808±0.26 cd 26.2±0.01 d
ITA 310 (5) 8.999±0.31 f 1.846±0.06 b 4.877±0.15 abcde 6.522±0.35 d 1.643±0.08 c 3.971±0.15 bcd 20.6±0.01 f
Red Afaa (6) 9.138±0.22 ef 2.028±0.16 a 4.531±0.37 e 6.435±0.29 d 1.868±0.13 a 3.452±0.16 e 27.2±0.01 bcd
IR 54 (7) 9.929±0.35 bcd 2.049±0.10 a 4.852±0.20 bcde 7.139±0.35 abc 1.788±0.11 abc 3.997±0.15 bcd 28.5±0.01 bc
KILOMB(8) 10.02±0.60 abc 1.991±0.17 ab 5.057±0.41 abc 7.501±0.32 ab 1.814±0.06 a 4.169±0.22 ab 27.3±0.01 bcd
IR 64 (9) 9.072±0.63 f 1.989±0.07 ab 4.565±0.33 de 6.600±0.50 cd 1.786±0.06 abc 3.697±0.27 de 26.5±0.01 cd
Kahogo (10) 9.952±0.47 abc 2.012±0.12 ab 4.961±0.35 abcde 6.981±0.27 bcd 1.783±0.09 abc 3.924±0.24 bcd 27.5±0.01 bcd
Saro 5 (11) 9.855±0.42 bcde 1.939±0.12 ab 5.096±0.32 ab 7.078±0.31 abc 1.744±0.14 abc 4.075±0.26 abc 27.5±0.01 bcd
Wahiwahi(12) 10.666±0.65 a 2.017±0.16 ab 5.302±0.29 a 7.540±0.44 a 1.804±0.08 ab 4.130±0.15 ab 28.4±0.02 bc
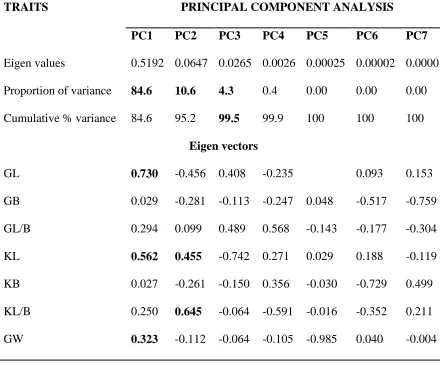
4.1.2 Principal Component Analysis (PCA)
The principal component analysis (PCA) was carried out to investigate the
morphological traits that played a key role in phenotypic diversity among the rice
varieties. It provided the eigen values and percent of variation for seven principal
component axes across 13 rice varieties as shown in table 4.2. It was found that the
first three principal components jointly accounted for 99.5% of the total variation
among all the studied varieties. Combination of the first and the second principal
components accounted for 95.2% of the total variation among the seven component
axes of the total rice varieties.
Principal component 1 (PC1) had 84.6% of the total variation where all the traits;
grain length, grain breadth, grain length / breadth ratio, kernel length, kernel length /
breadth ratio and grain weight contributed positively. Of all, three traits; grain
length, kernel length and grain weight had a notably major contribution to PC1. In
the case of Principal Component 2 (PC2), three traits; grain length / breadth ratio,
kernel length / breadth ratio and kernel length contributed positively and accounted
for 10.6% of the total morphological variability.
On the other hand, grain length, grain breadth, kernel breadth and grain weight traits
were negatively associated with PC2.
The first two principal components efficiently separated most of the improved
together as shown in figure 4.1. Basmati varieties clustered in a separate group
distantly from the other varieties and this correspond well with their slender grains.
The GL, KL, GW and KL/B were found to be the major contributors of PC1 and
PC2.
Table 4.2: Eigen values and percent of variation for 7 principal component axes in 13 rice varieties
TRAITS PRINCIPAL COMPONENT ANALYSIS
PC1 PC2 PC3 PC4 PC5 PC6 PC7
Eigen values 0.5192 0.0647 0.0265 0.0026 0.00025 0.00002 0.0000
Proportion of variance 84.6 10.6 4.3 0.4 0.00 0.00 0.00
Cumulative % variance 84.6 95.2 99.5 99.9 100 100 100
Eigen vectors
GL 0.730 -0.456 0.408 -0.235 0.093 0.153
GB 0.029 -0.281 -0.113 -0.247 0.048 -0.517 -0.759
GL/B 0.294 0.099 0.489 0.568 -0.143 -0.177 -0.304
KL 0.562 0.455 -0.742 0.271 0.029 0.188 -0.119
KB 0.027 -0.261 -0.150 0.356 -0.030 -0.729 0.499
KL/B 0.250 0.645 -0.064 -0.591 -0.016 -0.352 0.211
Figure 4. 1:Scatter plot of 13 rice varieties based on the first two principal components
4.1.3 Cluster analysis of rice varieties based on morphological traits
Cluster analysis grouped the 13 rice varieties into two distinct major clusters I and II
with a similarity index of 1.25 therebyrevealing presence of high diversity as shown
in figure 4.2. Cluster I was the largest with 8 rice varieties whereas cluster II had only
5. Cluster I was further subdivided into three other sub clusters CIA, CIB andCIC
where Wahiwahi, a landrace, formed its own sub cluster, CIA. Sub cluster CIB
contained two other smaller groups i and ii.
Among these two groups, Supa, an improved aromatic variety, clustered close
improved aromatic variety clustered together with two other varieties from the same
origin. In sub cluster CIC, improved aromatic Basmati genotypes clustered together
with a similarity coefficient of 0.43.
Cluster II contained four improved rice varieties and only one land race where ITA 310 showed parentage to the rest of the varieties on the pedigree. Two improved varieties from Kenya in this cluster, IR2793 and BW 196 were the most similar with a
similaritycoefficient of 0.21. The relationship among the 13 rice varieties was
revealed by the dendrogram as shown in figure. 4.2.
Figure 4.2:Dendrogram generated by cluster analysis of morphological characters. Wah iwah i Supa Kilo mbe ro Saro 5 Kah ogo IR 5
4 BS 370 BS 217 ITA 310 Red Afa a IR 6
4
BW 196 IR 2
793 1.25 0.83 0.42 0.00 Varieties S im il a ri ty
I
II
CIC
ii
i
CIB
CIA
0.53 1.25 1.25 1.01 0.43 0.790.57 0.57 0.39
4.2 Determination of genetic diversity
4.2.1 Quality of extracted DNA
It was found that the entire DNA was intact and of good quality as shown in plate 4.1.
The numbers on the gel photo represent the lab codes assigned to each of the rice
samples as indicated on table 3.1.
Plate 4.1:A gel picture showing thirteen rice DNA samples extracted using CTAB method. Sample code numbers 1 to 5 represent the Kenyan samples whereas samples 6 to 13 represent the Tanzanian samples.
The purity of the extracted DNA was found to be above 1.8 whereas the
concentration of the DNA was on an average 428.72 ng per µl and was used for
subsequent SSR analysis.
4.2.2 Simple Sequence Repeat (SSR) analysis, allele number, PIC and
Heterozygosity estimates
4.2.2.1Simple Sequence Repeat (SSR) analysis
It was found that of all the SSR markers used in this study, only RM 42 was
monomorphic and was present at the same level. This marker which is tightly linked
The othereight markers utilized showed clear and consistence banding patterns and
were chosen for assessment of genetic diversity among the varieties. RM 339 and RM
241 rice microsatellite markers demonstrated distinct bands in most of improved
aromatic rice varieties compared to all other varieties.
Marker RM 339, revealed considerable level of divergence among the different rice
varieties as shown in plate 4.2. Several bands presented by the microsatellite markers
were shared between aromatic and non-aromatic varieties as shown in plate 4.2.
Plate 4.2:SSR banding pattern of 13 landraces and improved rice varieties from Kenya and Tanzania generated bymarker RM 339. The lanes represent Mw- 100bp molecular weight ladder; lane 1: IR 2793; lane 2: BS 217; lane 3: BS 370; lane 4: BW 196; lane 5: ITA310; lane 6: Red Afaa; lane 7: IR 54; lane 8: Kilombero; lane 9: IR 64; lane 10: Kahogo; lane 11: Saro 5; lane 12: Wahiwahi; lane 13: Supa.
4.2.2.2 Number of alleles
The ability of each of the eight microsatellite markers to determine genetic diversity
among the varieties varied. A total of 25 alleles were detected from the 13 varieties
using the eight SSR markers as shown in table 4.3. The allelic richness per locus
generated by each marker varied from 2 for RM 282 to 4 for RM 241 and RM 339
Mw 1 2 3 4 5 6 7 8 9 10 11 12 13
200 bP
with an average of 3.125 alleles per locus. Maximum number of alleles per loci was
obtained with markers RM 241 and RM 339.
The number of alleles detected by particular markers provides an estimation of
genetic diversity. This indicated that markersRM 241 and RM 339 were the most
informative for the 13 test genotypes hence most suitable for diversity studies. The
minimum number of polymorphic alleles was observed with marker RM 282. As
shown in table 4.3, there was no association between the number of alleles detected
and the number of SSR repeat motifs. The loci with the repeat motif varying from
(GA) 11 to (GA) 15 did not show any association with the number of alleles detected.
4.2.2.3 Rare alleles
Alleles observed in less than 5% of all the rice varieties (commonly termed as rare)
were investigated and identified at three loci RM 277, RM 241 and RM 339. A total
of 5 rare alleles (20%) were detected with maximum number being observed at RM
241 followed by RM 339. Five of the rice varieties (38%) showed rare alleles. ITA 310, Wahiwahi and Supa had one rare allele each while IR 2793 had two rare alleles.
It was found that markers RM 241 and RM 339 which detected a higher number of
alleles (4) also detected more rare alleles.
4.2.2.4Polymorphic Information Content (PIC) values
The level of polymorphism among the 13 rice varieties was evaluated by calculating
each marker. The PIC values varied from 0.292 on RM 282 to 0.641 on RM 339 with
an average of 0.5019 per locus as shown in table 4.2. The varying PIC values
generated by the markers served as an indicator of the discriminating power of a
particular marker by taking into account the number of alleles at each locus and their
relative frequencies among the tested varieties.
Six out of the eight markers (RM 277, RM 252, RM 241, RM 339, RM 215 and RM
225) had PIC values of above 0.5. On this basis, RM 339 was considered the best
marker for the 13 test genotypes. The results were summarized in table 4.3.
4.2.2.5 Heterozygosity
No heterozygosity was observed (Ho=0) across the varieties whereas expected
heterozygosity (He) which is reflected by the gene diversity at each locus ranged
from 0.355 to 0.698 with an average value of 0.604. Heterozygosity deficiency