Available online: https://edupediapublications.org/journals/index.php/IJR/ P a g e | 747
Heat transfer enhancement through inner grooved copper
tubes with different tube parameters
1]
K.Sudheer Kumar,
[2]M.Sabitha,
[3]N.Srinivas
Assistant professor, Dept. Mechanical engineering Vaageswari College of Engineering.
karimnagar , india
E-Mail:
sudheer.010203@gmail.com
,
msabitha327@gmail.com
,srinivas.nallala@gmail.com
.
Abstract
This paper presents the evaluation of heat transfer coefficients for the flow of R22 through internally grooved copper tubes. A series of tests were conducted using two types of tubes namely Tube A and Tube B, which have different tube parameters. The straight and horizontal test section of the test apparatus with a length of 3.67 m was heated or cooled by water circulated in a surrounding annulus. Condensation tests were conducted at mass flux rates of 180 to 537 kg/m2s and the vapor qualities ranged from a nominal value of 83% at the test section inlet to 6% at the outlet. Evaporation tests were conducted at mass flux rates of 110 to 404 kg/m2s and the nominal vapor qualities at the inlet and outlet were 0 and 85%, respectively. For both the condensation and evaporation tests, the heat transfer coefficients are found to increase as the mass flux rate increases.
Keywords: Inner grooved tubes; Heat transfer; Condensation; Evaporation.
1. Introduction
Heat exchangers are devices that allow heat transfer between two fluids that are at different temperatures without physical contact between them. Heat exchangers are essential components in complex engineering systems related to energy generation and energy transformation in industrial scenarios. As the energy sources are limited and for their conservation, appropriate design and optimization of heat exchangers are very important. Therefore, compact heat exchangers that have low -weight and high level of performance must be designed for the heat-exchanger industry. One of the passive techniques to enhance heat transfer coefficient is the use of microfin tubes. Numerous researchers have carried out experiments to study the effect of fin geometry and, the flow of different refrigerants to the performance of microfin tubes. Enhanced surfaces have been successfully used in the heat transfer industry to obtain more compact and efficient units. Heat transfer enhancement technology has been widely used in heat exchanger in the refrigeration, automotive and process industries [1-3]. Due to the various types of tube parameters that need to be considered by the manufacturers, it is important to evaluate the performance of the tube with respect to the heat transfer coefficient. As a result, the tubes can be classified for
different applications based on the requirement of different heat exchangers. Therefore, the objective of this paper is to present the evaluation of condensation and refrigeration heat transfer performances of two types of mirofin tubes namely Tube A and Tube B.
2. Literature review
Heat transfer continues to be a major field of interest to engineering and scientific researchers, as well as designers, developers, and manufacturers. The heat transfer enhancement has been analyzed by various methods in order to have compact heat exchangers. Numerous researchers [4-17] have proposed condensation heat transfer and pressure drop correlations for inner grooved tubes. Newell and Shah [18] reviewed the characteristic of two-phase heat transfer, pressure drop, and the effect of void fraction in inner grooved tubes. Valladares [19] reported that additional work was needed to develop a generalized heat transfer correlation for inner grooved tubes. Wang and Honda [20] evaluated the existing condensation heat transfer correlations for inner grooved tubes with their collected experimental heat transfer data. Wang et al. [21] compared the condensation frictional pressure drop correlations for inner grooved tubes and reported that the Goto et al.’s [7]
March 2018
Available online: https://edupediapublications.org/journals/index.php/IJR/ P a g e | 748 Ligrani et al. [22] have compared heat transfer
augmentation techniques. Heat transfer augmentation techniques for several geometries and boundary conditions have been examined in previous works and reported in [23-25]. There have been some works on grooved surfaces in channels or tubes [26-28]. The heat transfer increase and pressure drop in the helically grooved, horizontal micro-fin tubes were investigated by Wang et al. [27]. Many kinds of internally grooved tubes have been investigated to improve the performance of air-conditioning heat exchangers for HFC refrigerants [7]. Park & Choi [26] have shown that grooved or fluted tubes are widely used in modern heat exchangers. Brognaux et al. [29] expressed heat transfer and friction characteristics for single-phase flow in single-grooved and cross grooved micro-fin tubes. They have found that the microfin tubes have enhanced heat transfer to as high as 1.8 times that of smooth tubes. Three dimensional flow and augmented heat transfer in a symmetrically grooved channel have been analyzed by Greiner et al. [30]. They have carried out their analysis for a Reynolds number variation of 180-1600 with constant temperature boundary condition. Considerable efforts are also devoted in order to determine heat transfer coefficient for evaporation by using different shape of fins [31-42].
Evaporation and condensation heat transfer inside of an internally grooved horizontal tube were measured and reported that local heat transfer coefficients of the herringbone-grooved tube were about twice as large as those of the spiral-ribbed tube for condensation and only slightly larger for evaporation
[7]. A smooth tube and an internally ribbed tube were compared for flow boiling heat transfer performance [43]. The spirally, internally ribbed tube gave 1.4 - 2 times the heat transfer coefficient and about the same increase in two phase pressure drop. A horizontal, microfinned tube was evaluated for evaporation performance [44]. There was a noted improvement with microfinning over the performance of the smooth tube. Evaporation of R-134a in a heated capillary tube was experimentally documented [45]. A correlation predicting the under-pressure of vaporization for capillary tube was
developed. Survival of a vapor bubble within a macrochannel was described [46].
3. Materials and method
This section consists of several subsections highlighting the materials used during the test and the experimental procedure to evaluate the heat transfer coefficients of internally grooved copper tubes.
3.1 Test facility
The test used to conduct this study is capable of measuring in-tube average and local heat transfer coefficients for a variety of refrigerants and flow conditions. The test facility has four main parts, i.e, (i) a test section, (ii) a refrigerant loop, (iii) a water loop, and (iv) a data acquisition system. The following sections give detailed description of these four main parts of the test facility. A schematic drawing of the test facility is shown in Figure 1.
3.2 Test section
The test section is a tube -in tube counter flow heat exchanger. The test tube is the inner tube of the heat exchanger. The diameter of the inner tube can be varied depending on the size of the tube is being tested, however the tube length is 3.67 m. The annulus, surrounding of the refrigerant tube, is also 3.67 m long with an inner diameter of 17.2 mm. Two tubes namely
Tube-A and Tube -B with different parameters are tested. Details of the tube parameters are depicted in Table 1. The inner tube is centered and secured in the annulus by a series of spacers. The water in the annulus flows counter to the refrigerant flow and is used to heat or cool the refrigerant depending on the test that is being performed. For example, in the
.
Available online: https://edupediapublications.org/journals/index.php/IJR/ P a g e | 749 Figure 1. Schematic of the test facility
Table 1. Details of the tubes
Tube Parameter Tube A Tube B
Outer diameter, do (mm) 7.00 7.00 Inner diameter, di (mm) 6.50 6.36 Number of grooves, n 50 55 Groove height, h (mm) 0.21 0.20
Apex angle, γ 40º 20º
Helix angle, α 18º 20º
Bottom wall thickness (mm) 0.25 0.32 Total wall thickness (mm) 0.46 0.52
Unit weight (g/m) 61 70
3.3 Refrigeration loop
March 2018
Available online: https://edupediapublications.org/journals/index.php/IJR/ P a g e | 750 The accumulator controls the pressure in the test section, and also helps to dampen out pressure fluctuations that may occur in the system. The quality of the refrigerant entering the test section is set by a heater located directly upstream of the test section. The heater consists of a 12.7 mm outside diameter by 2.63 m long stainless steel tube heated by direct current. The heater is electrically isolated from the rest of the system by a high pressure rubber hose. Directly upstream from the boiler is a superheater, which consists of a heat tape wrapped around a 3/8-inch diameter copper tube. For this study, the superheater was not used. The refrigerant mass flow rate is measured by a coriolis type mass flow meter accurate to 0.15% of the mass flow rate plus 2.25e-05 kg/s.
3.4 Water loop
The water loop consists of a centrifugal pump, an in-line electric heater, and a heat exchanger. The mass flow rate is controlled by a valve that restricts the flow of water. The temperature of the water entering the test section is controlled by the electric heater and the heat exchanger, which uses building’s supplied chilled water to cool the water in the test loop. The water mass flow rate is measured by a coriolis type flow meter with an accuracy of 0.15% of the mass flow rate plus 2.25e-04 kg/s.
3.5 Data acquisition
Data acquisition is accomplished by a personal computer, a 40 channel scanner, and a multimeter. The controlling program on the personal computer is written in FORTRAN and controls the multimeter and the scanner via an IEEE-488 bus.
3.6 Experimental procedure
The test facility is allowed to reach steady state before final data acquisition is started. This is achieved by manually adjusting the mass flow rates, the boiler power, and the annulus water temperatures until the desired test conditions have been achieved. The data acquisition systems scan for temperature, mass flow rate, and pressure fluctuations. When the fluctuations are minimal, the final data acquisition program is run. During final data acquisition, each of the channels is scanned to a total five times except for pressure, which is scanned 35 times because of pressure drop fluctuations. The scans of each channel are then averaged and used in the data analysis to calculate the results. If any large deviations due to unsteady effects are detected, the run is aborted.
4. Data analysis
Raw data from the data acquisition system are analyzed for each run to determine the in -tube convective heat transfer coefficient and the quality change. The main equations used in processing the raw data are based on energy balance. The energy transferred in the test section is computed from an energy balance on the water side,
q
w
=
m
w
c
p,w(
T
w,out
−
T
w,in
)
(1) This energy transfer is then used to determine the quality change of the refrigerant in the test section by using the following equation,
q
w
∆
X
=
m
r
h
fg
(2)
The vapor quality entering the test section is calculated from an energy balance on the refrigerant boiler. The heat output from the boiler, qh, is calculated from voltage and current readings. The heat input to the refrigerant takes two forms, sensible and latent, which can be expressed as:
q
sens
=
m
r
c
p,r
(
T
r,sat
−
T
h,in
)
(3)
Available online: https://edupediapublications.org/journals/index.php/IJR/ P a g e | 751
q
lat
=
m
r
h
fg
X
h,out (4)
The saturation temperature of the refrigerant entering the boiler is determined from the pressure of the refrigerant entering the test section. Equations 3 and 4 are used to determine the quality of the refrigerant entering the test section where the outlet quality of the heater, Xh,out, is equal to the inlet quality of the test section, Xin as,
1
q
hX in = − cp,r
(
Tsat − Th,in)
(5)h
fg
mr
The refrigerant side heat transfer coefficient is determined from the overall heat transfer coefficient and the annulus side heat transfer coefficient, ho, which is determined using the modified Wilson plot technique [43]. The overall heat transfer coefficient is determined from the energy balance on the test section as,
U o
=
qw
(6)Ao
∆
Tlm
The log mean temperature difference,
(
∆Tlm)
from the inlet and outlet temperatures on both the water and refrigerant sides is,∆
Tlm
=
∆
T
1
− ∆
T
2
(7)∆
T
1
∆
T
ln2
where
∆
T
1
=
T
r,out
−
T
w,in (8)
∆
T
2
=
T
r,in
−
T
w,out (9)
Assuming the negligible thermal resistance of the copper tubing, the refrigerant side heat transfer coefficient is then determined as,
h
i
=
1
(10)
1
−1
Ai
h
A
U
o
o o
The heat transfer coefficient determined in this equation is an average value over the whole length of the tube.
5. Results and discussions
This section covers the presentation of key findings on the heat transfer enhancement through internally grooved copper tubes.
5.1 Convection heat transfer coefficient
March 2018
Available online: https://edupediapublications.org/journals/index.php/IJR/ P a g e | 752
than one day to finish one refrigerant flow. The results of two phase condensation as well as evaporation testing are recorded in Table 2, Table 3, Table 4, and Table 5 where the values of Uo obtained are used to
calculate the ho and hi for the respective water flows.
Table 2. Two phase condensation experimental results for Tube A
Parameters Results
Water mass flow rate, Fw (kg/s) 0.2011 0.1799 0.1282 0.1114 Refrigerant mass flow rate, Fr (kg/s) 0.0179 0.0151 0.0097 0.0059
Water inlet temperature, Tw,in (°C) 25.31 25.66 28.60 30.83
Water outlet temperature, Tw,out (°C) 28.28 28.26 31.00 32.28
Pressure drop of refrigerant, ∆Pr (kPa) 46.8 36.9 16.7 7.5
Quality of refrigerant at inlet, X,in 0.80 0.82 0.83 0.78
Quality of refrigerant at outlet X,out 0.04 0.06 0.05 0.10
Vapor quality, ∆X 0.76 0.76 0.78 0.68
Mass flux (kg/m2s) 538 456 293 179
Heat transfer coefficient, Uo (W/m 2
K) 3045 2837 2364 2221
Table 3. Two phase condensation experimental results for Tube B
Parameters Results
Water mass flow rate, Fw (kg/s) 0.1800 0.1725 0.1283 0.1114 Refrigerant mass flow rate, Fr (kg/s) 0.0171 0.0144 0.0093 0.0057
Water inlet temperature, Tw,in (°C) 25.67 26.78 28.71 30.83
Water outlet temperature, Tw,out (°C) 28.64 29.26 30.91 32.28
Pressure drop of refrigerant, ∆Pr (kPa) 44.5 32.0 16.0 6.6
Quality of refrigerant at inlet, X,in 0.83 1.00 0.83 0.78
Quality of refrigerant at outlet X,out 0.06 0.27 0.09 0.10
Vapor quality, ∆X 0.77 0.73 0.74 0.68
Mass flux (kg/m2s) 537 452 293 180
Heat transfer coefficient, Uo (W/m 2
K) 3063 2920 2473 2214
Table 4. Two phase evaporation experimental results for Tube A
Parameters Results
Water mass flow rate, Fw (kg/s) 0.1686 0.1628 0.1599 0.1133 Refrigerant mass flow rate, Fr (kg/s) 0.0133 0.0106 0.0066 0.0036
Water inlet temperature, Tw,in (°C) 16.54 14.68 12.06 10.40
Water outlet temperature, Tw,out (°C) 13.74 12.38 10.51 9.34
Pressure drop of refrigerant, ∆Pr (kPa) 50.60 30.40 13.40 3.70
Quality of refrigerant at inlet, X,in 0.07 0.01 0.01 0.01
Quality of refrigerant at outlet X,out 0.81 0.75 0.79 0.70
Vapor quality, ∆X 0.74 0.74 0.78 0.69
Mass flux (kg/m2s) 401 318 200 109
Heat transfer coefficient, Uo (W/m2K) 2659 2506 2251 1702
Available online: https://edupediapublications.org/journals/index.php/IJR/ P a g e | 753 Table 5. Two phase evaporation experimental results for Tube B
Parameters Results
Water mass flow rate, Fw (kg/s) 0.1689 0.1636 0.1596 0.1132
Refrigerant mass flow rate, Fr (kg/s) 0.0128 0.0102 0.0065 0.0035 Water inlet temperature, Tw,in (°C) 16.57 14.71 12.14 10.37
Water outlet temperature, Tw,out (°C) 13.71 12.41 10.48 9.15
Pressure drop of refrigerant, ∆Pr (kPa) 52.70 32.00 14.10 4.10 Quality of refrigerant at inlet, X,in 0.07 0.02 0.00 0.01 Quality of refrigerant at outlet X,out 0.85 0.79 0.85 0.83
Vapor quality, ∆X 0.78 0.77 0.85 0.82
Mass flux (kg/m2s) 404 322 204 110
Heat transfer coefficient, Uo (W/m2K) 2756 2432 2338 1662
The water side heat transfer coefficient, ho for condensation as well as evaporation for both tubes are
depicted in Figure 2 and Figure 3. Assuming the conduction resistance of the copper tube is negligible, hi
is the average value of heat transfer coefficient over the length of the tube, is determined by using the ho
values. The summary of hi values are depicted in Figure 4 for condensation and Figure 5 for evaporation.
March 2018
Available online: https://edupediapublications.org/journals/index.php/IJR/ P a g e | 754 Figure 3. Water side heat transfer coefficient (evaporation)
Available online: https://edupediapublications.org/journals/index.php/IJR/ P a g e | 755
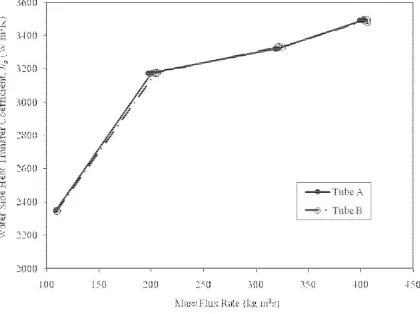
Figure 5. Refrigerant side heat transfer coefficient (evaporation)
It is evidence in Figure 2 (condensation) that the water side heat transfer coefficient (ho) increases as the mass flux rate increases. Both tubes show a similar pattern of increase of ho until a mass flux rate of 450 kg/m2s, beyond this mass flux rate, Tube B does not show drastic increase of ho. However, in the case of evaporation testing, no significant difference between water side heat transfer coefficient (ho) for both tubes are observed (Figure 3). Both tubes (Tube A and Tube B) have the same external properties, i.e., outer diameter, annulus, etc which produces the same Reynolds number. Therefore at a same mass flux rate, the heat transfer coefficient is also same. It is also interesting to observe that water side heat transfer coefficient during condensation test is higher than evaporation test. Condensation, here, means heat is removed by the tube to the water flowing through the annulus and opposite for the evaporation, i.e, heat is absorbed by the tube from the flowing water.
For refrigerant side heat transfer coefficient (hi), Tube B shows the superior heat transfer capability compared to Tube A in the case of condensation testing. Tube B shows more drastic increase in heat transfer coefficient compared to Tube A. Both tubes show
polynomial trends of the increase of heat transfer coefficient with reasonable correlation coefficient (R2 ), i.e., 0.83 for Tube A and 0.92 for Tube B, respectively. Tube B with more grooves per unit length is capable to absorb more heat from the hot refrigerant and remove to the cold water flowing through the annulus. This finding is also in line with the concept of heat transfer enhancement by increasing the area perpendicular to the heat flow line, which initiated the innovation of inner grooved tubes [1].
March 2018
Available online: https://edupediapublications.org/journals/index.php/IJR/ P a g e | 756 the polynomial trends with reasonable
correlation coefficients (R2) , i.e., 0.99 for Tube A and 0.87 for Tube B, respectively.
6. Conclusion
The condensation and evaporation tests of the inner grooved copper tubes namely Tube A and Tube B with different tube parameters were carried out to identify the suitability of using these tubes in enhancing heat transfer in heat exchanger. For both cases, i.e., condensation and evaporation, it is found that Tube B could perform better compared to Tube A. Heat transfer coefficient for Tube B is higher than that of Tube A. For both tubes, refrigerant side heat transfer coefficient is almost directly proportional to the mass flux rate.
Acknowledgements
The authors would like express their best gratitude to conduct the necessary testing.
References
[1] Chamra, L., Webb, R. and Randlett, M. 1996. Advanced microfin tubes for condensation. Int. J Heat Mass Transfer, 39: 1839-1846.
[2] Jung, D., Cho, Y. and Park, K. 2004. Flow condensation heat transfer coefficients of R22, R134a, R407C, and R410A inside plain and microfin tubes. Int. J Refrig, 27:25-32.
[3] Zimparov, V. 2002. Energy conservation through heat transfer enhancement techniques. Int. J Energy Resources, 26:675-696.
[4] Nozu, S. and Honda, H. 2000. Condensation of refrigerants in horizontal, spirally grooved microfin tubes: Numerical analysis of heat transfer in the annular flow regime. J Heat Transfer, 122:80-91.
[5] Cavallini, A., Col, D.D., Doretti, L. Longo, G.A. and Rossetto, L. 2000. Heat transfer and pressure drop during condensation of refrigerants inside horizontal enhanced tubes. Int. J Refrig, 23:4-25.
[6] Choi, J.Y., Kedzierski, M.A. and Domanski, P.A. 2001. Generalized pressure drop correlation for evaporation and condensation in smooth and microfin tubes. In: Proceedings of IIFIIR Commision B1, Paderborn, Germany, vol.B4, p.9-1.
[7] Goto, M., Inoue, N. and Ishiwatari, N. 2001. Condensation and evaporation heat
transfer of R410A inside internally grooved horizontal tubes. Int. J Refrig, 24:628-638.
[8] Han, D. and Lee, K.J. 2005. Experimental study on condensation heat transfer enhancement and pressure drop penalty factors in four microfin tubes. Int. J Heat Mass Transfer, 48:3804-3816.
[9] Cavallini, A., Censi, G., Col, D.D., Doretti, L., Longo, G.A. and Rossetto, L. 2001. Experimental investigation on condensation heat transfer and pressure drop of new HFC refrigerants (R134a, R125, R32, R410A, R236ea) in a horizontal smooth tube. Int. J Refrig, 24:73-87.
[10] Kim, M.H. and Shin, J.S. 2005. Condensation heat transfer of R22 and R410A in horizontal smooth and microfin tubes. Int. J Refrig, 28:949-957.
[11] Miyara, A., Nonaka, K. and Taniguchi, M. 2000. Condensation heat transfer and flow pattern inside a herringbone-type micro-fin tube. Int. J Refrig, 23:141-152. [12] Goto, M., Inoue, N. and Yonemoto, R.
2003. Condensation heat transfer of R410A inside internally grooved horizontal tubes. Int. J Refrig, 26: 410-416.
[13] Jung, D. Kim, C.B., Hwang, S.M. and Kim, K.K. 2003. Condensation heat transfer coefficients of R22, R407C, and R410A on a horizontal plain, low fin, and turbo-C tubes. Int. J Refrig, 26:485-491. [14] Miyara, A., Otsubo, Y., Ohtsuka, S. and
Mizuta, Y. 2003. Effects of fin shape on condensation in herringbone microfin tubes. Int. J Refrig, 26:417-424.
[15] Kumar, R., Varma, H.K., Mohanty, B. And Agrawal, K.N. 2002. Prediction of heat transfer coefficient during condensation of water and R-134a on single horizontal integral-fin tubes. Int. J Refrig, 25:111-126.
[16] Jung, D., Cho, Y. and Park, K. 2004. Flow condensation heat transfer coefficients of R22, R134a, R407C, and R410A inside plain and microfin tubes. Int. J Refrig, 27:25-32.
Available online: https://edupediapublications.org/journals/index.php/IJR/ P a g e | 757 [18] Newell, T.A. and Shah, R.K. 2001. An
assessment of refrigerant heat transfer, pressure drop, and void fraction effects in microfin tubes. Int. J HVA & R Res, 7(2):125-153.
[19] Valladares, G.O. 2003. Review of in-tube condensation heat transfer correlations for smooth and microfin tubes. Heat Transfer Engineering, 24(4): 6-24. [20] Wang, H.S. and Honda, H. 2003.
Condensation of refrigerants in horizontal microfin tubes: comparison of prediction methods for heat transfer. Int. J Refrig, 26:452-460.
[21] Wang, H.S., Rose, J.W. and Honda, H. 2003. Condensation of refrigerants in horizontal microfin tubes: comparison of correlations for frictional pressure drop. Int. J Refrig, 26:461-472.
[22] Ligrani, P.M., Oliveira, M.M. and Blaskovich, T. 2003. Comparison of heat transfer augmentation techniques. AIAA J, 41:337-362.
[23] Adachi, T. and Uehara H. 2001. Correlation between heat transfer and pressure drop in channels with periodically grooved parts. Int. J Heat Mass Transfer, 44:4333-4343.
[24] Wang L. and Sund´en, B. 2002. Performance comparison of some tube inserts. Int. Comm Heat Mass Transfer, 29(1):45-56.
[25] Yang, Y.T. and Hwang, C.Z. 2003. Calculation of turbulent flow and heat transfer in a porous-based channel. Int. J Heat Mass Transfer, 46:771-780.
[26] Park, I.S. and Choi, D.H. 2001. Heat and mass-transfer analysis of the condensing film flow along a vertical grooved tube. Int. J Heat Mass Transfer, 44:4277-4285. [27] Wang, H.S., Rose, J.W. and Honda, H.
2003. Condensation of refrigerants in horizontal microfin tubes: comparison of correlations for frictional pressure drop. Int. J Refrig, 26:461-472.
[28] Izumi, M., Kumagai, S., Shimada, R. and Yamakawa, N. 2004. Heat transfer enhancement of dropwise condensation on a vertical surface with round shaped grooves. Exp. Therm Fluid Sci, 28:243-248.
[29] Brognaux, L.J., Webb, R.L., Chamra, L.M. and Chung, B.Y. 1997. Single-phase heat transfer in micro-fin tubes. Int. J Heat Mass Transfer, 40:4345-4357. [30] Greiner, M., Faulkner, R.J., Van, V.T.,
Tufo, H.M. and Fischer, P.F. 2000.
Simulations of three-dimensional flow and augmented heat transfer in a symmetrically grooved channel. Trans. ASME, 122:653-660.
[31] Wellsandt, S. and Vamling, L. 2005. Evaporation of R407C and R410A in a horizontal herringbone microfin tube: heat transfer and pressure drop. Int. J Refrig, 28:901-911.
[32] Yun, R., Heo, J.H. and Kim, Y. 2006. Evaporative heat transfer and pressure drop of R410A in Microchannels. Int. J Refrig, 29:92-100.
[33] Wellsandt, S. and Vamling, L. 2005. Prediction method for flow boiling heat transfer in a herringbone microfin tube. Int. J Refrig, 28:912-920.
[34] Hu, H., Ding, G., and Wang, K. 2008. Heat transfer characteristics of R410A–oil mixture flow boiling inside a 7 mm straight microfin tube. Int. J Refrig, 1-13, doi:10.1016/j.ijrefrig.2007.12.004.
[35] Wellsandt, S. and Vamling, L. 2005. Evaporation of R134a in a horizontal herringbone microfin tube: heat transfer and pressure drop. Int. J Refrig, 28:889-900.
[36] Kim, Y., Seo, K. and Chung, J.T. 2002. Evaporation heat transfer characteristics of R-410A in 7 and 9.52 mm smooth/micro-fin tubes. Int. J Refrig, 25:716-730.
[37] Kim, Y.J., Cho, J.M. and Kim, M.S. 2008. Experimental study on the evaporative heat transfer and pressure drop of CO2 flowing upward in vertical smooth and micro-fin tubes with the diameter of 5 mm. Int. J Refrig, 1-9, doi:10.1016/j.ijrefrig.2007.12.001. [38] Rahman, M.M. and Ling, Y.M. 2008.
Heat transfer enhancement through inner grooved copper tubes. In: The Scientific Conference III, Bangi-Malaysia: 19 January 2008.
[39] Afroz, H.M.M. and Miyara, A. 2007. Friction factor correlation and pressure loss of single-phase flow inside herringbone microfin tubes. Int. J Refrig, 30:1187-1194.
[40] Islam, M.A. and Miyara, A. 2007. Liquid film and droplet flow behaviour and heat transfer characteristics of herringbone microfin tubes. Int. J Refrig, 30:1408-1416.
March 2018
Available online: https://edupediapublications.org/journals/index.php/IJR/ P a g e | 758 helically coiled tube. Int. J Heat Mass
Transfer, 51:169-175.
[42] Behabadi, M.A.A., Kumar, R. and Mohseni, S.G. 2007. Condensation heat
transfer of R-134a inside a microfin tube with different tube inclinations. Int. J Heat Mass Transfer, 50:4864-4871.
[43] Ferna´ndez-Seara, J., Uhı´a, F.J. and Sieres, J. 2007. Campo A. A general review of the Wilson plot method and its modifications to determine convection coefficients in heat exchange devices. Appl. Therm Eng, 27:2745-2757.
[44] Yashar, D.A., Wilson, M.J., Kopke, H.R., Graham, D.M., Chato, J.C. and Newell, T.A. 2001. An investigation of refrigerant void fraction in horizontal, microfin tubes. HVAC&R, Res., 7(1): 67-76.
[45] Chen, D.K. and Lin, S. 2001. Underpressure of vaporization of refrigerant R-134a through a diabetic capillary tube. Int. J. Refrig, 24 (3): 261-272.