Open Access
R E S E A R C H
BioMed
Central
© 2010 Ibrahim et al; licensee BioMed Central Ltd. This is an Open Access article distributed under the terms of the Creative CommonsAttribution License (http://creativecommons.org/licenses/by/2.0), which permits unrestricted use, distribution, and reproduction in any medium, provided the original work is properly cited.Research
Measuring aortic pulse wave velocity using
high-field cardiovascular magnetic resonance:
comparison of techniques
El-Sayed H Ibrahim*
1, Kevin R Johnson
1, Alan B Miller
2, Jean M Shaffer
1and Richard D White
1Abstract
Background: The assessment of arterial stiffness is increasingly used for evaluating patients with different cardiovascular diseases as the mechanical properties of major arteries are often altered. Aortic stiffness can be noninvasively estimated by measuring pulse wave velocity (PWV). Several methods have been proposed for measuring PWV using velocity-encoded cardiovascular magnetic resonance (CMR), including transit-time (TT), flow-area (QA), and cross-correlation (XC) methods. However, assessment and comparison of these techniques at high field strength has not yet been performed. In this work, the TT, QA, and XC techniques were clinically tested at 3 Tesla and compared to each other.
Methods: Fifty cardiovascular patients and six volunteers were scanned to acquire the necessary images. The six volunteer scans were performed twice to test inter-scan reproducibility. Patient images were analyzed using the TT, XC, and QA methods to determine PWV. Two observers analyzed the images to determine inter-observer and intra-observer variabilities. The PWV measurements by the three methods were compared to each other to test inter-method variability. To illustrate the importance of PWV using CMR, the degree of aortic stiffness was assessed using PWV and related to LV dysfunction in five patients with diastolic heart failure patients and five matched volunteers. Results: The inter-observer and intra-observer variability results showed no bias between the different techniques. The TT and XC results were more reproducible than the QA; the mean (SD) inter-observer/intra-observer PWV differences were -0.12(1.3)/-0.04(0.4) for TT, 0.2(1.3)/0.09(0.9) for XC, and 0.6(1.6)/0.2(1.4) m/s for QA methods, respectively. The correlation coefficients (r) for the inter-observer/intra-observer comparisons were 0.94/0.99, 0.88/0.94, and 0.83/0.92 for the TT, XC, and QA methods, respectively. The inter-scan reproducibility results showed low variability between the repeated scans (mean (SD) PWV difference = -0.02(0.4) m/s and r = 0.96). The inter-method variability results showed strong correlation between the TT and XC measurements, but less correlation with QA: r = 0.95, 0.87, and 0.89, and mean (SD) PWV differences = -0.12(1.0), 0.8(1.7), and 0.65(1.6) m/s for TT-XC, TT-QA, and XC-QA, respectively. Finally, in the group of diastolic heart failure patient, PWV was significantly higher (6.3 ± 1.9 m/s) than in volunteers (3.5 ± 1.4 m/ s), and the degree of LV diastolic dysfunction showed good correlation with aortic PWV.
Conclusions: In conclusion, while each of the studied methods has its own advantages and disadvantages, at high field strength, the TT and XC methods result in closer and more reproducible aortic PWV measurements, and the associated image processing requires less user interaction, than in the QA method. The choice of the analysis technique depends on the vessel segment geometry and available image quality.
Background
The aorta sets the pattern for total systemic compliance of the central cardiovascular network. It expands rapidly
during systolic contraction of the left ventricle, temporar-ily accommodating 50% or more of its stroke volume, and then retracts during diastole, helping to maintain distal antegrade arterial flow and downstream organ perfusion, as well as proximal retrograde flow and pressure trans-mission for aortic valve closure and coronary
artery/myo-* Correspondence: elsayed.ibrahim@jax.ufl.edu
1 Department of Radiology, University of Florida College of Medicine,
Jacksonville, Florida, USA
Ibrahim et al.Journal of Cardiovascular Magnetic Resonance 2010, 12:26 http://www.jcmr-online.com/content/12/1/26
Page 2 of 13
cardial perfusion [1,2]. Maintaining the aortic viscoelastic properties is essential for proper cardiovascular physiol-ogy [3,4]. In recent years, a great deal of emphasis has been placed on the role of aortic stiffness as an indepen-dent contributor to the development of cardiovascular disease [5]. The assessment of arterial stiffness is increas-ingly used in clinical assessment of patients because the mechanical properties of arteries are altered in a variety of pathological states (e.g. coarctation of the aorta) [1]. Description of these alterations, and the manner by which vessel wall mechanics may influence the develop-ment of vascular pathology, would assist in understand-ing patient's cardiovascular condition and help plan appropriate therapy.
The assessment of aortic compliance has, until recently, required invasive methods and/or technically compli-cated procedures using pressure catheters [6]. Such approaches are not feasible for studying arterial wall motion and strain in human subjects [7]. Recently, nonin-vasive measurements have been made possible with Dop-pler ultrasound and cardiovascular magnetic resonance (CMR) [8-12]. There are several advantages to using CMR over Doppler ultrasound, such as the ability to view the entire vessel regardless of the vessel angle, depth, or acoustic window. Furthermore, reproducibility studies with Doppler ultrasound have revealed susceptibility to transducer placement and angle, factors that affect the apparent path length of the pulse wave [8].
Aortic stiffness can be noninvasively expressed using pulse wave velocity (PWV), which is the rate at which the flow or pressure wave propagates down the vessel [8,13,14]. PWV is directly related to vessel wall elasticity [15,16], and can be estimated by measuring resulting changes in flow or vessel diameter [17]. It is vessel wall characteristics, not the path curvature, that primarily determine PWV. The advantage of assessing distensibility from PWV is that it does not require pressure measure-ment, which is costly and requires specific medical expe-rience. PWV, in general, has previously been validated against pressure catheters in estimating vessel compli-ance [18]. CMR based approaches to PWV measurement have subsequently been validated in both phantoms [8,11] and in human subjects [19-24].
Several methods have been proposed to determine PWV using velocity-encoded CMR images, including transit-time (TT) [25], flow-area (QA) [23], and cross-correlation (XC) [26] methods. There have been assess-ments of reproducibility in normals [16,19,26,27] and non-tachycardic, normotensive patients with suspected coronary artery disease using 1.5 Tesla CMR methods [19]. However, the reproducibility and comparison of these different techniques have not yet been studied in a large diverse group of patients for relative durability and reproducibility of the CMR methods at any field strength,
moreover at 3 Tesla. In this work, the TT, QA, and XC techniques performed using high field strength CMR are tested on human subjects representing a range of cardio-vascular conditions, and compared to each other. Inter-observer, intra-Inter-observer, and scan-rescan variabilities are studied, along with the advantages and disadvantages of each technique.
Finally, to illustrate the importance of PWV using CMR, aortic stiffness is assessed in a group of five dia-stolic heart failure patients by measuring PWV, and the results are related to various parameters of diastolic dys-function and compared to results from volunteers. Dia-stolic heart failure is accompanied by an isolated abnormality in diastolic LV function and by reduced aor-tic compliance [28,29], which may play a significant role by impairing systemic load interaction with diastolic function and elevating cardiac metabolic needs under stress [30]. Thus, one factor that may contribute to dia-stolic heart failure pathophysiology is the abnormal ven-tricular-arterial interaction because of stiffening of both systems. This factor may result in increased cardiac energy needed to supply blood flow [30].
Methods Study population
Fifty consecutive cardiac patients referred to our imaging center, along with six normal volunteers, were scanned on a 3 Tesla CMR system (Magnetom TIM TRIO, Sie-mens Healthcare, Erlangen, Germany) with electrocar-diogram (ECG) gating. The study group was clinically diverse (Table 1) in order to assure relative durability and reproducibility of the tested methods. The patients were referred to our imaging facility due to various heart dis-eases including myocardial ischemia and viability (n = 25), non-ischemic heart disease (n = 10), ischemic myo-cardial damage (n = 5), semilunar valve stenosis (n = 4), hypertrophic obstructive cardiomyopathy (n = 4), myo-carditis (n = 1), and intracavity mass (n = 1). The patients were asked to participate in the study, which was approved by our Institutional Review Board. All patients and volunteers gave written informed consent.
CMR technique
refer-ence and velocity-encoded acquisitions (i.e. two RF pulses with 6.5 ms in-between); TE = 3 ms; true temporal resolution = 13 ms; interpolated reconstruction matrix = 256 × 192; flip angle = 15°; slice thickness = 8 mm; pixel size = 1.17 × 1.17 mm2; velocity encoding value (venc) =
150 cm/s (with concomitant gradient correction); num-ber of reconstructed heart phases = 128 with retro-gated acquisition; number of averages = 1; acceleration factor = 2 with separate pre-scan acquisition of reference lines; FOV = 300 mm; percent phase FOV = 75; average scan time = 26 s/slice of shallow breathing (average RR interval of 900 ms is assumed). The six volunteer scans were repeated with new table positioning and plane scouting to test inter-scan reproducibility.
Additional two sets of images were acquired in the sub-group of five diastolic heart failure patients and five nor-mal volunteers (Figure 1). The first set consisted of a series of cine short-axis (SAX) slices covering the LV from base to apex to calculate the LV blood volume, fill-ing rate, and myocardial thickness. The second set of images consisted of three SAX (basal, mid, and apical) and one four-chamber (4CH) cine tagged images to cal-culate myocardial strain. The imaging parameters for the cine SAX images were: 2D gradient-echo FLASH sequence; TR/TE = 40/1.2 ms; flip angle = 15°; slice thick-ness = 8 mm; # cardiac phases = 23; # averages = 1; pixel size = 1.8 × 1.8 mm2; bandwidth (BW) = 475 Hz/pixel;
scan time = 9 s (breath-hold). The imaging parameters for the tagged images were: TR/TE = 48/4 ms; flip angle = 12°; # cardiac phases = 25; tag separation = 7 mm; slice thickness = 8 mm; # averages = 1; pixel size = 1.5 × 1.5 mm2; BW = 185 Hz/pixel; scan time = 13 s (breath-hold).
Data analysis
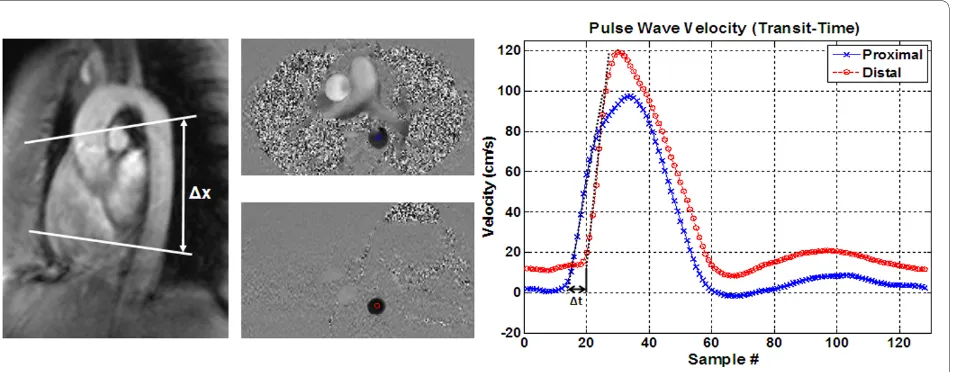
The images were transferred to a personal computer, where they were analyzed using in-house software cre-ated with MATLAB (The MathWorks, Inc., Natick, MA) on a 2.4 GHz personal computer. Three software modules were created to implement different PWV analysis tech-niques: TT, QA, and XC. The time required to analyze each set of images was computed with the help of a stop-watch to compare the efficiency of different techniques. The combination of the computer processing time and manual operator intervention (e.g. manual segmentation in the QA method) was reported. In the TT module, cross-sectional views (magnitude images) of the proximal and distal descending aorta were displayed, and the user was asked to pick a seed point at the center of each vessel cross-section (Figure 2). The program then accessed the sequence of velocity-encoded images to calculate blood flow velocity averaged across a small 5 × 5 pixels region-of-interest (ROI) centered at the seed point. In velocity-encoded images, the pixel gray level is proportional to blood velocity, where the proportionality constant depends on the venc value encoded in the pulse sequence: white and black represent the maximum veloc-ity (equal to the venc value) in the forward and backward directions, respectively. The travelling time (Δt) of the velocity waveform between the two sites was automati-cally calculated as the time duration between the onset of the curves, determined as the intersection point of the curve upslope and base velocity (Figure 2). Base velocity was defined as the minimum value of the first 10 points of the velocity waveform. The up-steeping edge was identi-fied by the line connecting the points at 20% and 80% of the maximum velocity in the waveform. It should be noted that other approaches have been previously
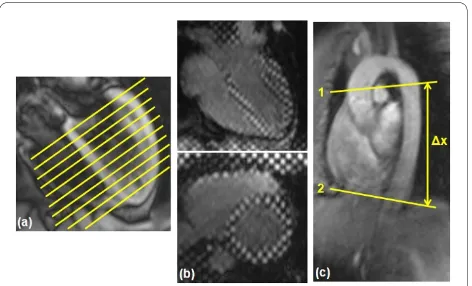
[image:3.595.305.541.95.238.2]consid-Figure 1 Acquired CMR images. Three sets of CMR images are ac-quired for the diastolic heart failure patients: (a) a stack of parallel short-axis cine images covering the left ventricle from base to apex to mea-sure the filling pattern and myocardial thickness. (b) Four-chamber (up) and short-axis (down) cine tagged images to measure myocardial strain. (c) Two velocity-encoded aortic cross sections, separated by dis-tance Δx to measure the pulse wave velocity.
Table 1: Diversity in the study group (mean ± standard deviation (SD))
Parameter Mean ± SD
Sex = 32 males & 18 females
Age (years old) 55 ± 17
Heart rate (beats per minute) 69 ± 14
Systolic/diastolic blood pressure (mm Hg)
140 ± 19/78 ± 14
End-diastolic LV volume (ml) 163 ± 55
Ejection fraction (% EDV) 55 ± 13
[image:3.595.56.293.123.333.2]Ibrahim et al.Journal of Cardiovascular Magnetic Resonance 2010, 12:26 http://www.jcmr-online.com/content/12/1/26
Page 4 of 13
ered for calculating the travelling time in the TT method [31] (e.g. peak systolic velocity, halfway up, or second derivative). PWV was computed as shown in Equation 1, with Δx as the distance along the centerline between the two cross-sections.
In the QA module, an enlarged view of the aortic cross-section was displayed frame-by-frame during the upslope of the velocity curve (10-15 frames). User-defined ROIs were drawn to define the vessel boundary in each frame (Figure 3), from which the vessel cross-sectional area (A) and blood flow (Q) were calculated, as in Equations 2 and 3:
where n is the number of pixels encountered within the vessel boundary; Δx and Δy are the pixel dimensions; and
vi is the blood velocity at pixel i. The relationship between blood flow and vessel cross-sectional area during early systole was approximated as a first-order linear equation using minimum squared error (Figure 3), and PWV is estimated as in Equation 4:
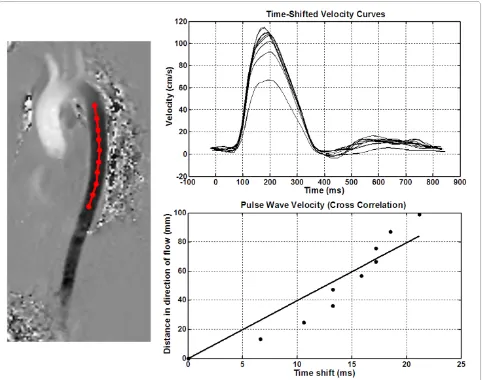
where ΔQ and ΔA are the change in total flow and aor-tic cross-sectional area. Finally, in the XC module, a sagit-tal view of the aorta was displayed, and the user was asked to select points along the centerline of the aorta
(Figure 4). The velocity waveform was calculated at each of the selected points by accessing the velocity-encoded images. Each velocity waveform was then cross-corre-lated with the waveform at the first point in order to cal-culate the phase shift between the velocity curves, or travelling time, in milliseconds. It should be noted that, due to its nature, the cross-correlation technique is not affected by varying vertical offsets in the velocity images. The relationship between the travelling times and the dis-tances between the points was approximated as a first-order linear equation using minimum squared error (Fig-ure 4), and the line slope was used as an estimate of PWV. The assumption of zero time-shift at zero distance is used in the line fitting. However, minor variations from this ideal case could be attributed to local differences in vessel wall characteristics across the aortic path, or to the fact that reflection waves were not considered in the analysis tool. It should be also noted that only one-directional (head to foot) velocity encoding was applied in the mea-suring sequence, which may not be ideal for curved aortic path.
The images were analyzed by two experts experienced in CMR to measure the inter-observer variability. One of the experts analyzed the images twice with a two week separation to measure the intra-observer variability. He also analyzed the measurements from the volunteers repeated scans to test the inter-scan reproducibility.
Despite the lack of gold-standard catheter measure-ments in this study, the relationship between PWV and pulse pressure (diastolic blood pressure - systolic blood pressure), and LV mass to (end diastolic) volume ratio (mvr) was studied to illustrate the value of PWV as an indicator of different cardiac parameters. To be consis-tent, this analysis was conducted on the uniform group of
PWV= Δx/Δt. (1)
A= ×n Δx×Δy, (2)
Q= ×A (v1++vn) / ,n (3)
[image:4.595.64.541.96.282.2]PWV= ΔQ/ΔA, (4)
ischemic patient (n = 25). LV mvr was used as it reflects the relationship between the chamber mass and volume, as previously described [32]. For this group of patients, the correlation coefficients were calculated between PWV and pulse pressure, and between PWV and mvr. In addition, the mean PWV was calculated, and the average pulse pressure and mvr values were calculated for the sub-groups with PWV above and below the mean value. Finally, the correlation coefficient between PWV and patient age was calculated for the whole study group.
The cine SAX images were transferred to a multi-modality workstation where they were semi-automati-cally analyzed (Argus software, Siemens Medical Solu-tions, USA) to determine LV blood volume, filling rate, and end-diastolic myocardial thickness. The tagged images were analyzed using the harmonic phase (HARP) [33] tool in Diagnosoft software to determine myocardial strain.
Statistics
Finally, the measurements from the different techniques were compared to each other: TT-XC, TT-QA, and XC-QA. Regression analysis was conducted between different methods, and measurement agreement was evaluated using the 95% limits-of-agreement approach proposed by Bland and Altman [34]. The differences significance was tested using paired t-test with p < 0.05 considered statis-tically significant.
Results
[image:5.595.57.538.97.326.2]Measured PWV values ranged from 1 m/s to 16 m/s, and showed good correlation with patient age (r = 0.81). The average processing times were 23 s, 31 s, and 110 s for the TT, XC, and QA methods, respectively. The Bland-Alt-man plots for inter-observer variabilities (Figure 5) showed no bias between the two observers using the TT or XC methods. All differences lied within the ± 2SD limit (mean (SD) PWV differences = -0.12 (1.3) m/s and 0.2 (1.3) m/s for the TT and XC methods, respectively). The QA method resulted in larger differences between the two observers (mean (SD) PWV difference = 0.6 (1.6) m/s). The correlation coefficients between the two observers (Figure 5) confirmed the Bland-Altman analy-sis: r = 0.94 (y = 1.06x - 0.3), 0.88 (y = 0.91x + 0.4), and 0.83 (y = 0.9x - 0.2) for the TT, XC, and QA methods, respectively. Figure 6 shows the results of the intra-observer analysis. The Bland-Altman mean (SD) PWV differences were -0.04 (0.4) m/s, 0.09 (0.9) m/s, and 0.2 (1.4) m/s, and the correlation coefficients were 0.99 (y = 0.99x + 0.067), 0.94 (y = 0.84x + 1.0), and 0.92 (y = 0.99x -0.23) for the TT, XC, and QA methods, respectively. The results showed no bias between the repeated measure-ments for all three methods. Figure 7 shows the results of the inter-scan reproducibility (for all three methods). Repeating the scan did not have large effect on the results (r = 0.96 (y=x+0.01) and mean (SD) PWV difference = -0.02 (0.4) m/s).
Ibrahim et al.Journal of Cardiovascular Magnetic Resonance 2010, 12:26 http://www.jcmr-online.com/content/12/1/26
Page 6 of 13
Figure 8 shows the regression analysis and Bland-Alt-man plots for the correlation between different tech-niques in estimating PWV (TT-XC, TT-QA, and XC-QA). The results showed strong correlation between TT and XC measurements (r = 0.95 (y = 0.87x + 0.95) and mean (SD) PWV difference = -0.12 (1.0) m/s). However, the TT and XC measurements showed less correlation with QA measurements (r = 0.87 (y = 0.89x - 0.28) and 0.89 (y = 1.1x - 1.2), and mean (SD) PWV differences = 0.8 (1.7) m/s and 0.65 (1.6) m/s for TT-QA and XC-QA, respectively). No significant differences were found between the different methods (P > 0.05).
Despite the lack of gold standard catheter measure-ments in this study, the measured PWV showed good correlation with pulse pressure (r = 0.73) and mvr (r = 0.69) in the group of ischemic patients (n = 25). The mean PWV in this group was 6.7 m/s. The subgroup of patients with PWV above the mean value (n = 11) had average
PWV, pulse pressure, and mvr significantly (P < 0.02) larger than those with PWV below the mean value: 4.9 m/ s, 70 mmHg, and 1.1 versus 9 m/s, 55 mmHg, and 0.9, respectively.
[image:6.595.58.541.95.475.2]The results from the diastolic heart failure patients showed the LV filling mechanism to be significantly dif-ferent compared to volunteers (Figure 9). The patients' flow curves showed diastolic dysfunction, where a major part of LV filling occurred later during the atrial filling phase, despite differences in heart rate. LV relaxation was impaired during most of the diastolic phase. The early/ atrial (E/A) flow ratio was different between diastolic heart failure and volunteers (P < 0.01). E/A was less than 1 in the patients (0.54 ± 0.18), and greater than 1 in vol-unteers (2.1 ± 0.5). LV end-diastolic thickness was larger (P < 0.01) in patients (14.3 ± 3.1 mm) than in volunteers (10.5 ± 2.6 mm), as shown in Figure 10. LV myocardial dynamic strain range (difference between end-systolic
and end-diastolic strains) was reduced in the patients (P < 0.005), with less relaxation during the diastolic phase (Figure 11). Strain (longitudinal) ranges were 16.8 ± 2.7 mm-1 and 22.9 ± 3.1 mm-1 in patients and volunteers,
respectively. PWV was higher (P < 0.005) in patients (6.3 ± 1.9 m/s) than in volunteers (3.5 ± 1.4 m/s). The degree of LV diastolic dysfunction showed strong correlation with aortic PWV in diastolic heart failure. The correla-tion coefficients (r) between E/A ratio, myocardial thick-ness, dynamic strain range and between PWV were -0.83, 0.81, and -0.78, respectively.
Discussion
CMR provides non-invasive means for estimating sys-temic compliance by measuring the aortic PWV. TT, XC, and QA are common methods for measuring PWV from velocity-encoded CMR. Each method has its own advan-tages and disadvanadvan-tages. The purpose of this study was to objectively compare these methods with each other and to test inter-observer, intra-observer, and inter-scan vari-abilities. It should be noted that this study did not focus on analyzing the relationship between PWV measure-ments and different physiological parameters as has been conducted in previous literature [35-41]. Rather, we were
interested in studying the reproducibility and repeatabil-ity of the available CMR techniques.
Although the current study did not focus on PWV comparison between 1.5-Tesla and 3 Tesla systems, the use of a 3 Tesla system in this study allowed for achieving higher temporal or spatial resolutions, compared to pre-vious results on 1.5-Tesla [9,42,43], which is reflected in the overall reduced variabilities reported in the Results section. Theoretically, high temporal resolution allows for more precise measurement of the wave travelling time (Δt) in the TT and XC methods, which results in more accurate estimation of PWV. Likewise, high spatial reso-lution allows for more exact measurement of the vessel cross-sectional area in the QA method with more accu-rate PWV values. Nevertheless, such advantages are usu-ally accompanied with some difficulties, e.g. susceptibility artifacts, which were not a major concern in this study. Other techniques could be implemented to increase the temporal resolution. One possibility is to conduct two consecutive scans with the trigger delay set to TR/2 in the second scan. Interleaving the frames from the two scans would double the temporal resolution. One problem is that this method requires the two scans to have the same chest position and length of the cardiac cycle. Other
[image:7.595.56.538.95.384.2]Ibrahim et al.Journal of Cardiovascular Magnetic Resonance 2010, 12:26 http://www.jcmr-online.com/content/12/1/26
Page 8 of 13
sibilities can be achieved through pulse sequence optimi-zation by using shorter RF pulses, specialized CMR coils, or faster (steeper) gradients.
The TT method resulted in the most reproducible mea-surements and required the shortest processing time, fol-lowed by the XC method, and then the QA method. The lower reproducibility of the QA method could be attrib-uted to tilted plane orientation in the case of a curved aortic path, or to the manual determination of the vessel boundary in the analysis step. More automated tech-niques for extracting the vessel cross section should result in more reproducible results. The measurements from the TT and XC methods were closer to each other than to those from the QA method. It should be noted that although the two acquisitions in the TT method pro-vide more data than in the XC or QA methods, this may result in discrepancies related to physiological variations between the two separate slice scans. The XC method required high temporal resolution, while the QA method required high spatial resolution. Both the XC and QA methods required one set of velocity-encoded images, while the TT method required two sets. As the QA method uses only one set of cross-sectional images, this makes it suitable for curved arterial paths, like the aortic
[image:8.595.55.540.95.381.2]arch, and provides the exact PWV at the specified site. On the other hand, the TT and XC methods provide an approximation of the PWV over the length of the vessel. Nevertheless, in the QA method, PWV could have been measured at two sites of the aorta (proximal and distal) and an average is computed. However, this approach dou-bles the image processing time, which is already long in QA, rendering the technique impractical for this applica-tion. For large arteries, like the aorta, the three methods should result in similar measurements, as altered vessel mechanical properties tend to be more systematic [2]. The TT method was the least dependent on user interac-tion, followed by the XC method, and then the QA method. It should be noted that the points selected along the aortic path in the XC method should not be too close to each other unless very high temporal resolution is achieved. The introduction of very close points tended to lower the estimated PWV. Due to its dependence on user interaction, the QA method resulted in the least repro-ducible measurements and the largest inter- and intra-observer variabilities. Semi-automated methods could be implemented for segmenting the aortic cross section in the QA method using pixel intensity threshold, e.g. include all pixels within ± 2SD of the blood mean signal
intensity. However, there is a problem of possible anat-omy overlap with adjacent structures of similar signal intensity. Furthermore, the amount of time needed to review and correct the automatically-selected boundaries can exceed the time required to identify the vessel boundary in all 10-15 frames during early systole.
In this work, velocity was computed as the averaged value across a 5 × 5-pixels ROI centered at the vessel cen-ter. It should be noted that other investigators have previ-ously used the region of peak velocity for velocity measurement [44]. The measurements could be different in the two methods, especially in the proximal slice where peak velocity is offset from the vessel center. This may explain the difference in the systolic pulse shape between the proximal and distal curves in the TT method in
Fig-ure 1 (it appears more rounded in the proximal slice). Another observation is the difference in the base velocity between the two sites, which could be attributed to local variations in the vessel geometry, vessel curvature, or to reflection waves. It should be also noted that both cross-sectional slices were acquired with one isocenter position (the scanner table did not move between the two acquisi-tions), and that physiological variations between different breath-holds were not corrected for, which may explain shape variation between the two velocity curves.
The choice of the analysis technique should generally depend on the geometry of the vessel segment at which PWV is measured, and on the available image quality. If possible, images with high temporal (for TT and XC methods) and spatial (for QA method) resolutions should be obtained, to have flexibility in choosing any of the three analysis techniques. The analysis should be repeated in case the calculated PWV is significantly dif-ferent from expected measurements available in the liter-ature, which could be due to venc aliasing, patient motion, or image artifacts. Despite the wide range of the measured PWV values, the values at the lower and upper ends of the range were similar between the different anal-ysis techniques, which suggests their correctness. The wide range of the measured values could in part be attrib-uted to the heterogeneous cohort of the patients included in the study. More studies are needed to investigate other possible reasons of the wide range of PWV measure-ments.
Finally, the study gives an example of the importance of measuring PWV in diastolic heart failure. The results provided evidence of both aortic and LV stiffening in dia-stolic heart failure. Such evidence consisted of slow early filling, increased atrial filling, increased myocardial mass and stiffness, and reduced aortic distensibility. Thus, the results suggests that aortic stiffness is a major input in diastolic heart failure, and it has to be considered when studying different treatment options and for patient fol-low-up.
Future studies will include the implementation and comparison of the proposed techniques for measuring PWV in vessels other than the aorta (e.g. pulmonary arteries). Imaging protocols with higher temporal and spatial resolutions will be necessary to overcome the problems of pulmonary artery short length and reflection waves [45].
Limitations
[image:9.595.58.291.93.488.2]There are a few limitations that must be acknowledged regarding the implemented techniques. Firstly, no inva-sive catheter measurements, which are considered the gold standard, were acquired in this study. However, PWV has previously been validated against pressure
Ibrahim et al.Journal of Cardiovascular Magnetic Resonance 2010, 12:26 http://www.jcmr-online.com/content/12/1/26
[image:10.595.56.538.95.384.2]Page 10 of 13
Figure 8 Inter-method variability. Bland-Altman (up) and regression analysis (down) are shown for time vs. cross-correlation (left), transit-time vs. flow-area (middle), and cross-correlation vs. flow-area (right) methods on the patients' cohort. The transit-transit-time and cross-correlation methods have large agreement together than with the flow-area method.
[image:10.595.57.541.436.700.2]Figure 10 LV end-diastolic thickness in diastolic heart failure. Bull's eye figures of end-diastolic thickness in diastolic heart failure (left) and normal (right) computed from a stack of cine short-axis images.
[image:11.595.61.542.347.690.2]Ibrahim et al.Journal of Cardiovascular Magnetic Resonance 2010, 12:26 http://www.jcmr-online.com/content/12/1/26
Page 12 of 13
catheters [19-24]. Furthermore, PWV measurements showed good correlations with different cardiac parame-ters as shown in the Results section. Secondly, the con-ducted PWV scans were added to the patients' main CMR study. Thus, PWV may have been slightly affected by patient stress when the measurement took place towards the end of the exam. Nevertheless, the volunteer scans showed no systematic difference between the first and second measurements. The third limitation is that the original XC method, as described in [26], requires two CMR acquisitions with orthogonal venc directions (head-to-foot and left-to-right), and it then calculates the net blood velocity by vector summation of the two mea-surements allowing for analysis of PWV throughout both the transverse and descending aorta. Only the craniocau-dal/head-to-foot velocity-encoded images were acquired in our study, allowing acquisition and processing times to be decreased, but limiting our analysis to the descending aorta. Another limitation is that the QA method holds true under the assumption that there are no reflection waves superimposed on the forward-transmitting pres-sure pulse during early systole, such that the incremental variation in blood flow is proportional to the change in vessel cross-sectional area. This condition was satisfied in all cases in this study; however, reflection waves could be a critical problem in shorter vessels, such as the pulmo-nary arteries. Another point to be mentioned is that the imaging pulse sequences were not optimized for each measurement method (TT, XC, or QA), e.g. TR minimi-zation for the TT or XC methods. However, this strategy would have resulted in different separate acquisitions and hindered method comparison. Finally, despite the good results from the inter-scan variability test, it should be noted that this study did not account for possible physio-logical variations between repeated sessions.
Conclusions
In conclusion, with the current 3-Tesla CMR protocol and analysis methods, the TT and XC methods result in closer and more reproducible aortic PWV measure-ments, and require less user interaction, than the QA method.
Competing interests
The authors declare that they have no competing interests.
Authors' contributions
EHI prepared the imaging protocol, supervised the experiments, analyzed the results, and wrote the manuscript. KRJ analyzed the results for the inter-observer study and helped in editing the manuscript. ABM recruited the dia-stolic heart failure patients and helped in analyzing their results. JMS con-ducted the CMR scans. RDW supervised the CMR scans, contributed in interpreting the results, and helped in drafting and reviewing the manuscript.
Author Details
1Department of Radiology, University of Florida College of Medicine,
Jacksonville, Florida, USA and 2Department of Medicine, University of Florida
College of Medicine, Jacksonville, Florida, USA
References
1. Dobrin PB: Mechanical properties of arteries. Physiol Rev 1978, 58:397-460.
2. Peterson LH, Jensen RE, Parnell J: Mechanical properties of arteries in vivo. Circ Res 1960, 8:622-639.
3. Imura T, Yamamoto K, Satoh T, Kanamori K, Mikami T, Yasuda H: In vivo viscoelastic behavior in the human aorta. Circ Res 1990, 66:1413-1419. 4. Metafratzi ZM, Efremidis SC, Skopelitou AS, De Roos A: The clinical
significance of aortic compliance and its assessment with magnetic resonance imaging. J Cardiovasc Magn Reson 2002, 4:481-491. 5. Laurent S, Cockcroft J, Van Bortel L, Boutouyrie P, Giannattasio C, Hayoz D,
Pannier B, Vlachopoulos C, Wilkinson I, Struijker-Boudier H: Expert consensus document on arterial stiffness: methodological issues and clinical applications. Eur Heart J 2006, 27:2588-2605.
6. Resnick LM, Militianu D, Cunnings AJ, Pipe JG, Evelhoch JL, Soulen RL: Direct magnetic resonance determination of aortic distensibility is essential hypertension. Hypertension 1997, 30:654-659.
7. Draney MT, Herfkens RJ, Hughes TJ, Pelc NJ, Wedding K, Zarins CK, Taylor CA: Quantification of vessel wall cyclic strain using cine phase contrast magnetic resonance imaging. Biomed Eng 2002, 30:1033-1045. 8. Bolster BD, Atalar E, Hardy CJ, McVeigh ER: Accuracy of arterial
pulse-wave velocity measurement using MR. J Magn Reson Imaging 1998, 8:878-888.
9. Yu H, Peng H, Wang Y, Wen C, Tseng WI: Quantification of the pulse wave velocity of the descending aorta using axial velocity profiles from phase-contrast magnetic resonance imaging. Magn Reson Med 2006, 56:876-883.
10. Wedding K, Draney MT, Herfkens RJ, Zarins CK, Taylor CA, Pelc NJ: Measurement of vessel wall strain using cine phase contrast MRI. J
Magn Reson Imaging 2002, 15:418-428.
11. Macgowan CK, Henkelman RM, Wood ML: Pulse-wave velocity measured in one heartbeat using MR tagging. Magn Reson Med 2002, 48:115-121.
12. Boonyasirinant T, Rajiah P, Setser RM, Lieber ML, Lever HM, Desai MY, Flamm SD: Aortic stiffness is increased in hypertrophic cardiomyopathy with myocardial fibrosis: novel insights in vascular function from magnetic resonance imaging. J Am Coll Cardiol 2009, 54:255-262. 13. Gribbin B, Steptoe A, Sleight P: Pulse wave velocity as a measure of
blood pressure change. Psychophysiology 1976, 13:86-90.
14. Steptoe A, Smulyan H, Gribbin B: Pulse wave velocity and blood pressure change: calibration and applications. Psychophysiology 1976, 13:488-493.
15. Wilnor WR: Hemodynamics Baltimore, MD: Williams & Wilkins; 1982. 16. Boese JM, Bock M, Schoenberg SO, Schad LR: Estimation of aortic
compliance using magnetic resonance pulse wave velocity measurement. Phys Med Biol 2000, 45:1703-1713.
17. Bradlow WM, gatehouse PD, Hughes RL, O'Brien AB, Gibbs JS, Firmin DN, Mohiaddin RH: Assessing normal pulse wave velocity in the proximal pulmonary arteries using transit time: a feasibility, repeatability, and observer reproducibility study by cardiovascular magnetic resonance.
J Magn Reson Imaging 2007, 25:974-981.
18. Lehmann ED, Parker JR, Hopkins KD, Taylor MG, Gosling RG: Validation and reproducibility of pressure-corrected aortic distensibility measurements using pulse wave velocity Doppler ultrasound. J
Biomed Eng 1993, 15:221-228.
19. Grotenhuis HB, Westenberg JJ, Steendijk P, Geest RJ vander, Ottenkamp J, Bax JJ, Jukema JW, deRoos A: Validation and reproducibility of aortic pulse wave velocity as assessed with velocity-encoded MRI. J Magn
Reson Imaging 2009, 30:521-526.
20. Burkart DJ, Johnson CD, Morton MJ, Wolf RL, Ehamn RL: Volumetric flow rates in the portal venous system with cine-pahse-contrast MR imaging. Am J Radiol 1993, 160:1113-1118.
21. Debatin JF, Strong JA, Sostman HD, Negro-Vilar R, Paine SS, Douglas JM, Plec NJ: MR charaterisation of blood flow in native and grafted internal mammary arteries. J Magn Reson Imaging 1993, 3:443-450.
22. Mohiaddin RH, Wann SL, Underwood R, Firmin DN, Rees S, Longmore DB: Vena caval flow: assessment with cine MR velocity mapping. Radiology
1990, 177:537-541.
Received: 9 December 2009 Accepted: 11 May 2010 Published: 11 May 2010
This article is available from: http://www.jcmr-online.com/content/12/1/26 © 2010 Ibrahim et al; licensee BioMed Central Ltd.
This is an Open Access article distributed under the terms of the Creative Commons Attribution License (http://creativecommons.org/licenses/by/2.0), which permits unrestricted use, distribution, and reproduction in any medium, provided the original work is properly cited.
23. Vulliemoz S, Stergiopulos N, Meuli R: Estimation of local aortic elastic properties with MRI. Magn Reson Med 2002, 47:649-654.
24. Joly L, Perret-Guillaume C, Kearney-Schwartz A, Salvi P, Mandry D, Marie PY, Karcher G, Rossignol P, Zannad F, Benetos A: Pulse wave velocity assessment by external noninavsive devices and phase-contrast magnetic resonance imaging in the obese. Hypertension 2009, 54:421-426.
25. Mohiaddin RH, Firmin DN, Longmore DB: Age-related changes of human aortic flow wave velocity measured noninvasively using magnetic resonance imaging. J Appl Physiol 1993, 74:492-497.
26. Fielden SW, Fornwalt BK, Jerosch-Herold M, Eisner RL, Stillman AE, Oshinski JN: A new method for the determination of aortic pulse wave velocity using cross-correlation on 2D PCMR velocity data. J Magn
Reson Imaging 2008, 27:1382-1387.
27. Forbat SM, Mohiaddin RH, Yang GZ, Firmin DN, Underwood SR: Measurement of regional aortic compliance by MR imaging: a study of reproducibility. J Magn Reson Imaging 1995, 5:635-639.
28. Garot J: The study of diastole by tagged MRI: are we nearly there yet?
Eur Heart J 2004, 25:1376-1377.
29. Desai AS, Mitchell GF, Fang JC, Creager MA: Central aortic stiffness is increased in patients with heart failure and preserved ejection fraction. J Card Fail 2009, 15:658-664.
30. Kawaguchi M, Hay I, Fetics B, Kass DA: Combined ventricular systolic and arterial stiffening in patients with heart failure and preserved ejection fraction. Circulation 2003, 107:714-720.
31. Butlin M, Hickson S, Graves MJ, McEniery CM, Avolio AP, Wilkinson IB: Determining pulse wave velocity using MRI: a comparison and repeatability of results using seven transit time algorithms. Artery Research 2008, 2:99.
32. Pacileo G, Pisacane C, Russo MG, Crepaz R, Sarubbi B, Tagliamonte E, Calabro R: Left ventricular remodeling and mechanics after successful repair of aortic coarctation. Am J Cardiol 2001, 87:748-752.
33. Osman NF, Kerwin WS, McVeigh ER, Prince JL: Cardiac motion tracking using CINE harmonic phase (HARP) magnetic resonance imaging.
Magn Reson Med 1999, 42:1048-1060.
34. Bland JM, Altman DG: Statistical methods for assessing agreement between two methods of clinical measurement. Lancet 1986, 1:307-310.
35. Benetos A, Buatois S, Salvi P, Marino F, Toulza O, Dubail D, Manckoundia P, Valbusa F, Rolland Y, Hanon O, Gautier S, Miljkovic D, Guillemin F, Zamboni M, Labat C, Perret-Guillaume C: Blood pressure and pulse wave velocity values in teh institutionalized elderly aged 80 and over: baseline of the PARTAGE study. J Hypertens 2010, 28(1):41-50. 36. Ruiz-Feria CA, Yang Y, Thoamson DB, White J, Su G, Nishimura H: Pulse
wave velocity and age- and gender-dependent aortic wall hardening in fowl. Comp Biochem Physiol A Mol Integr Physioil 2009, 154(4):429-36. 37. Elias MF, Robbins MA, Budge MM, Abhayaratna WP, Dore GA, Elias PK:
Arterial pulse wave velocity and cognition with advancing age.
Hypertension 2009, 53:668-673.
38. Su HM, Lee KT, Chu CS, Lee MY, Lin TH, Voon WC, Sheu SH, Lai WT: Effects of heart rate on brachial-ankle pulse wave velocity and ankle-brachial pressure index in patients without significant organic heart disease.
Angiology 2007, 58:67-74.
39. Schillaci G, Mannarino MR, Pucci G, Pirro M, Helou J, Savarese G, Vaudo G, Mannarino E: Age-specific relationship of aortic pulse wave velocity with left ventricular geometry and function in hypertension.
Hypertension 2007, 49:317-321.
40. Kim EJ, Park CG, Park JS, Suh SY, Choi CU, Kim JW, Kim SH, Lim HE, Rha SW, Seo HS, Oh DJ: Relationship between blood pressure parameters and pulse wave velocity in normotensive and hypertensive subjects: invasive study. J Hum Hypertens 2007, 21:141-148.
41. Perkins GM, Owen A, Swaine IL, Wiles JD: Relationship between pulse wave velocity and heart rate variability in healthy men with a range of moderate-to-vigorous physical activity levels. Eur J Appl Physioil 2006, 98:516-523.
42. Danias PG, Tritos NA, Stuber M, Botnar RM, Kissinger KV, Manning WJ: Comparison of aortic elasticity determined by cardiovascular magnetic resonance imaging in obese versus lean adults. Am J Cardiol 2003, 91:195-199.
43. Meer RW van der, Diamant M, Westenberg JJ, Doornbos J, Bax JJ, de Roos A, Lamb HJ: Magnetic resonance assessment of pulse wave velocity,
aortic distensibility, and cardiac function in uncomplicated type 2 diabetes mellitus. J Cardiovasc Magn Reson 2007, 9:645-651. 44. Zhao X, Pratt R, Wansapura J: Quantification of aortic compliance in
mice using radial phase contrast MRI. J Magn Reson Imaging 2009, 30:286-291.
45. Hollander EH, Wang J, Dobson GM, Parker KH, Tyberg JV: Negative wave reflections in pulmonary arteries. Am J Physiol Heart Circ Physiol 2001, 281:H895-H902.
doi: 10.1186/1532-429X-12-26
Cite this article as: Ibrahim et al., Measuring aortic pulse wave velocity using high-field cardiovascular magnetic resonance: comparison of techniques