IJPSR (2019), Volume 10, Issue 9 (Research Article)
Received on 24 December 2018; received in revised form, 29 April 2019; accepted, 14 August 2019; published 01 September 2019
IMPLEMENTATION OF FRACTION OF DESIGN SPACE TO ASSESS PREDICTION CAPABILITY OF RESPONSE SURFACE DESIGN TO OPTIMIZE MODIFIED RELEASE TABLETS OF HYDROCHLOROTHIAZIDE
V. D. Singhai * 1, 2, S. Sharma 2 and S. Paliwal 2
Alembic Research Center 1, Alembic Pharmaceuticals Limited, Alembic Road, Vadodara - 390003, Gujarat, India.
Department of Pharmacy 2, Banasthali Vidyapith, Banasthali - 304022, Rajasthan, India.
ABSTRACT: Selecting the best possible design is an uphill task considering a lot of criteria which must be scrutinized while choosing any design out of many alternative design options available. The experimental design is often compared and selected based on alphabetical design optimality criteria, like A, D, G or V. Each of them attempts to summarize any one important characteristic of the selected design. G-optimality criteria favor those experimental designs which are having the smallest maximum prediction variance over the entire region of interest. It does not consider the distribution of the magnitude of the prediction variance throughout the region. Graphical methods like variance dispersion graph and the fraction of design space plots can be used to overcome this drawback. These graphical methods are explored extensively for comparing the quality of prediction throughout the design space. It serves as a useful tool to assess the prediction performance of the design and making a comparison between experimental designs. The fraction of the design space plot provides a comprehensive picture of the predictive quality of experimental design through the entire region of interest. Single curve provides detailed information of scaled prediction variance for an assumed model and specific design region for the selected design. Here Fraction of design space plots is adapted to evaluate designs for optimization of modified release tablets of hydrochlorothiazide to get desired in-vitro dissolution profile. Three response surface methodology designs are compared by applying this plot including Central Composite Circumscribed and Face centered design along with Box-Behnken design using Design expert software for modeling.
INTRODUCTION: Hydrochlorothiazide (HCTZ) is available in the market for the treatment of cardiac ailments for more than half a century and is
most commonly prescribed antihypertensive
throughout the world 1.
QUICK RESPONSE CODE
DOI:
10.13040/IJPSR.0975-8232.10(9).4207-14
The article can be accessed online on www.ijpsr.com
DOI link: http://dx.doi.org/10.13040/IJPSR.0975-8232.10(9).4207-14
Prescription pattern of HCTZ has been densely influenced by the eight reports of Joint national committee (JNC) for prevention, detection, evaluation, and treatment of high blood pressure for more than three decades.
All these reports recommend HCTZ as first-line therapy with usual dose ranging from 12.5 to 50 mg per day in single or divided dose as recommended 2
. The more recent JNC reports have recommended the use of low doses of thiazide and thiazide-like diuretics should be used as initial therapy in hypertensive patients 3.
Keywords:
Fraction of design space, Response surface methodology, Central composite design, Box-Behnken design, Scaled prediction
variance, Hydrochlorothiazide Correspondence to Author: Vikas D. Singhai
Team Leader (Assistant Manager), Research & Development,
Alembic Research Center, Alembic Pharmaceuticals Limited, Alembic Road, Vadodara - 390003, Gujarat, India.
Market volume of HCTZ immediate release (IR) tablets is almost 31 million US dollars. The market volume increases almost 20 folds which HCZ is given in combination with other antihypertensive drugs, which is near about 590 million US dollars. However, the molecule suffers the requirement of high dose ranging from 12.5 to 50 mg/day along with relatively shorter half-life of approximately 6 hours (h) 4. Further, the existing dose does not cover the most risk zone for heart attacks which are last phase of sleep and early morning hours which is imperative to cut down the heart attack chances 5. The cardiovascular system follows a routine pattern having oscillatory nature and cardiovascular functions exhibit circadian changes. There is a further elevation of blood pressure and heart rate due to catecholamines, which shows peak when a person wakes up in morning 6. Imbalance between
increased myocardial oxygen demand and
decreased myocardial oxygen supply or sometimes both results in heart attack 7.
There are several techniques to modify the release rate for any molecule. We have used hydrophilic based matrix technology to modify the release rate of HCTZ 8. In Hydrolytic matrix system drug is dispersed consistently throughout the hydrophilic matrix which decelerates drug release. In current research work, a blend of two matrix agent is used to achieve desired modified drug release pattern 9.
OFAT (one factor at a time approach) is a traditional approach to drug development which is trial and error technique with a major flaw that it cannot access factor interactions, which must be anticipated in pharmaceutical process as it covers a small fraction of the total feasible factor space, leading to a satisfactory formulation rather than an optimal one 10. Regulatory agencies accentuate on Quality by Design (QbD) based approach for pharmaceutical development to build quality in the product. QbD can be defined as “systematic, scientific, risk-based, holistic and pro-active approach to pharmaceutical development that begins with predefined objective and emphasis on product and process understanding and process control” according to ICH Q8 (R2) quality guideline 11. There are two major steps of QbD based product development. The first step is an identification of quality target product profile (QTPP) which forms the basis of development.
QTPP can be defined as “A prospective summary of the quality characteristics of a drug product that ideally will be achieved to ensure the desired quality, taking into account safety and efficacy of the drug” 12
. The second step involves the identification of factors which may influence QTPP 13
. These are called critical quality attributes of the product (CQAs). ICH Q8 R(2) quality guideline defines CQA as “a physical, chemical, biological, or microbiological property or characteristic that should be within an appropriate limit, range, or distribution to ensure the desired product quality which eminently depends on the critical material attributes (CMAs) of excipient used in product development along with critical process parameters (CPPs) during manufacturing” 14
. Risk assessment (RA) is one of the decisive and critical elements of QbD. ICH Q9 quality guideline defines RA as “A systematic process of organizing information to support a risk decision to be made within a risk management process.” RA is followed by the establishment of design space by application of design of experiment (DoE). Design Space is a multidimensional region meeting with all the specifications of CQAs during shelf-life of the product with respect to CMAs and CPPs with high assurance 15.
After identification of critical factors and response, the goal is to select an appropriate experimental design. During the planning of experiments, a researcher has a good sense of factors & range of values for those factors which are critical for further investigation along with tentative proposed model which can be able to fit. Variety of available designs is possible given these conditions. So, the researcher should strategically choose the best design from the available options given the particular priorities of the experiment. Some of the characteristics of good design include cost balancing, ability to access lack of fit, ability to estimate pure error, ability to adequately estimate all of the parameters in the model, ability to predict well in design space. All these good characteristics of the design are simultaneously not possible. Thus the selection of best-suited design involves prioritizing what is most important for a given situation 16.
G optimality criteria (G efficiency) and V optimal criteria (V average). The average prediction variance as a percentage of the maximum prediction variance is expressed as "G-efficiency”.
Often, making design better for physical
experiments comes at the expense of G-efficiency 17
. The actual complexities of design prediction are not revealed by these single-valued criteria. The most common measure is the scaled prediction variance (SPV), which was emphasized by Box and Hunter (1957) 18. While making a prediction, the experimenter is not aware of the exact location where to predict in the design space. For a fixed-sized design, best prediction at one location comes at the cost of poor estimation of the other location in design space. To get an excellent prediction, a stable scaled prediction value is desired over the whole region. Design performance on every part of the region interested should be considered. Thus it was established very early while comparing different designs single number criteria will not be enough 19.
Several graphical methods were introduced in the literature to study a design‟s prediction variance property. These include counterplot, Variance dispersion graph (VDG) introduced by Jensen and Mayers in 1989 20, 3D variance dispersion graph by Goldfarb et al., in 2004 21, quantile plots proposed by Khuri et al., in 1996 22. Fractions of design space plots (FDS) were introduced by Zahran, Anderson-Cook, and Mayers to complement VDG in 2003. Spherical and cuboidal design spaces were considered showing a fraction of design space at or below a given scaled prediction value 23. FDS plot provides a cumulative scaled prediction value, the better the design will be. The flatter line represents the more stable scaled prediction value distribution for that design. Flatter curve implies the maximum and minimum scaled predicted values are closer together giving a more stable distribution of SPV. The FDS plot helps to summarize the range of scaled prediction values, the relative proportions of values throughout the design space. Information regarding the distribution of scaled prediction variance throughout the design region is provided by FDS plot. By comparing the FDS plot of different designs within a variety of cut off points form some measure of variance, a more comprehensive comparisons can be done for the entire design region 24.
A response surface design is a set of advanced design of experiments techniques that help in better understanding and optimizing responses. Response surface design methodology is often used to refine
models after important factors have been
determined using screening designs or factorial designs; especially if we suspect curvature in the response surface. The difference between a response surface equation and the equation for a factorial design is the addition of the squared (or quadratic) terms that lets you model curvature in the response, making them useful for understanding or mapping a region of a response surface. Response surface equations model how changes in variables affect the response of interest. It is finding the levels of variables that optimize a response. Selecting the operating conditions to meet specifications. There are two main types of response surface designs i.e. central composite design and box-Behnken design.
A Box-Wilson Central Composite Design (CCD), is the most commonly used response surface designed experiment and contains an embedded factorial or fractional factorial design with center points that are augmented with a group of 'star points' that allow estimation of curvature. CCD can fit a full quadratic model and are often used when the design plan calls for sequential experimentation because these designs can include information from a correctly planned factorial experiment. CCD can be used to estimate first efficiently- and second-order terms and model a response variable with curvature by adding center and axial points to a previously-done factorial design. A CCD always contains twice as many star points as there are factors in the design.
These designs have circular, spherical, or hyperspherical symmetry and require 5 levels for each factor. Augmenting an existing factorial or resolution V fractional factorial design with star points can produce this design. For those situations in which the limits specified for factor settings are true limits, the CCI design uses the factor settings as the star points and creates a factorial or fractional factorial design within those limits (in other words, a CCI design is a scaled-down CCC design with each factor level of the CCC design divided by α to generate the CCI design). This design also requires 5 levels of each factor. In CCF design the star points are at the center of each face of the factorial space, so α = ± 1. This variety requires 3 levels of each factor. Augmenting an existing factorial or resolution V design with appropriate star points can also produce this design 25
. A Box Behnken design (BBD) is a type of response surface design that is an independent quadratic design in that it does not contain an embedded factorial or fractional factorial design. In this design, the treatment combinations are at the midpoints of edges of the process space and at the center.
These designs are rotatable (or near rotatable) and require 3 levels of each factor. The designs have
limited capability for orthogonal blocking
compared to the central composite designs. The geometry of this design suggests a sphere within the process space such that the surface of the sphere protrudes through each face with the surface of the sphere tangential to the midpoint of each edge of the space. These designs allow efficient
estimation of the first- and second-order
coefficients. Because BBD often have fewer design points, they can be less expensive to do than central composite designs with the same number of factors. However, because they do not have an embedded factorial design, they are not suited for sequential experiments.BBD can also prove useful if you know the safe operating zone for your process. CCD usually has axial points outside the "cube." These points may not be in the region of interest or maybe impossible to conduct because they are beyond safe operating limits. BBD does not have axial points, thus, you can be sure that all design points fall within your safe operating zone. BBD also ensure that all factors are not set at their high levels at the same time.
During the research work for the development of modified-release tablet for HCTZ, QbD approach was utilized. QTTP was identified followed by the qualitative and quantitative risk assessment to determine CQA and linking of CMAs and CPPs to CQA. Three critical factors were identified and DoE technique was applied. 23 A full factorial design was used to develop the formulation and determine the design space which provided the required dissolution profile.
All this work was done in previous laboratory work. Since the determination of curvature is not possible using full factorial design; hence response
surface methodology was incorporated to
determine the presence or absence of curvature and optimization of the formulation. There are several response surface design available which can be used to optimize the formulation. Hence, graphical technique using FDS was studied in this work to determine which response surface design is most suited for optimization purpose. This research work will highlight the selection of best-suited response
surface design using FDS technique for
optimization of modified release tablets of HCTZ.
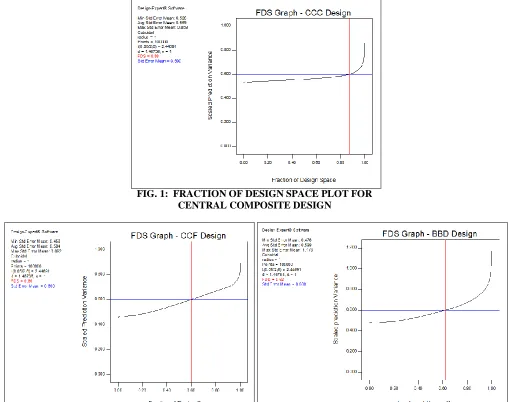
MATERIAL AND METHODS: Design expert software (version 10) was used for plotting of all the graphs. As discussed earlier three response surface designs were selected viz. central composite design circumscribed (CCC), central composite design face-centered (CCF) and box-Behnken design (BBD). The fraction of design surface plots was plotted for all three designs by using design expert software and studied in detail. The FDS plots are plotted between scaled prediction values on abscissa and fraction of design space on ordinates that has prediction variance at or below the given value and makes comparisons between designs with a single curve. The FDS plots are constructed by random sampling of large numbers of design locations. Design expert for by default select 100,000 random points to calculate the standard error of predicting the mean.
Fig. 1 shows a fraction of the design space plot for central composite design circumscribed. Fig. 2
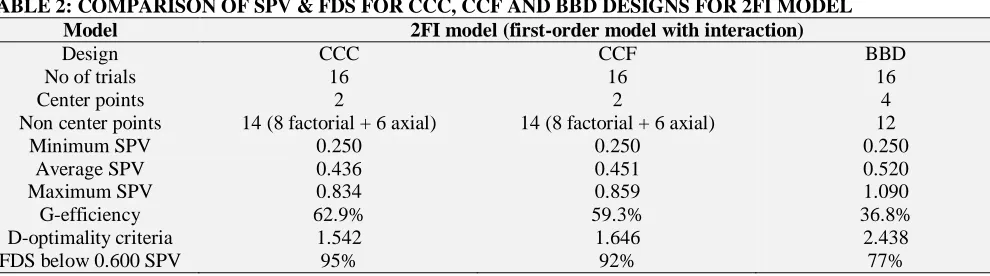
shows a fraction of the design space plot for central
composite design face-centered and Fig. 3 shows a fraction of the design space plot for box-Behnken design.
Minimum, average and maximum SPV values were determined. A reference scaled prediction variance was selected from these SPV values and fraction of design space under that SPV value was determined. The software also predicted G-efficiency value for that particular model. A number of trials predicted by software for each design were kept constant to „16‟ to avoid any variation in prediction capabilities due to a large number of trials for any particular design. CCC and CCF designs have 2 center points, and 14 non-center points whereas BBD has 4 center points and 12 non-center points.
RESULTS: The X-axis in the plot represents the proportion of the design space, ranging from 0 to
100%. The Y-axis represents the scaled prediction value. For a point (x, y) that falls on the black curve, the value x is the proportion of design space with variance less than or equal to y. From the average SPV of all the plots, SPV of 0.600 was selected to compare the fraction of the design space.
Fig. 1: FDS plot for CCC design (quadratic model) show that the minimum scaled prediction variance is 0.528. The average relative prediction variance is 0.569. The red and blue crosshairs indicate that the fraction of design space below 0.600 SPV which was found to be 88%. The flatter line represents the more stable scaled prediction value distribution for
FIG. 2: FRACTION OF DESIGN SPACE PLOT FOR CENTRAL COMPOSITE DESIGN FACE CENTERED
[image:5.612.50.562.107.509.2]FIG. 3: FRACTION OF DESIGN SPACE PLOT FOR BOX BEHNKEN DESIGN
FIG. 1: FRACTION OF DESIGN SPACE PLOT FOR CENTRAL COMPOSITE DESIGN
that design. Flatter curve is observed in the center of design up to 90% of design space. SPV ranged from 0.528 to 0.606 implies the maximum and minimum scaled predicted values are closer together giving a more stable distribution of SPV. Values of SPV are slightly higher towards the edge making the design more desirable. Overall the design looks good.
Fig. 2: FDS plot for CCF design (quadratic model) show that the minimum scaled prediction variance is 0.458. The average relative prediction variance is 0.584. The red and blue crosshairs indicate that the fraction of design space below 0.600 SPV which was found to be 60%. Flatter curve is not observed for this design. Values of SPV are slightly higher towards the edge.
Fig. 3: FDS plot for BBD design (quadratic model) shows that the minimum scaled prediction variance is 0.476. The average relative prediction variance is 0.599. The red and blue crosshairs indicate that the fraction of design space below 0.600 SPV which was found to be 62%. Flatter curve is not observed for this design. Values of SPV are high towards the edge making the design less desirable.
[image:6.612.50.564.300.435.2]Initial comparison between CCD designs and BBD design was done for second-order model tabulated in Table 1. Further comparison of SPV & FDS for CCC, CCF and BBD designs for 2FI model is tabulated in Table 2. And the comparison of SPV & FDS for CCC, CCF and BBD designs for Liner model (First order model) is tabulated in Table 3.
TABLE 1: COMPARISON OF SPV & FDS FOR CCC, CCF AND BBD DESIGNS FOR QUADRATIC MODEL
Model Second order (quadratic model)
Design CCC CCF BBD
No of trials 16 16 16
Center points 2 2 4
Non center points 14 (8 factorial + 6 axial) 14 (8 factorial + 6 axial) 12
Minimum SPV 0.528 0.458 0.476
Average SPV 0.569 0.584 0.599
Maximum SPV 0.859 0.892 1.173
G-efficiency 84.7% 78.5% 45.5%
D-optimality criteria 1.806 2.326 2.828
FDS below 0.600 SPV 88% 60% 62%
The quadratic model corresponds to the most complex model which might be needed to adequately model the data. There is a possibility of a few superfluous terms which are included in this quadratic model. After running the selected design, individual terms including main factors, two-way interactions, three-way interactions, and quadratic interactions can be tested and possibly dropped from the model if they are not enhancing the F-value of the model. It is observed that after dropping insignificant terms from the model, the fit
[image:6.612.57.552.610.748.2]of the model is enhanced. The F-value of the model is increased, lack of fit values is decreased and the p-value is further reduced. Thus, the prediction power of the model is improved significantly. When a design performs consistently well for all nested models within the largest one specified, it fulfills the purpose of model robustness. Thus the comparison between CCD designs and BBD design was made for reduced models, also including 2FI model (First order model with interactions) and Linear model (First order model).
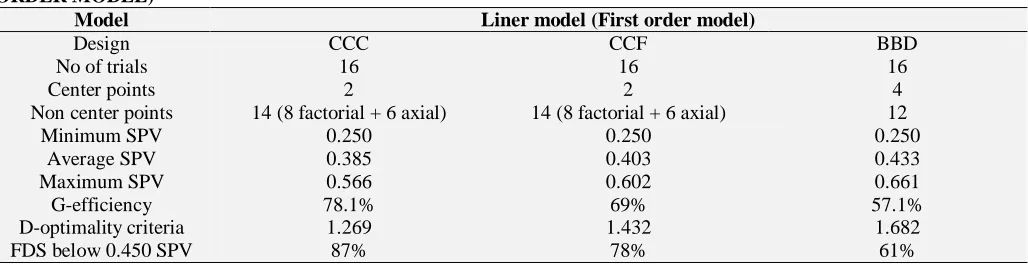
TABLE 2: COMPARISON OF SPV & FDS FOR CCC, CCF AND BBD DESIGNS FOR 2FI MODEL
Model 2FI model (first-order model with interaction)
Design CCC CCF BBD
No of trials 16 16 16
Center points 2 2 4
Non center points 14 (8 factorial + 6 axial) 14 (8 factorial + 6 axial) 12
Minimum SPV 0.250 0.250 0.250
Average SPV 0.436 0.451 0.520
Maximum SPV 0.834 0.859 1.090
G-efficiency 62.9% 59.3% 36.8%
D-optimality criteria 1.542 1.646 2.438
TABLE 3: COMPARISON OF SPV & FDS FOR CCC, CCF AND BBD DESIGNS FOR LINER MODEL (FIRST ORDER MODEL)
Model Liner model (First order model)
Design CCC CCF BBD
No of trials 16 16 16
Center points 2 2 4
Non center points 14 (8 factorial + 6 axial) 14 (8 factorial + 6 axial) 12
Minimum SPV 0.250 0.250 0.250
Average SPV 0.385 0.403 0.433
Maximum SPV 0.566 0.602 0.661
G-efficiency 78.1% 69% 57.1%
D-optimality criteria 1.269 1.432 1.682
FDS below 0.450 SPV 87% 78% 61%
DISCUSSION: For quadratic model, CCC design showed better prediction capabilities as compared to CCF and BBD where G-efficiency values were higher, D-optimality criteria were minimum and the fraction of design surface plot showed the larger fraction of design below selected scaled prediction variance. While comparing CCF and BBD model, the fraction of design below selected SPV is almost the same for both models but G-efficiency value is more for CCF as compared to BBD, thus making it more desirable.
For reduced model 2FI, G-efficiency value is reduced for all design as compared to the quadratic model, but the fraction of design space under the same SPV value is increased. Comparing three different models for 2FI, CCC showed better results for G-efficiency criteria, D-optimality criteria, and the fraction of design space as compared to the other two models. CCF performed better as compared to BBD. For reduced linear model CCC design proved better as compared to CCF and BBD with increased G-efficiency and the better fraction of design space below SPV of 0.450.
CONCLUSION: Fraction of design space plots are easily implemented and enable the researcher to study the performance, prediction, and robustness of a different design. To decide the best design based FDS plot, the CCC design is best with a maximum fraction of design space, 88% for quadratic model and 95% for 2FI model for SPV of 0.600 and 87% for the linear model for SPV of 0.450 as compared to CCF and BBD. G-efficiency value also predicts the same results where value is maximum for CCC, 84.7% for the quadratic model, 62.9% for 2FI model and 78.1% for the linear model as compared to CCF and BBD. Thus, CCC model will be used for the optimization of modified
release tablets of hydrochlorothiazide to get desired in-vitro dissolution profile.
ACKNOWLEDGEMENT: The authors are thankful to the Alembic Research Centre, Vadodara, India, for providing Design Expert Software (Version 10) facility in the successful accomplishment of present research work.
CONFLICT OF INTEREST: The authors report no conflict of interest. The authors alone are responsible for the content and writing of this article.
REFERENCES:
1. Waeber B, Dusing R, Glazer R, Paldanius P and Stricker K: P1873 Incidence rates of edema with triple therapy amlodipine/valsartan/HCTZ as compared to valsartan/ amlodipine and valsartan/HCTZ dual combination therapy. Eur Heart J 2018; 39(S1): ehy565.P1873.
2. Margolis KL, Fortmann SP, Bergdall AR, Smith DH, Pawloski PA and Vollmer WM: Design and methods for a pilot study and multicenter pragmatic trial comparing HCTZ and chlorthalidone for cardiovascular outcomes. J Am Soc Hypertens 2016; 10(4): e49.
3. Carey RM and Whelton PK: Prevention, detection, evaluation, and management of high blood pressure in adults: synopsis of the 2017 American College of Cardiology/American Heart Association Hypertension Guideline. Ann Intern Med 2018; 168(5): 351-58.
4. Eaton MC: Combination candesartan-HCTZ did not reduce major CV events in patients at intermediate CV risk. Ann Intern Med 2016; 165(2): JC7.
5. Ades PA, Keteyian SJ, Wright JS, Hamm LF, Lui K, Newlin K, Shepard DS and Thomas RJ: Increasing cardiac rehabilitation participation from 20% to 70%: a road map from the Million Hearts Cardiac Rehabilitation Collaborative. Mayo ClinProc 2017; 92(2): 234-42. 6. Wolk R, Gami AS, Touchard AG and Somers VK: Sleep
and Cardiovascular disease. Current Problem in Cardiology Journal 2005; 30: 625-62.
[image:7.612.51.565.74.206.2]8. Pygall S, Kujawinski S, Timmins P and Melia C: Extended-release of flurbiprofen from tromethamine-buffered HPMC hydrophilic matrix tablets. Pharm Dev Technol 2018; 23(9): 874-81.
9. Yun YN, Sohail M, Moon JH, Kim TW, Park KM, Chun DH, Park YC, Cho CH and Kim H: Defect‐Free Mixed‐Matrix Membranes with Hydrophilic Metal‐Organic Polyhedra for Efficient Carbon Dioxide Separation. Chemistry–An Asian Journal 2018; 13(6): 631-35.
10. Csóka I, Pallagi E and Paál TL: Extension of quality-by-design concept to the early development phase of pharmaceutical R&D processes. Drug Discovery Today 2018; 23(7): 1340-43.
11. Mishra SM and Rohera BD: An integrated, quality by design (QbD) approach for design, development and optimization of orally disintegrating tablet formulation of carbamazepine. Pharm Dev Technol 2017; 22(7): 889-03. 12. Mishra V, Thakur S, Patil A and Shukla A: Quality by
design (QbD) approaches in the current pharmaceutical set-up. Expert Opinion on Drug Delivery 2018; 15(8): 737-58.
13. Su Q, Bommireddy Y, Shah Y, Ganesh S, Moreno M, Liu J, Gonzalez M, Yazdanpanah N, O'Connor T and Reklaitis GV: Data reconciliation in the Quality-by-Design (QbD) implementation of pharmaceutical continuous tablet manufacturing. Int J Pharm 2019.
14. Li X, Liu X, Wang R, An F, Nie J, Zhang Y, Ahamada H, Liu X, Liu C and Deng Y: Quality by Design-Driven Process Development of Cell Culture in Bioreactor for the Production of Foot-And-Mouth Veterinary Vaccine. J Pharm Sci 2019.
15. Beg S, Hasnain MS, Rahman M and Swain S: Introduction to Quality by Design (QbD): Fundamentals, Principles,
and Applications. In. Pharmaceutical Quality by Design: Elsevier 2019: 1-17.
16. Anderson-Cook CM and Borror CM and Montgomery D: Response surface design evaluation and comparison. J Stat Plan Inference 2009; 139: 629-41
17. Anderson-Cook CM: Fraction of design space plots for examining model robustness. J Qual Technol 2005; 37: 223-35.
18. Box GEP and Hunter JS: Multifactor experimental designs for exploring response surfaces. Ann Math Stat 1957; 28: 195-41.
19. Anderson-Cook CM and Mayers R H: Fraction of design space to assess prediction capabilities of response surface design. J Qual Technol 2003; 35: 377-86.
20. Giovannitti-Jensen A and Mayers RH: Graphical assessment of the practical capability of response surface design. Technometrics 1989; 31: 375-84.
21. Goldfarb HB, Borror CM, Mongomery DC and Anderson-Cook CM: Three-dimensional variance dispersion graphs for mixture-process experiments. J QualTechnol 2004; 36: 109-24.
22. Khuri AI, Kim HJ and UM Y: Quantile plots of the prediction variance for response surface design. Comput Stat Data Anal 1996; 22: 395-07.
23. Zahran AR, Anderson-Cook CM and Mayers RH: Fraction of design space to assess the prediction capability of response surface design. J Qual Technol 1994; 35: 377-86. 24. Ozol-Godfrey A, Anderson-Cook CM and Robinson TJ:
Fraction of design space plot for generalized linear models. J Stat Plan Inference 2008; 138: 203-19.
25. Montgomery DC: Design and analysis of experiments. Arizona state university, John Wiley & Sons, Inc. Eight Edition 2013.
All © 2013 are reserved by International Journal of Pharmaceutical Sciences and Research. This Journal licensed under a Creative Commons Attribution-NonCommercial-ShareAlike 3.0 Unported License.
This article can be downloaded to Android OS based mobile. Scan QR Code using Code/Bar Scanner from your mobile. (Scanners are available on Google Play store)
How to cite this article: