N A N O E X P R E S S
Open Access
A Tractable Method for Measuring
Nanomaterial Risk Using Bayesian Networks
Finbarr Murphy
1*, Barry Sheehan
1, Martin Mullins
1, Hans Bouwmeester
2,3, Hans J. P. Marvin
2,
Yamine Bouzembrak
2, Anna L. Costa
4, Rasel Das
5, Vicki Stone
6and Syed A. M. Tofail
7Abstract
While control banding has been identified as a suitable framework for the evaluation and the determination of potential human health risks associated with exposure to nanomaterials (NMs), the approach currently lacks any implementation that enjoys widespread support. Large inconsistencies in characterisation data, toxicological measurements and exposure scenarios make it difficult to map and compare the risk associated with NMs based on physicochemical data, concentration and exposure route. Here we demonstrate the use of Bayesian networks as a reliable tool for NM risk estimation. This tool is tractable, accessible and scalable. Most importantly, it captures a broad span of data types, from complete, high quality data sets through to data sets with missing data and/or values with a relatively high spread of probability distribution. The tool is able to learn iteratively in order to further refine forecasts as the quality of data available improves. We demonstrate how this risk measurement approach works on NMs with varying degrees of risk potential, namely, carbon nanotubes, silver and titanium dioxide. The results afford even non-experts an accurate picture of the occupational risk probabilities associated with these NMs and, in doing so, demonstrated how NM risk can be evaluated into a tractable, quantitative risk comparator.
Keywords:Risk assessment, Control banding, Bayesian
Background
Control banding has been identified [1, 2] as a suitable framework in which concerned stakeholders can evaluate and determine the risks of nanomaterials (NMs) to human health. Despite a broad consensus on the approach, there are no significant implementations that have a widespread support. This is because of known [3–5] inconsistencies in characterisation, toxicological measurement and exposure tests that are especially difficult to map using a risk tool. The low volume of quality data relevant to NM risk measurements presents further difficulties in the hazard potential. Widespread recognition that the hazard poten-tials of NMs can vary depending on chemistry, physico-chemical characteristics, concentration and the mode and time of exposure.
Several unique control banding (CB) solutions have been identified [6] that utilize exposure and hazard banding to evaluate occupational risk for nanomaterials. Each CB tool offers alternative methodologies in order to estimate the
exposure potential and hazard, and hence classify the pre-vailing risk within a ranking matrix. For example, NanoSafer [7] combines a hazard evaluation derived from data provided by technical information sheets, with an exposure assessment determined by the occupational setting and production rates to provide case-specific risk assessment of manufactured nanomaterials. Similarly, the Nano-Evaluris [8] CB solution assesses occupational inhalation risk pertain-ing to nanopowders by combinpertain-ing hazard and exposure band estimates with protective measures taken, process emission evaluation and frequency of use. The physical form (solid, liquid, powder or aerosol) of a manufactured nano-material is used to determine the exposure/emission poten-tial within the French agency for food, environmental, and occupational health and safety (ANSES) [9] CB framework, with the hazard band allocated according to the classifica-tion of the bulk or analogous material according to the clas-sification, labelling and packaging (CLP) regulation. While CB tools are effective in classifying risk and establishing risk management protocols 6, current applications have been criticised regarding their inability to produce transparent or easily communicable risk forecasts. Alternative frameworks
* Correspondence:[email protected]
1Kemmy Business School, University of Limerick, Limerick, Ireland
Full list of author information is available at the end of the article
employ multi criteria decision analysis (MCDA) and weight of evidence (WoE) approaches, which enable expert judge-ment and experijudge-mental data to be incorporated into the risk assessment [10–12]. Indeed, for regulatory purposes, MCDA-based tools may provide a more appropriate way to address issues surrounding data uncertainty [13, 14]. How-ever, the uncertainties underlying the use of expert opinion to interpret the quality of experimental evidence or to estab-lish weights for criterion in MCDA approaches may prove to have a critical effect on the resultant assessment [11]. Finally, methodologies borrowing from the finance industry [15], value of information and portfolio decision analysis can also be employed with some success.
Bayesian networks (BNs) can be utilised to overcome these limitations. BNs offer a reliable method for NM risk estimation owing to their ability to capture data sets that have a probability distribution of values or even missing values. These omissions are commonly observed in toxico-logical investigations related to NM risk characterisation and assessment. Furthermore, BNs allow for the incorpor-ation of expert opinion where data are lacking, and has the functionality to refurbish these assessments as new experi-mental data becomes available. The model can incorporate NM-specific physicochemical characteristics, exposure potential and hazard components relevant to NMs for all exposure routes. In this article, we demonstrate the use of BN in occupational settings (e.g. inhalation expos-ure). The risk estimation is transparent and can be used to prioritize further testing to increase accuracy. More detailed NM characterisation, toxicological and exposure information will produce a more accurate risk estimation.
This framework enables proactive, iterative risk assess-ment through its underlying Bayesian interpretation of probability. Probability is subjective representing a degree of belief that is updated as information or data is acquired. In scarce data environments, new experimental data and relevant data from literature to have a strong influence on posterior probabilities as the process is updated via the learning algorithm. This, we believe, is a strength over the existing quantitative MCDA approaches [11] as the uncertainty attributed to expert opinion diminishes as additional experimental data are acquired. The margin of exposure (or MOE) of a NM is the ratio of its no-observed-adverse-effect level (NOAEL) to its predicted dose. Within a BN, the MoE can then be mapped to a control banding framework that affords even non-experts an accurate picture of the risk profile associated with a particular NM. Furthermore, the value of the risk forecast is easily translated into a decision-making framework by applying the US Environmental Protection Agency (USEPA)-defined [16] inflection point of 1 (or 100% in percentage terms) to determine whether a specific NM poses a hazard to human health.
Methods
We apply our methodology to NMs made from silver (Ag), titanium dioxide (TiO2) and carbon nanotubes (CNTs) and focus on occupational exposure. For all three NMs, we source data from the US National Institute for Occupa-tional Safety and Health (NIOSH) exposure recommenda-tion reports [17–19] and EU funded research consortia [20–22] and then map the estimated risk to a control band-ing solution usband-ing our model. To test the validity of our approach, we run the model using a sample set of data from a European research consortium database [23].
BNs are a class of probabilistic models originating from the Bayesian statistics and decision theory combined with graph theory [24, 25], which are able to model dependen-cies between variables. They were developed as a probabil-istic structure in 1921 for the analysis of crop failure [26] and re-invented by many researchers under numerous pseudo-names such as causal network,belief network and influence diagram [27]. Modern applications of BNs are used in the fields of medicine [28], information technology and engineering [29], food fraud prediction [30] and envir-onmental and human health risk assessment [31–36].
BNs offer an adaptive risk evaluation framework on two separate levels. First, the model structure and parameteri-zation can be refined as contemporary research grows and improves the underlying assumptions used in the prelimin-ary model formulations. Second, BNs are easily updatable as new scientific data becomes available by means of learning and updating model parameters and probability distributions via Bayes’theorem [37]. The ability to incorp-orate a variety of traditional (i.e. experimental data) and non-traditional knowledge bases such as expert judgement, mechanistic or physical relationships and simulated data into the parameterization process of a BN appeals to the task of modelling complex systems in data-scarce environ-ments, such as the NM risk assessment arena [38]. Using BNs, a generalised risk assessment model (Fig. 1) can be followed for the purpose of risk characterization of poten-tially hazardous substances and then applied to a control banding framework.
the conditional probability tables which have proven adequate for these instances in the form of noisy probability distributions [39]. For example, there is a widespread uncertainty in the identification of hazard, or more precisely, in determining the lowest threshold for hazard identification. In applying BN, we resort toexpert elicitation from both primary (SANOWORK http://cor-dis.europa.eu/project/rcn/102461_en.html) and second-ary (NIOSH) data to ascertain input parameters and the influence thereof on predecessors and successors in the causal network leading to risk characterisation. Expert interpretations in terms of the potential for human health risk [40] are then incorporated in a BN where the uncertainty of risk-associated variables are described as probability distributions [41].
In line with Bergamaschi et al. (2015) [42], the following NM characteristics were selected as model parameters that contribute to hazard: size, surface area, chemical reactivity, surface charge, solubility and morphology. These were selected following an appraised of the litera-ture and selected based on their influence in the particle’s toxicological profile. They [ibid] also detail the hazard or effect consequence of each physicochemical characteristic. We also categorize NMs as carcinogenic, mutagenic or toxic for reproduction (CMR) [43]. The choice of physico-chemical characteristics is based on extant literature but of course there is no clear consensus within that literature set. BNs, however, can be configured to accommodate diverse user opinions on specific hazard impacts and multiple other parameters although a consensus or default assumption would make the prediction better.
For toxicants, a threshold exposure level can be derived, below which it is assumed there is no statistically significant adverse effect to human health. As a point of departure for this, the no-observed-adverse-effect level (NOAEL) is usu-ally derived in animal studies, then a safety or uncertainty factor is applied (usually 100) to determine the dose consid-ered safe for humans. In the absence of an experimentally determined NOAEL, the quantity lowest-observed-adverse-effect level (LOAEL) can be used as is the lowest dose tested for a potential hazard. Alternatively, the benchmark dose (BMD) [44, 45] method can be employed. We will use the termoccupational exposure limit(OEL) term as the upper boundary on acceptable dose concentrations. NIOSH
periodically disseminate new scientific data relating to po-tential occupational hazard from NMs (such as scientifically derived NOAELs) and recommend occupational exposure limits. There is, however, considerable disparity between recommended OELs proposed by NIOSH, regulatory bodies and academia. For example, current recommendations relat-ing to CNTs range from 1 to 50μm/m3[17]. NMs’human occupational exposure potential is the probabilistic measure of the propensity of the NM to enter the human body by inhalation, ingestion or dermal pathways. For NMs, there remains substantial ambiguity as regards the most relevant exposure metric [4, 46–48]. This remains a challenge as only a limited number of the nanomaterial parameters can be determined reliably [4, 49]. We have used the expectation– maximization (EM) learning algorithm in the BN to refine the conditional probabilities in parameterization of the risk assessment model using literature and experimental data. We also demonstrate the learning ability of BNs to handle risk data for CNT, Ag and TiO2NMs as new scientific data and/or expert knowledge becomes available. For example, recommended OELs and occupational exposure data provided in the NIOSH reports [17–19] are used to learn the parameters within their corresponding nodes.
Within each node of the BN, we incorporate experi-ence to measure the confidence attributed to the condi-tional probabilities inferred via specialist data sources. Any initial subjective choices of data can be refined to reduce bias using more data from diverse sources. This learning-through-experience feature allows us to con-tinually define the sensitivity of the models’ parameters to new information. The idea is that if a given expert (or a group of experts) has a low confidence in their initial data choice, new information would make a considerable impact on this initial estimate and support the subse-quent data with better confidence and experience. Once the model is updated with case data, the experience value corresponding to each state within a node coin-cides with the number of cases that have been observed.
Results
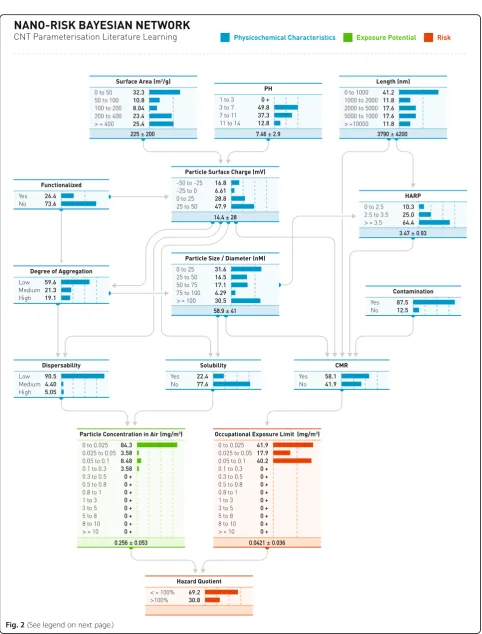
[image:3.595.57.540.90.168.2]data. This includes the discretized states and causal links between these states. The presence of a surface coating is also included as it is experimentally proven to induce changes in the state of specific structural determinants of hazard when compared to an uncoated, pristine state [42]. The degree of agglomeration/aggregation and dispersibility are additional characteristics known to be important fac-tors in the causal chain of assigning NMs risk potential [40]. Conditional relationships, signified by directed arrows starting from the influential parent nodes and ending at the child nodes, are determined by expert opinions derived from relevant contemporary literature [17–22] and SANO-WORK [32, 40]. For example, the directed arrow from De-gree of AggregationtoParticle Sizeimplies that the rate at which NMs attach to other NMs of the same type has a direct impact on the NM’s size distribution. Marginal vari-ables (i.e. the nodes with no network parents, (Coating, pH and Contamination)) are assumed to be represented by uniform distributions for unbiased parameterization when adequate knowledge is lacking [32].
The exposure potential component is conditionally linked to the physicochemical characteristics component via par-ent nodesdispersibilityandsolubility(Fig. 2). The relation-ship is inferred from the expert opinion (NIOSH reports) used in developing the influence diagram [40]. The NMs Concentration in Air variable is discretized into intervals that gradually increase in range as the value of the variable increases to offer increased granularity at the left tail of the distribution where the likelihood of occurrence is greater.
Both exposure potential and dose-response assessments are incorporated in the BNs to generate a quantitative forecast of risk with parameterization (Fig. 2). Two dis-tinct dose-response assessment models have been tested for carcinogenic (linear model) and non-carcinogenic (threshold model) toxicants [41, 50] via the OEL and are directly parameterized by its parent nodeCMR. Integrat-ing both of these dose-response assessment ideologies into the Bayesian framework enables us to create a risk assess-ment model that accounts for both inter-batch and experi-mental inconsistencies in the relevant data, and also captures the uncertainty surrounding the toxicity potential of many NMs [51].
We define the margin of exposure as the hazard quo-tient (HQ), quantified by dividing the exposure potential of NMs concentration in air by the threshold value OEL. The resultant value represents the initial deterministic risk forecast generated by the BN risk assessment model. If the
forecasted exposure level is greater than the threshold dose,i.e. HQ > 100%, there exists potential risks of adverse human health implications for the particular NM. The HQ can be refined through a robust learning process in BN and offers a coherent and quantifiable human health risk assessment. It consolidates exposure, hazard and dose-response assessments into a single risk forecast.
Discussion
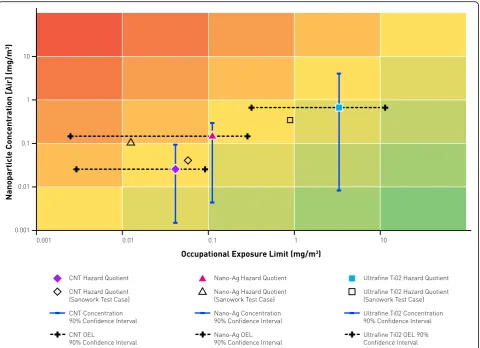
For CNTs, Ag and TiO2NMs, we created a database of information based on the NIOSH and EU research reports on each material [17–22]. Each NIOSH report referenced numerous publications from which the secondary data was sourced. We created 46 rows of CNT data, 39 rows of Ag data and 55 rows of TiO2data. All references and data are available as supplementary data. The datasets con-tained high levels of missing data as is typical of data from different sources. The results are plotted in a heat map (Fig. 3) and show the estimated risk of each material using the BN approach.
At a glance, we can see from Fig. 3 that CNTs, Ag and TiO2 NMs exhibit increasing levels of risk as we would anticipate. The heat map can be superimposed onto a con-trol banding solution that could exhibit hazard and expos-ure rows and columns, this may be particularly suitable for labelling purposes or a decision-making process. The relatively wide confidence bands are indicative of the amount and quality of the available data. Clearly, more data sources with less missing data will strengthen the degree of certainty.
To further validate our approach, we then applied the same BN approach to a primary data source, the SANO-WORK database. This is, in effect, an out-of-sample test to check the accuracy of thelearnedsystem. We include these results in Fig. 3. The results from the secondary and pri-mary data are consistent with expectations with the out-of-sample results falling within the 90% confidence interval.
Conclusions
Our BN approach has empirically found a solution to measuring the risk of NMs which has been a particularly vexing problem across the lifecycle of manufactured NMs. In this article, we have used secondary data from research articles cited by the NIOSH occupational exposure reports and EU research consortia to estimate the risk of CNTs, Ag and TiO2 and to map these results to a control banding solution that is intuitive and accessible to a wide variety of (See figure on previous page.)
interested parties. The approach identified here is applied with a particular bias on human health factors, particularly in an occupational setting but there is no reason not to ex-tend the approach to include a more general human health and environmental risks. To be sure, a greater discussion surrounding the input parameters and causal relationships is inevitable, but if a consensus can be found then, by defin-ition, we have a template for a database design that can be used by experts in categorization, exposure assessment and toxicology. Where more data from research and industry published to this template, then the accuracy of risk meas-urement would quickly increase.
Our approach is a quantitative solution that offers a more objective approach than subjective, semi-quantitative methods. In addition to offering an alternative in the continuum of risk modelling approaches (e.g. mechanistic, statistical, Bayesian and decision-analytic [13]) for NM risk, our BN tool could also be used in conjunction with a weight of evidence [10] approach and/or multi criteria deci-sion analysis methodologies [52]. With a quantitative result, users will be in a position to reduce exposure pathways or ameliorate hazard profiles by engineering the NM through
coating (say). This BN approach is a particularly powerful approach when combined with material modelling and safety by design paradigms. By modelling the physicochem-ical properties of proposed NMs, an estimate of the poten-tial risk increase/reduction of the resultant material can be derived. It may also be developed as a tool to promote occupational safety standards and extended to examine all NM lifecycle risks. With this said, the strength of BN ap-proach derives from a consensus view on the variables and a resultant standardised database. The corollary of disperse, heterogeneous datasets with a wide variability in material properties will limit the potential of BN techniques. There-fore, national and supranational efforts to standardise nano-material information sets are highly desirable.
Abbreviations
BMD:Benchmark dose; BN: Bayesian Networks; CB: Control Banding;
[image:6.595.59.540.87.435.2]Funding
This work was partially funded by the European Commission’s Seventh Framework Programme, The Sustainable Nanotechnologies (SUN) project. Grant no. 604305.
Authors’contributions
FM and BS carried out the main part of the data analysis and configuration. MM contributed to the structure and context. HB, HM and YB contributed ideas from biosciences. AC and ST provided categorization input and data. RD provided environmental input. VS provided toxicological input. All authors read and approved the final manuscript.
Competing interests
Prof. Vicki Stone currently receives research grants from Byk/Altana and GlaxoSmithKline. Via a number of EU FP7 funded projects I collaborate with industrial partners including BASF and Plasmachem. Her research group in the past has received research grants or consultancy funding from a number of industrial companies including British Petroleum, GlaxoSmithKline, Octel, Unilever and BHP Billiton, Powergen, National Power, Sandoz Pharma and ECETOC. No other author has an interest to declare.
Author details
1
Kemmy Business School, University of Limerick, Limerick, Ireland.2RIKILT Wageningen University & Research (WR), Akkermaalsbos 2, 6708 PD Wageningen, The Netherlands.3Division of Toxicology, Wageningen
University, Stippeneng 4, 6708 WE Wageningen, The Netherlands.
4
ISTEC-CNR, Via Granarolo, 64, I-48018 Faenza, RA, Italy.5Nanotechnology and Catalysis Research Center, University of Malaya, 50603 Kuala Lumpur, Malaysia.6Heriot-Watt University, Edinburgh EH14 4AS, Scotland, UK. 7Department of Physics, and Bernal Institute, University of Limerick, Limerick,
Ireland.
Received: 2 September 2016 Accepted: 7 November 2016
References
1. Mullins M, Murphy F, Baublyte L, McAlea EM, Tofail SA (2013) The insurability of nanomaterial production risk. Nat Nanotechnol 8(4):222–224 2. ISO (2011) Nanotechnologies–Occupational risk management applied to engineered nanomaterials–Part 2: Use of the control banding approach 3. Savolainen K, Backman U, Brouwer D, Fadeel B, Fernandes T, Kuhlbusch T,
et al. (2013). Nanosafety in Europe 2015–2025: towards safe and sustainable nanomaterials and nanotechnology innovations. Finnish Institute of Occupational Health, Helsinki.
4. Bouwmeester H, Lynch I, Marvin HJ, Dawson KA, Berges M, Braguer D et al (2011) Minimal analytical characterization of engineered nanomaterials needed for hazard assessment in biological matrices. Nanotoxicology 5(1):1–11 5. Johnston H, Pojana G, Zuin S, Jacobsen NR, Møller P, Loft S et al (2013)
Engineered nanomaterial risk. Lessons learnt from completed
nanotoxicology studies: potential solutions to current and future challenges. Crit Rev Toxicol 43(1):1–20
6. Subramanian V, Semenzin E, Hristozov D, den Zondervan-van Beuken E, Linkov I, Marcomini A (2015) Review of decision analytic tools for sustainable nanotechnology. Environment Systems Decisions 35(1):29–41 7. Jensen KA, Saber AT, Kristensen HV, Koponen IK, Liguori B, Wallin H (2013)
NanoSafer vs. 1.1-nanomaterial risk assessment using first order modeling, 6th International Symposium on Nanotechnology, Occupational and Environmental Health
8. Bouillard JX, Vignes A (2014) Nano-Evaluris: an inhalation and explosion risk evaluation method for nanoparticle use. Part I: description of the methodology. J Nanopart Res 16(2):1–29
9. Ostiguy C, Riediker M, Triolet J, Troisfontaines P, Vernez D (2010) Development of a specific control banding tool for nanomaterials. Expert committee (CES) on physical agents French Agency for Food,
Environmental, and Occupational Health and Safety, Maisons-Alfort Cedex 10. Hristozov DR, Zabeo A, Foran C, Isigonis P, Critto A, Marcomini A et al
(2014) A weight of evidence approach for hazard screening of engineered nanomaterials. Nanotoxicology 8(1):72–87
11. Hristozov D, Zabeo A, Jensen KA, Gottardo S, Isigonis P, Maccalman L, et al. (2016) Demonstration of a modelling-based multi criteria decision analysis procedure for prioritization of occupational risks from manufactured nanomaterials. Nanotoxicology. (just-accepted):1–48.
12. Tervonen T, Linkov I, Figueira JR, Steevens J, Chappell M, Merad M (2009) Risk-based classification system of nanomaterials. J Nanopart Res 11(4):757–766 13. Keisler J, Linkov I (2014) Environment models and decisions. Environment
Systems Decisions 34(3):369
14. Linkov I, Anklam E, Collier ZA, DiMase D, Renn O (2014) Risk-based standards: integrating top–down and bottom–up approaches. Environment Systems Decisions 34(1):134–137
15. Bates ME, Keisler JM, Zussblatt NP, Plourde KJ, Wender BA, Linkov I (2015). Balancing research and funding using value of information and portfolio tools for nanomaterial risk classification. Nat Nanotechnol 11:198–203 16. US-EPA (2014) Framework for Human Health Risk Assessment to Inform
Decision Making
17. NIOSH (2011). Occupational exposure to titanium dioxide. National Institute for Occupational Safety and Health, Cincinnati.
18. NIOSH (2013). Occupational exposure to carbon nanotubes and nanofibers. National Institute for Occupational Safety and Health, Cincinnati. 19. NIOSH (2015). Health effects of occupational exposure to silver
nanomaterials. National Institute for Occupational Safety and Health, Cincinnati.
20. Aschberger K, Johnston HJ, Stone V, Aitken RJ, Hankin SM, Peters SA et al (2010) Review of carbon nanotubes toxicity and exposure—appraisal of human health risk assessment based on open literature. Crit Rev Toxicol 40(9):759–790
21. Christensen FM, Johnston HJ, Stone V, Aitken RJ, Hankin S, Peters S et al (2010) Nano-silver–feasibility and challenges for human health risk assessment based on open literature. Nanotoxicology 4(3):284–295 22. Christensen FM, Johnston HJ, Stone V, Aitken RJ, Hankin S, Peters S et al
(2011) Nano-TiO2–feasibility and challenges for human health risk assessment based on open literature. Nanotoxicology 5(2):110–124 23. SANOWORK. SANOWORK (Safe Nano Worker Exposure Scenarios) 2015. 24. Bonafede CE, Giudici P (2007) Bayesian networks for enterprise risk
assessment. Physica A: Statistical Mechanics Applications 382(1):22–28 25. Nielsen TD, Jensen FV (2007) Bayesian networks and decision graphs.
Springer New York, Information Science and Statistics
26. Wright S (1921) Correlation and causation. J Agric Res 20(7):557–585 27. Heckerman D, Mamdani A, Wellman MP (1995) Real-world applications of
Bayesian networks. Commun ACM 38(3):24–26
28. Wiegerinck WAJJ, Kappen HJ, ter Braak EWMT, ter Burg WJPP, Nijman MJ, O YL, et al. (1999). Approximate inference for medical diagnosis. Pattern Recognition Letters. 20(11–13):1231–9.
29. Jensen FV, Nielson TD (2007) Bayesian networks and decision graphs. Springer, New York
30. Bouzembrak Y, Marvin HJ (2016) Prediction of food fraud type using data from rapid alert system for food and feed (RASFF) and Bayesian network modelling. Food Control 61:180–187
31. Goulding R, Jayasuriya N, Horan E (2012) A Bayesian network model to assess the public health risk associated with wet weather sewer overflows discharging into waterways. Water Res 16(16):4933–4940
32. Money ES, Reckhow KH, Wiesner MR (2012) The use of Bayesian networks for nanoparticle risk forecasting: model formulation and baseline evaluation. Sci Total Environ 426:436–445
33. Money ES, Barton LE, Dawson J, Reckhow KH, Wiesner MR (2014) Validation and sensitivity of the FINE Bayesian network for forecasting aquatic exposure to nano-silver. Sci Total Environ 473:685–691
34. Low-Kam C, Telesca D, Ji Z, Zhang H, Xia T, Zink JI et al (2015) A Bayesian regression tree approach to identify the effect of nanoparticles’properties on toxicity profiles. Ann Appl Stat 9(1):383–401
35. Winkler D, Burden F, Yan B, Weissleder R, Tassa C, Shaw S et al (2014) Modelling and predicting the biological effects of nanomaterials. SAR QSAR Environ Res 25(2):161–172
36. Linkov I, Massey O, Keisler J, Rusyn I, Hartung T (2015) From“weight of evidence”to quantitative data integration using multicriteria decision analysis and Bayesian methods. Alternatives Animal Experimentation: ALTEX 32(1):3–8 37. Wiesner MR, Bottero JY (2011) A risk forecasting process for nanostructured
materials, and nanomanufacturing. Comptes Rendus Physique 12(7):659–688 38. Hendren CO, Lowry M, Grieger KD, Money ES, Johnston JM, Wiesner MR et
al (2013) Modeling approaches for characterizing and evaluating environmental exposure to engineered nanomaterials in support of risk-based decision making. Environ Sci Technol 47(3):1190–1205
40. Morgan K (2005) Development of a preliminary framework for informing the risk analysis and risk management of nanoparticles. Risk Anal 25(6):1621–1635 41. Kandlikar M, Ramachandran G, Maynard A, Murdock B, Toscano WA (2007)
Health risk assessment for nanoparticles: a case for using expert judgment. J Nanopart Res 9:137–156
42. Bergamaschi E, Murphy F, Poland CA, Mullins M, Costa AL, McAlea E, et al. (2015). Impact and effectiveness of risk mitigation strategies on the insurability of nanomaterial production: evidences from industrial case studies. Wiley Interdiscip Rev Nanomed Nanobiotechnol 7(6):839–85. doi:10. 1002/wnan.1340
43. World Health Organization (2013). Agents classified by the IARC
monographs. World Health Organization, International Agency for Research on Cancer. http://monographs.iarc.fr/ENG/Classification. Last Accessed 2016. 44. U.S. EPA, (Environmental Protection Agency) (2012). Benchmark Dose
Technical Guidance.
45. Sa E (2009) Use of the benchmark dose approach in risk assessment 1 guidance of the scientific committee. EFSA J 1150:1–72
46. Sharifi S, Behzadi S, Laurent S, Forrest ML, Stroeve P, Mahmoudi M (2012) Toxicity of nanomaterials. Chem Soc Rev 41(6):2323–2343
47. Braakhuis HM, Cassee FR, Fokkens PH, de la Fonteyne LJ, Oomen AG, Krystek P, et al. (2015). Identification of the appropriate dose metric for pulmonary inflammation of silver nanoparticles in an inhalation toxicity study. Nanotoxicology 10(1):63–73
48. Simkó M, Nosske D, Kreyling WG (2014) Metrics, dose, and dose concept: the need for a proper dose concept in the risk assessment of nanoparticles. Int J Environ Res Public Health 11(4):4026–4048
49. Laborda F, Bolea E, Cepriá G, Gómez MT, Jiménez MS, Pérez-Arantegui J et al (2016) Detection, characterization and quantification of inorganic engineered nanomaterials: a review of techniques and methodological approaches for the analysis of complex samples. Anal Chim Acta 904:10–32 50. Calabrese EJ, Baldwin LA (2003) Toxicology rethinks its central belief. Nature
421(6924):691–692
51. Savolainen K, Backman U, Brouwer D, Fadeel B, Fernandes T, Kuhlbusch T et al (2013) Nanosafety in Europe 2015–2025: towards safe and sustainable nanomaterials and nanotechnology innovations. Finnish Institute of Occupational Health, Helsinki
52. Linkov I, Bates ME, Canis LJ, Seager TP, Keisler JM (2011) A decision-directed approach for prioritizing research into the impact of nanomaterials on the environment and human health. Nat Nanotechnol 6(12):784–787
Submit your manuscript to a
journal and benefi t from:
7 Convenient online submission
7 Rigorous peer review
7 Immediate publication on acceptance
7 Open access: articles freely available online 7 High visibility within the fi eld
7 Retaining the copyright to your article