Wolf, M. and Sims, Julian and Yang, Huadong (2015) Towards understanding
of value co-creation on web 2.0 platforms: an assessment methodology. In:
Kommers, P. and Isaías, P. and Fernandez Betancort, H. (eds.) ict 2015:
Proceedings of the IADIS International Conference ICT, Society and Human
Beings. IADIS Press. ISBN 9789898533418.
Downloaded from:
Usage Guidelines:
Please refer to usage guidelines at
or alternatively
TOWARDS UNDERSTANDING OF VALUE CO-CREATION
ON WEB 2.0 PLATFORMS: AN ASSESSMENT
METHODOLOGY
Author Name Placeholder 1
University of *Address *
Author Name Another
University of *Author Name the Third
University of *ABSTRACT
Web 2.0 technologies and social media can be used as a platform for value creation. While some firms are successful in engaging with external audiences on social media, others are less so. Many of these firms have equal access to web 2.0 platforms and operate in similar or same conditions, the resource based view (RBV) offers an explanation for disparities in performance of these organisations: the differences are due to firm internal, valuable, immutable and rare resources. Comparing high- and low-performers in a comparative case study helps to identify and highlight firm internal idiosyncratic resources that result in better sustained performances. In-depth studies inside the organisations answer the questions how and why some firms on the same platform can attract higher engagement levels than others. The problem is how to recognise best and worst performance to conduct in-depth case studies? This paper introduces ALIAS – a methodology for identification of the relative firm performance within a population, and selection of theoretically relevant cases to conduct comparative case studies through the lens of RBV. The proposed methodology is a five step process and utilises the DART framework of value co-creation for identification and assessment of performance criteria.
KEYWORDS
Resource Based View, Co-Creation, Theoretical Sampling, Social Media, Web 2.0, ALIAS
1.
INTRODUCTION
Strategic management studies focus on explanation of firm’s performance (Bromiley and Rau, 2014). The Resource Based View (RBV) (Wright et al., 2001, Bowman and Ambrosini, 2003) offers a theoretical lens that links sustained organisational performance to firm internal, idiosyncratic and specific resources. The problem with further investigation of “sustained organisational performance”, is the researcher’s ability to recognise it and to select “interesting” cases – the best, the worst, or the average performers. This paper introduces a case selection methodology based on the DART value co-creation framework (Prahalad and Ramaswamy, 2004) for theoretical sampling (Glaser and Strauss, 1967, Eisenhardt, 1989, Rouse and Daellenbach, 1999, Yin, 2009) of cases in social media engagement. The methodology allows the identification of firms’ relative performance and so the selection of best, worst or average performing firms in the realm of social media engagement.
1.1
Resource Based View of the firm
2003, Rouse and Daellenbach, 1999) suggests, that performance differences are routed in firm specific,
valuable and immutable resources. The challenge in assessing these idiosyncratic factors is that these are by
nature and definition firm internal and specific and thus are unlikely to be revealed in a large-scale study on a set of organisations (Rouse and Daellenbach, 1999). Organisation’s activity on public social media is one of those cases, where all firms have equal access to the same technological platform. Some firms manage to create high levels of engagement and (co-) create value with their external audiences, others less so (Gebauer
et al., 2010). For an outside researcher the “what” on social media is publicly available and observable (who
are participants, who creates the posts, who comments on them and what is the content). The RBV addresses
the questions of why and how some firms manage to create a dialogue while others don’t. The proposed
methodology aims at aiding the research informed by the RBV and answering the why and how questions.
The cases selected at the end of the selection process are deemed to be theoretically relevant cases
(Eisenhardt, 1989, Rouse and Daellenbach, 1999) in the context of co-creation engagement on social media.
1.2
DART framework
Prahalad and Ramaswamy (2004) use the DART-framework to explain co-creation of value through
Dialogic communication, Transparent Access to information by all parties, and Risk-benefits balance (added
value for all participants).
A dialogue is conversation in which a power balance between all participating parties is maintained (Kent
and Taylor, 1998). Dialogue, according to Habermas’ ideal speech situation, requires all parties to be true to themselves, have the same opportunity to participate and equal power to influence others, and allows every statement to be questioned and debated (Leeper, 1996).
Access to social media is fairly unregulated and egalitarian – firms and individuals have often access to
the same set of technologies (Boyd and Ellison, 2008), however the organisations (as well as individuals) can often control access to “their” pages; platform providers further limit access though terms and conditions of service (Stein, 2013). In addition to that, not all social networks are equal, and in case of enterprise social networking site the organisation has a far higher level of access control (Leonardi et al., 2013).
The balance between Risk and Benefits is closely linked to the balance of power and dialogic
communication – the ability to “influence” products and brands is valued by former consumers (Hanna et al., 2011), at the same time as the organizations are in danger to be “relegated to the sidelines” (Kaplan and Haenlein, 2010). An engaged and ongoing conversation between all participants would contribute to the maintenance of the risk/benefit balance.
Transparency is closely linked to access and dialogue. Allowing transparent access to information levels
the knowledge/power field and contributes to dialogue, it also has positive effects such as leaky pipes (Leonardi et al., 2013) when users for whom the content was not initially intended become aware of it and discover valuable information.
The better performing organisations within the DART-framework have (1) a higher level of dialogue and access, (2) higher transparency and (3) few exclusions.
1.3
Theoretical Sampling
Grounded Theory, introduced by Glaser and Strauss (1967), focuses on the theory-building with emphasis placed on qualitative data (Layder, 1993). Theory building process begins as closely to the “ideal of no theory” as possible (Eisenhardt, 1989), the researcher enters an iterative process of collecting and analysing data during which the constructs emerge. The data collection is guided by the principle of “theoretical sampling” – the most revealing or outstanding cases are selected for closer investigation (Creswell, 2013). This means, that instead of selecting a possibly random and statistically representative sample, a few “relevant” cases are selected (Yin, 2009, Eisenhardt, 1989, Rouse and Daellenbach, 1999). The general approach is to select (1) theoretically relevant cases and (2) as many as required to reach saturation.
variable” (p. 961) cases are selected based on the observable “outcome”: most successful companies, popular blogs, best paid actors etc.. The cases are chosen in conjunction with each other. For example extreme cases of polar types, or similar cases with controlled environmental variation (Eisenhardt, 1989, Glaser and Strauss, 1967, Rouse and Daellenbach, 1999) or based on experience of a same phenomenon such as the introduction of new technology (Barley, 1986).
1.4
Social Media Engagement
Web 2.0 technologies appear to open new sources for value creation (Kietzmann et al., 2011, Kaplan and Haenlein, 2010) and potential for involvement of new and more audiences in the process of value (co-) creation (Laroche et al., 2012). The term “Web 2.0” refers to the set of technologies and ideologies that enable and drive media rich content creation on the internet (Kaplan and Haenlein, 2010). The ideological foundation of Web 2.0 is rooted in the open source ideology, where users have free access to information and tools and can create and expand the available resource base in collaboration with other participants.
Participative behaviour and engagement from a broad community of contributors allowed a number of well-known products to establish themselves in the world: the apache web-server (http://www.apache.org) and MySQL (http://www.mysql.com/about/) – are tools created by the community for the community, Wikipedia (http://www.wikipedia.org) is another example of content co-creation project. Commercial organisations are trying to engage with their supplies (Jussila et al., 2011) and consumers (Gebauer et al., 2010) to create additional value, to innovate (Martini et al., 2014), to engage with an innovative workforce (Tsai and Yang, 2010), and to enhance brand value (Nandan, 2005).
The “engagement” on social media takes different forms – it takes the form of content sharing (actors create their own content, e.g. videos on YouTube), content co-creation (for example Wikipedia articles), collaborative innovation and product design (for example the apache webserver). Each of these engagement scenarios requires a new definition of actor groups and engagement criteria.
This paper introduces a methodology for case selection for comparative multiple case studies (Yin, 2009): acknowledging that Web 2.0 technologies offer a fruitful platform for value co-creation, this paper utilises the DART framework (Prahalad and Ramaswamy, 2004) to identify and measure the performance of co-creational activities on social media and applies the RBV (Wright et al., 2001, Bowman and Ambrosini, 2003, Rouse and Daellenbach, 1999) lens to identify the promising cases for theoretical sampling (Glaser and Strauss, 1967, Eisenhardt, 1989, Rouse and Daellenbach, 1999) of study cases.
2.
ALIAS – A CASE SELECTION METHODOLOGY
The case selection framework consists of five steps: Actor identification, Limitation of the population,
Identification of observables, Assessment of Performance Indicators, and Selection of cases. Each step of the
process links back to specifics of Web 2.0, the DART-framework, necessities of theoretical sampling, or is motivated by RBV. Each step would produce results which will inform the subsequent steps: in this paper the example used for purely illustrative purposes, is a hypothetical engagement activity between software developers and customers/users of CRM software on a social media site where users can publish (post) ideas and questions and other users can reply and comment.
2.1
Actor identification
Notably, the (possible) actors can and probably will change during data collection phase (e.g. business analysts might emerge as a distinctive participant group); the preliminary list is used as a guidance during the case selection process only.
2.2
Limitation of the population
Theoretical sampling is based on the idea that cases are chosen for theoretical, rather than statistical reasons (Glaser and Strauss, 1967, Creswell, 2013). The population, from which the sample is drawn needs to be defined first: to aid later cross comparison of cases (Rouse and Daellenbach, 1999), to sharpen the focus of the study and increase the transferability of findings (Eisenhardt, 1989), and to aspire a holistic or more focuses insight (Creswell, 2013). There are several approaches to limiting the population. (Rouse and Daellenbach, 1999) argue, that the internal resources can be “isolated”, made visible by comparing better and worse performing firms within same strategic group of an industry; (Eisenhardt, 1989) proposes to control for external factors when defining the population, (Barley, 1986) selected organisations based not only on external factors and same strategic group, but also based on their simultaneous experiences of introduction of a technology. Other, more mundane and practical considerations such as travelling time, language abilities and financial resources for the study might play a considerable role in the limitation of potential population.
In the example of developer/customer engagement, the population could be limited to CRM providers from the UK, whose target market are SMEs in the South East of England. This sufficiently controls for environmental variables such as labour- and other law regulations, currency risks, political and economic environment, as well as defines and limits the market segment, limiting not only the firm-actors (developers), but also limiting (and somewhat equalising) the customer-actors.
2.3
Identification of observables
Internal factors, (Rouse and Daellenbach, 1999), argue, can be revealed by comparing better and worse performing firms. The third and fourth steps of this methodology are concerned with identification of “performance” and subsequent assessment and evaluation of firms’ performance. This methodology uses the DART framework (Prahalad and Ramaswamy, 2004) for identification of observable “performance indicators” (PIs) – dialogue, access, risk/benefit, and transparency. Depending on the application, several observables can contribute to one or more indicators. The DART framework is an important guideline for selection of observable PIs. For example the ability to post comments without editorial approval could be linked to “transparency” and therefore can be included as a PI; the ability to pic a virtual avatar from a pre-defined list of icons does not contribute to dialogue, access, risk, or transparency and can, therefore not be deem a PI. Some observables can be expressed in binary values (e.g. “ability to remove posts” either exists or not), other observables can be measured as numbers (e.g. “average number of comments”) or other quantifiable units (e.g. “average time to get a reply to an answer”) – whatever the measurement, these are still comparable, i.e. firm “A” could have a greater number of average comments, and shorter response times than firm “B”. Other observables are qualitative and pose more challenges when comparing: e.g. statements such as “developers from firm A are more open about outstanding problems than those from firm B” would be harder to quantify.
In the example of developer customer engagement, the number of posts and number of active users are PIs linked to “dialogue”; system’s availability on variety mobile devices, and ease to register (anyone, based on corporate email, or explicit approval – “gate keeper”) are linked to “access”; the number of “personal” questions posted by the customers (i.e. descriptions of a specific problem), and the number of “personal” opinions posted by the developers are linked to “risk”; and the use of own name and position within the company is a PI linked to “transparency.
2.4
Assessment of performance indicators
data is collected and processed, the ethical considerations are less severe than when conducting intrusive studies such as ethnographies, interviews and observations.
[image:6.595.163.462.165.282.2]For the assessment, the findings for each firm can be recorded in a grid (Figure 1) and corresponding values recorded for each firm and PI. The numbers for the grid were randomly generated using Microsoft Excel RAND-function to aid as an example and are not intended as an example of empiric data.
Figure 1 - Assessment of Performance Indicators - sample assessment grid
The example here assessed activities of developers and customers of ten potential candidates for case studies. Each PI is linked to one of the features in the DART framework. Different types of data are presented – the dialogue PI’s are percentage values, access PI’s are discrete values, risk PI is a qualitative assessment of how “personal” the statements are, and transparency PI is a binary “yes/no” (1/0). Once the
data has been collected, the firms’ relative performance to each other is assessed. As it is the relative
performance of the firms compared on each PI – for example “# posts per user” for alpha developers is higher than for beta developers – the actual value assigned to each PI’s measure is not relevant (recording absolute value or e.g. value per 100 users – the relative performance does not change). This decouples the measurement scales for each of the PI and allows use of different variable types (continuous/discrete, absolute/percentage, numerals/times, etc.) for different PIs.
2.5
Selection of cases
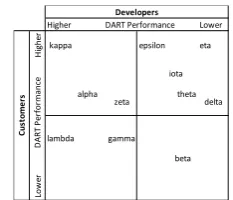
The framework starts off with the idea endorsed by (Rouse and Daellenbach, 1999), that intrinsic idiosyncratic firm resources and capabilities can be revealed by comparing high- and low-performing firms. In this example, the performance on each of the PIs (compare Figure 1) is assessed, and a rang order is built – e.g. “developers: # posts per user” results in (best to worst): kappa, epsilon, …, beta. Repeating this for each PI and each of the actor groups, the relative performance of the firms’ developers and customers becomes apparent (Figure 2). In this example, the qualitative data is not used to generate the grid, so that the resultant
figure represents performance for dialogue, access and transparency dimensions of the DART framework.
[image:6.595.251.368.547.647.2]The qualitative data from the “Risk: personal opinion” is used to complement the data, and support decision.
Figure 2 - relative firm performance grid to as selection of cases
“Kappa” exhibits high scores for dialogues, access, and transparency for both actors; Lambda’s developers are scoring much higher than its customers; eta’s customers outperform its developers; beta is a poor performer on both fronts. The framework indicates the theoretically interesting cases, however, the qualitative data and the research objectives might suggest other than the corner cases to be more “promising”. The framework does not aim at providing a definitive “one-size-fit-all” decision making facility, the clear picture and immediate visibility of the firms’ positions are intended as a guideline for the researcher to make an informed decision.
Risk Transparency Risk Transparency #Post per user % Active mobile (+1) tablet (+1) desktop (+1) register (3) email (2) approval (1) "Private opinion" Name and Position #Post per user % Active mobile (+1) tablet (+1) desktop (+1) register (3) email (2) approval (1) "Private opinion" Name and Position alpha 16 58 2 1 some devs 1 10 69 2 1 many custo- 1
beta 2 44 1 2 speak about 0 13 28 1 2 mers wor- 1
gamma 11 19 3 3 how they 0 2 24 2 3 ry about 1 delta 9 18 1 1 feel the new 1 7 52 2 3 the number 0 epsilon 18 23 2 2 release is co- 0 15 53 2 2 of unreported 1
zeta 14 13 1 3 ming along 1 12 14 3 3 bugs, and the 0
eta 8 29 1 2 some do not 0 16 59 3 2 time it takes 0
theta 5 22 1 3 say anything 1 18 51 1 1 to resolve. 1
iota 9 70 1 2 bar what is 0 17 15 2 3 Some do not 1
kappa 20 36 3 3 stated in the 0 14 59 3 3 care and just 0 lambda 16 71 3 2 manual 0 15 23 2 1 carry on 1
Dialogue Access
Developers Customers
Dialogue Access
Higher Lower Lower
H
ig
he
r
kappa epsilon eta iota alpha
zeta theta delta
The presented non-intrusive ALIAS methodology guides the researcher through the process of case selection for comparative case studies through the RBV lens. Co-creation involves two or more actors – the first step focuses on the definition of the actors. Theoretical sampling is selection of study-cases from a larger population – the identification and limitation of the population is the second step of the methodology. Third step utilizes the DART framework to define performance indicators. These indicators are assessed in the fourth step. In the final step, the population is arranged based on the relative performance and theoretically promising cases are indicated and made visible for further assessment or selection.
3.
CONCLUSION
Web 2.0 and social media have been a platform for value co-creation in a variety of areas including new products (Martini et al., 2014), designs (Gebauer et al., 2010), brands (Healy and McDonagh, 2013) etc. The DART framework (Prahalad and Ramaswamy, 2004) helps to identify criteria and “visible outcomes” of successful ongoing co-creation activity on social media. The “what” of the co-creation process – existence of a dialogue, openness and ease of access, balance of risk and benefits, and transparency of information can be
observed on public social media networks. Why and how some firms create a higher level of engagement than
others can be explained through RBV lens: given equal access to technologies, it is the firm’s internal resources and capabilities which lead to higher organisational performance (Rouse and Daellenbach, 1999, Wright et al., 2001). Comparative case studies as a research strategy can help to uncover and identify these internal resources (Rouse and Daellenbach, 1999). The five step methodology presented in this paper (1)
accounts for the duality of co-creation process and acknowledges different actors involved in the co-creation
process, (2) supports research focus and transferability by limiting the population, (3) utilizes the DART
framework for identification of performance indicators, (4) describes a non-intrusive, decoupled assessment
and relative comparison of performance indicators, (5) highlights relative high- and low performers within a
population and guides selection. This process allows the researcher to make an educated and informed
decision when using theoretical sampling (Glaser and Strauss, 1967, Creswell, 2013) for comparative case studies (Eisenhardt, 1989, Yin, 2009).
3.1
Advantages
The proposed methodology and ALIAS-framework provide a structured guideline for identification of theoretically relevant cases. The methodology accounts for a variety of co-creation activities and platform specific features, it allows a non-intrusive identification and assessment of a variety of performance indicators (PIs) and results in a comparative assessment of relative organisational performance.
Variety of activities and actors: The ALIAS framework allows a number of actor to be defined and
assessed e.g. designer/customer, engineers/designers, teachers/pupils/parents, trainers/trainees/universities etc. Thus the framework supports a variety of co-creational activities and is not limited to marketing-, brand-, and product management.
Platform specific features: The performance indicators are informed by the DART framework, but are
defined based on the application, depending on the specifics of the platform. In this paper’s example the ease
to register was used as a performance indicator for access. Other scenarios and platforms allow other
indicators e.g. “can upload video’s to company’s YouTube channel” (access indicator); or “hotels link to TripAdvisor reviews” (transparency indicator).
Non-intrusive identification of performance indicators: The identification of performance indicators is
done on public social networks. This means that (1) the features of the system are publically known, and that (2) level of control an organisation/user has over these features is also publicly known. For example Facebook has a “review” functionality which firms can turn on and off. This can be an indicator for transparency or access. The firms do not need to be consulted for identification of these indicators, which removes the need to communicate with potential firms prior to the selection and reduces the overheads.
Variety of variable types: The final assessment is that of firm’s relative performance. By comparing
comments (PI-2)”). This means that each PI can use its own variables, scale, and units as necessary. Qualitative variables can also be accommodated, the limitations of these are discussed further in this section.
Non-intrusive assessment: The data collection for the assessment is done on public networks and on
publically available information. This means that it can (technically) be done without explicit permission of each firm, however ethical considerations should still be paramount to any data collection. The limited amount of intrusion reduces communication overheads. In addition, the 24/7 availability of many social networks and Web 2.0 platforms makes the data collection independent of office hours and availability of informants.
Comparative assessment and relative performance: The final result of the assessment is a relative
position of a firm. The relative organisational performance is assessed for each group of actors individually, so that some firms can show case superior performance for one actor group and not for another. This allows comparison of firm’s relative performances along number of dimensions corresponding to the number of actors.
3.2
Limitations and applicatons
The proposed methodology and ALIAS-framework rely heavily on public accessibility and openness of social networking platforms. This in itself introduces a number of problems and limitations. The flexibility of the framework allowing a larger number of actors and a variety of performance indicators pose additional
challenges. Finally, the methodology is aimed at assessing performance in terms of engagement and not the
outcomes.
Public social networks: This framework is limited to publicly accessible, open networks. Proprietary,
enterprise social networks cannot be assessed (easily) using ALIAS. Some communication features of public platforms are not available to the public and are therefore not accessed and assessed. For example activity within some closed groups on LinkedIn is only visible to group members. Requesting group membership would create additional issues – for once, the researcher could not be eligible, secondly, the advantage of “non-intrusive” assessment is jeopardised.
Number of actors: The visualisation of relative organisational performance along two dimensions (for two
actor’s e.g. developers/customers) is possible in an easy to produce and legible 2-D grid. Visual presentation of three or more actor groups in a grid poses physical (and artistic) challenges and limits the usability of visual aids significantly.
Qualitative data: Performance indicators measured with qualitative data require more time to collect data
and to collect data reliably. For example the qualitative indicator “Do users express personal opinion?” requires the comments to be read. Additional questions arise: how many comments to read? When to stop? Read all comments or go some months back? How to “spot”, to record, and compare “personal statements”? Including qualitative data in performance assessment could make assessment more prolonged, comparison more difficult, and interpretations more fuzzy.
Co-creation outcomes: The framework is aimed at identification and gradation of firm’s performance in
terms of engagement in co-creation activities of social media. The methodology is assessing the co-creational
activity and not the outcome. For example in an attempt to create a new mobile app firm A could display
greater engagement levels than B, but B might produce a more successful app. This methodology is not intended to assess the co-creation activity outcomes, but the engagement levels.
Applications: The proposed methodology and ALIAS framework is useful for academics and
practitioners alike. The academic community will find it useful primarily in three scenarios: for theoretical sampling, comparative analysis, and variable identification for quantitative studies. The practitioners can utilise the framework for assessing relative positions of firm’s involved in co-creation activities, and for identification of engaged/dis-engaged actor communities when making informed decision about engagement strategies.
REFERENCES
Bowman, C. & Ambrosini, V. 2003. How the Resource‐based and the Dynamic Capability Views of the Firm Inform Corporate‐level Strategy. British Journal of Management, 14, 289-303.
Boyd, D. M. & Ellison, N. B. 2008. Social Network Sites: Definition, History, and Scholarship. Journal of Computer-Mediated Communication, 13, 210-230.
Bromiley, P. & Rau, D. 2014. Towards a practice‐based view of strategy. Strategic Management Journal.
Creswell, J. W. 2013. Qualitative inquiry and research design : choosing among five approaches, Los Angeles, SAGE Publications.
Eisenhardt, K. M. 1989. Building Theories from Case Study Research. Academy of Management, 14, 532-550.
Gebauer, H., Johnson, M. & Enquist, B. 2010. Value co-creation as a determinant of success in public transport services: A study of the Swiss Federal Railway operator (SBB). Managing Service Quality, 20, 511-530.
Glaser, B. & Strauss, A. 1967. The discovery of grounded theory: Strategies of qualitative research, London, Wiedenfeld and Nicholson.
Hanna, R., Rohm, A. & Crittenden, V. L. 2011. We’re all connected: The power of the social media ecosystem. Business Horizons, 54, 265—273.
Healy, J. C. & Mcdonagh, P. 2013. Consumer roles in brand culture and value co-creation in virtual communities.
Journal of Business Research, 66, 1528-1540.
Jussila, J. J., Kärkkäinen, H. & Leino, M. Benefits of social media in business-to-business customer interface in innovation. Proceedings of the 15th International Academic MindTrek Conference: Envisioning Future Media Environments, 2011. ACM, 167-174.
Kaplan, A. M. & Haenlein, M. 2010. Users of the world, unite! The challenges and opportunities of Social Media.
Business Horizons, 53, 59—68.
Kent, M. L. & Taylor, M. 1998. Building Dialogic Relationships Through the World Wide Web. Public Relations Review, 24, 321-334.
Kietzmann, J. H., Hermkens, K., Mccarthy, I. P. & Silvestre, B. S. 2011. Social media? Get serious! Understanding the functional building blocks of social media. Business Horizons, 54, 241-251.
Laroche, M., Habibi, M. R., Richard, M.-O. & Sankaranarayanan, R. 2012. The effects of social media based brand communities on brand community markers, value creation practices, brand trust and brand loyalty. Computers in Human Behavior, 28, 1755-1767.
Layder, D. 1993. New strategies in social research: An introduction and guide, Polity Press Cambridge.
Leeper, R. V. 1996. Moral objectivity, Jurgen Habermas's discourse ethics, and public relations. Public relations review,
22, 133-150.
Leonardi, P. M., Huysman, M. & Steinfeld, C. 2013. Enterprise Social Media: Definition, History, and Prospects for the Study of Social Technologies in Organizations. Journal of Computer-Mediated Communication, 19, 1-19.
Levitas, E. & Chi, T. 2002. Rethinking Rouse and Daellenbach's rethinking: Isolating vs. testing for sources of sustainable competitive advantage. Strategic Management Journal, 23, 957-962.
Martini, A., Massa, S. & Testa, S. 2014. Customer co-creation projects and social media: The case of Barilla of Italy.
Business Horizons, 57, 425-434.
Mckeown, T. J. 1999. Case studies and the statistical worldview: Review of King, Keohane, and Verba's Designing social inquiry: Scientific inference in qualitative research. International organization, 53, 161-190.
Nandan, S. 2005. An Exploration of the Brand Identity-Brand Image Linkage: A Communications Perspective. Journal of Brand Management, 04, 264-278.
Prahalad, C. K. & Ramaswamy, V. 2004. Co‐creation experiences: The next practice in value creation. Journal of interactive marketing, 18, 5-14.
Rouse, M. J. & Daellenbach, U. S. 1999. Rethinking research methods for the resource‐based perspective: isolating sources of sustainable competitive advantage. Strategic management journal, 20, 487-494.
Stein, L. 2013. Policy and Participation on Social Media: The Cases of YouTube, Facebook, and Wikipedia.
Communication, Culture & Critique, 6, 353-371.
Tsai, W. C. & Yang, I. W. F. 2010. Does image matter to different job applicants? The influences of corporate image and applicant individual differences on organizational attractiveness. International Journal of Selection and Assessment,
18, 48-63.
Wright, P. M., Dunford, B. B. & Snell, S. A. 2001. Human resources and the resource based view of the firm. Journal of Management, 27, 701-721.