International Journal of Emerging Technology and Advanced Engineering
Website: www.ijetae.com (ISSN 2250-2459,ISO 9001:2008 Certified Journal, Volume 5, Issue 12, December 2015)
16
Effective Aggregation - Precursor for Enterprise Data Mining
Frameworks
Rao Casturi
Georgia State University, Atlanta – GA-U.S.A
Abstract— Data Mining is an extension of information technology and knowledge gathering. The exploding growth of data poses a challenge in collection, processing and presenting as meaningful information to the end users. The Data Mining is a technique of extracting valuable information for making intelligent decisions. The accuracy of the extracted information depends on the source data and the techniques used in preparing the data for Data Mining use. The intermediate or preparation stage of processing the raw data to be presented for a Data Mining Framework is critical and time consuming. This paper will attempt to simplify the intermediate step based on a user defined rules to effectively reduce the Data Mining framework build in reasonable timeframe.
Keywords—Aggregation, Data Mining, Data Warehouse, Machine Learning, Data Mining Frameworks
I. INTRODUCTION
In the past two decades we saw an exponential growth in data generation systems. Data is everything. Change in a state of an object can be labelled as data. Switching on a lightbulb can be a simple binary data element whereas course correction event of a space craft can generate very complex and dynamic data points. A data set consists of all these change of state events. Understanding of these datasets became a necessity then nice to have for several organizations. With the expansion of the database systems in last 40 years, and the maturity of the data processing opened doors for new opportunities for researches to enhance the capability of understanding the data for decision making. By stating the facts from the collected data, users are looking information rich decision making golden bits of ―Data‖. Refining and presenting the information rich ―Data Sets‖ to the end user is usually called ―Data Mining‖. Data Mining became the number one priority for Information Technology (IT) industry. During 1960s the data collection and creation of various databases was based on file processing methods. In 1970s
and early ‗80s we saw the emergence of Database
Management Systems with hierarchical, networking and Relational Databases with several data modelling tools and Structured Query Language (SQL).
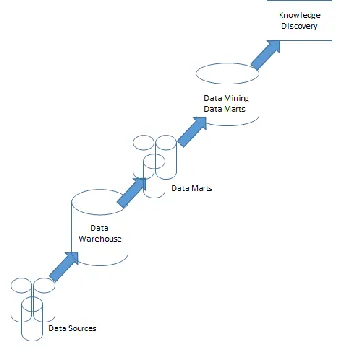
In the mid-80s and early 90s the development of advanced and more complex database systems promoted huge storage, retrieval and distribution of the data in a user consumable formats like web pages, xml files, form reports and other forms of information dissemination. This newer database designs and techniques also gave path way for new applications to have huge datasets. As an Example if we take particle physics or financial analysis of a company credit profiles we need to collect huge amount of data for analysis. The analysis of these huge data sets prompted to various newer techniques to save, retrieve and find meaningful information. The Data Mining is usually called the Knowledge Discovery from Data (KDD) which is more focused on the tail end of the spectrum of the data life cycle. The usual progression of in KDD [1] starts with data collection. Figure 1 shows the various steps of data processing before it can reach the KDD stage. As we see the Data Mining is a part of the knowledge discovery. Data Mining comes usually after the data transformation and before the evaluation models of various Patterns which help in KDD.
The current paper explores the dependency of the Data Mining techniques and efficient methods in implementing the pre requisite framework before building the Data Mining framework. The paper will focus on those building blocks where Data Mining techniques can be used and can save time in building an enterprise framework for Knowledge Discovery from Data set each organization currently source into a data warehouse or some kind of data store.
The current paper is divided into 7 major sections:
Introduction, Background, Project Proposal,
International Journal of Emerging Technology and Advanced Engineering
Website: www.ijetae.com (ISSN 2250-2459,ISO 9001:2008 Certified Journal, Volume 5, Issue 12, December 2015)
[image:2.612.84.253.231.405.2]17 The end result of our research paper is to creating the proposed intermediate aggregation data mart which will be used for Data Mining. The results section captures the various run instances and compares the current vs the new techniques implemented during this research. The different scenarios are captured and shown in a tabular and graphical format. Finally the summary and conclusion with a related future work is also proposed in this paper.
Figure 1 Data Mining – Knowledge discovery
The motivation for this paper came from the necessity to reduce the production time in generation of an aggregated and time series [4] reports on a daily basis for investors to assist in a data driven analysis. The dynamic nature of portfolio balancing in an investment management company can be very complex and time sensitive activity. This activity is dependent on time series data. The portfolio balancing is also time sensitive and depends on the efficient retrieval and analysis of the data points. The initial step of gathering aggregated data is key tasks which prompted us to research and propose a viable solution. This initiative is the current precursor for future Data Mining Framework.
II. BACKGROUND
There are several forms of money managers in the investment management organizations (Asset Management Company). The money managers are usually called portfolio managers or asset managers. They depend on various market indicators in managing the client‘s investments.
As an example, an individual is planning to retirement after 25 year from now. The Individual will buy into a retirement fund to which the individual will contribute a monthly payment as a saving, expecting the return on the savings to sustain and compliment the any other income during the retired years. The monthly payment the individual is going to put into a retirement fund is generally managed by an insurance company proving the retirement servers as one of their services. Usually the retirement fund company will consolidate all the individual retirement contributions and will hire an asset manager to manage their cash flow to match the future liabilities. The liability in this case is the insurance company able to provide the retiree the cash committed for retirement.
International Journal of Emerging Technology and Advanced Engineering
Website: www.ijetae.com (ISSN 2250-2459,ISO 9001:2008 Certified Journal, Volume 5, Issue 12, December 2015)
[image:3.612.61.278.139.252.2]18
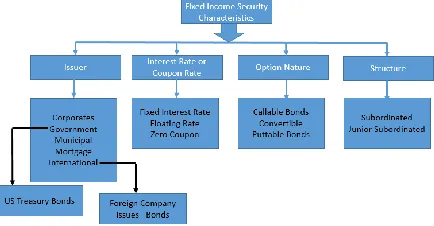
Figure 2 Fixed Income Instrument Classification
As every investment there are risks involved in fixed income investments too. At very high level the return from a fixed income security consists of 2 different parts. 1. The market value of the security when it was sold and 2. The cash flows received from the security over the time period that it is held, plus any additional income from reinvestment of the cash flow from the original bond. When compared with the initial investment vs the final cash received will determine the profit or loss. This is very crude way and the return calculations or portfolio management methods are out of the scope of our research paper. Several factors can impact the 2 parts of the equation. We can define the risk in any security as a measure of the impact of these market factors on the returns of the security. The different types of risks [2] [3] are show below (List is not extensive)
• Interest-rate risk or market risk
• Reinvestment risk
• Credit risk
• Yield-curve, or maturity risk
• Liquidity risk
• Currency risk
• Volatility risk
• Sector risk
Each security in the portfolio can have different analytics like Duration, Convexity, and Key Rate Duration etc. As market price of the instrument changes from day to day depending on market conditions, the risks mentioned above will impact the gain or loss of the investment. The gain or loss analysis of a portfolio consisting of hundreds of bonds is usually done at an aggregated level. The aggregation at various levels will give the portfolio manager a sense of the performance of the portfolio and can determine the suitable action to protect the investment. The aggregation can be a simple summation or complicated weighted average calculations. So this aggregated data is very helpful in decision making for a portfolio manager.
The availability of the aggregated data over a time period (series) will be very helpful indicator for portfolio manager.
III. PROJECT PROPOSAL
We get several analytical measures for each security we own in our portfolios from the analytics providers on a daily basis. As shown in the earlier section, these analytics are useful at the security level but as the portfolio managers and investment risk managers look at them at a portfolio level there is a need to roll up to the higher level which is called portfolio level. Once we roll up to the portfolio level there is also a very strong need to view them on various slices with aggregated data. The time series of aggregated data will give the portfolio and risk managers an insight into the portfolio migration on various analytical measures during an investment period. This time series analysis is the first step to identify any patterns in the performance of the portfolio depending in the market conditions. Market conditions we can say like Interest Rate increase or decrease. Liquidity issues, Credit Ratings etc.
The current project proposal includes using the existing Data Warehouse and its refined view of a fixed income data mart rather than recreating the current daily data sourcing process. The data warehouse consists of various sources including accounting information, analytical information and market related information along with the current portfolio holdings (PAR etc.) information. Each source is identified with a unique identifier to distinguish its origination. The current data warehouse set up is shown in the following Figure 3.
International Journal of Emerging Technology and Advanced Engineering
Website: www.ijetae.com (ISSN 2250-2459,ISO 9001:2008 Certified Journal, Volume 5, Issue 12, December 2015)
19 The other issue we noticed is the time to execute especially when extracting or querying time series data. The reduction of execution on time series data is another driver for this research project.
In our research, the aggregation is a very critical step in terms of building the next step of data mining activities or framework. The current structure of data existing in DM is not optimal for identifying any patterns easily or analysis for Investment Risk Management.. We approached this project in 2 folds. The initial set up we will use available software and resources without investing in any 3rd. party vendor software or any additional resources other than the research team. The second part of the project will build a simpler intermediate step of aggregation for the future development of data mining framework. The data store and data mart reside on an industry strength Microsoft SQL 2012 server hosted on windows server. The project is not focused on the daily data load processes or not intended to solve or optimize the data store structure but to extend the existing ODS / DM and create user friendly framework of the aggregation with a ―Rule Based Engine‖. The data quality [5] is a part of the initial daily ETL load process and is out of scope for the current paper. The data quality of the source data is out of scope for this research paper.
The Rule Based Aggregation Engine (RBAE) will be able to capture various aggregations or roll up rules from users and will create a set of pre aggregated measures in order to facilitate faster extraction and flexible reporting. The end deliverable will be the pre cursor for the next stage of data mining framework which we will be used for our future research. There was an extensive literature review done before proposing this intermediate stage as a solution. The existing data warehouse and data mart frameworks with the cube concepts were studied before considering and proposing a simpler solution in our paper. Implementing existing architecture in the market will add on to the costs to the project as well as longer time of implementation. The project scope is limited to one investment platform (fixed income) but the proposed architecture is very flexible and easily extendable to other platforms like Equity or Multi Asset platforms with very few modifications.
A. Current Architecture:
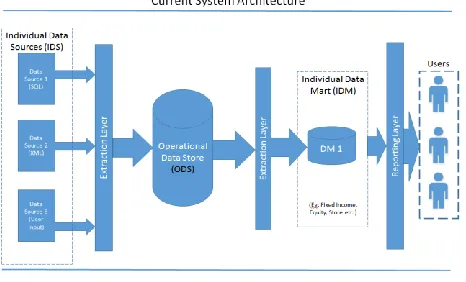
In the current architecture shown in the Figure 3 we build the Operational Data Store (ODS) from individual data sources. Example Accounting data bases and systems which feed the ODS. The daily analytics from vendor systems, user inputs like target values, internal ratings and daily trading activity data sources.
[image:4.612.327.560.442.583.2]Most of them reside on SQL databases but some of the user inputs come from EXCEL and Text Files. On a daily basis these various data sources provide input for ODS which will act as data repository for at the enterprise level. Some of the data sourcing into the ODS may not go through the Extract Layer (ETL). As an example, user inputs via excel are loaded through a SQL job to the database rather than an enterprise ETL framework. In our case the ETL framework is Microsoft SQL Server Integration Services (MS SSIS). During this phase the source data is collated and identified by a unique source id to store in the ODS. This ODS is not for the end users but for creating the next layer (DM or DM1). The next layer of ETL from ODS will create the required linkage between various data sources depending on the initial user requirements. This phase of implementation generates well-defined but still not aggregated data where users can use for analysis. The data delivery mechanism currently in place to explore by users is via various BI tools (Business Intelligence) like Microsoft SQL Reporting tool, WebFocus (IBI), MS Access, EXCEL etc. Current users use DM and it servers very well for certain detailed reporting. The current structure of DM supports the aggregation but not very efficient. For Data Mining activities and to build a KDD, the existing DM structure serves as a launch pad.
Figure 3 Current System Architecture
B. Proposed Architecture:
International Journal of Emerging Technology and Advanced Engineering
Website: www.ijetae.com (ISSN 2250-2459,ISO 9001:2008 Certified Journal, Volume 5, Issue 12, December 2015)
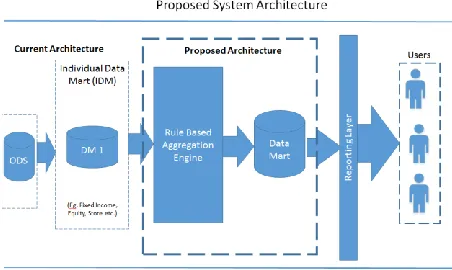
[image:5.612.56.282.348.483.2]20 As mentioned in our earlier sections the current DM1 structure is not in an aggregated format but the underlying tables utilize the relational database concepts and joined efficiently. This strong relational nature of the underlying tables will be utilized to create a standard join for various user defined calculations via a set of user defined rules. These various rules are saved to a database. The rules set up will be driven by a user friendly front end to avoid any unsupported joins inadvertently. The need for setting up a standard rules via a database table architecture will enhance the ability to modify and scale the organizational needs for the future data mining activities. The Users will be able to setup their own calculation rules and the engine will run them on daily basis. There is ability to turn on or off the calculations. The calculated data is stored in the next layer of DM which is called RBA Data Mart. The dotted part in the Figure 4 is the new proposed module to facilitate as pre cursor for the Data Mining framework.
Figure 4 Proposed System Architecture
C. Data Architecture:
In the proposed database architecture we have 4 main tables to support the entire Rule Based Aggregation Engine (RBAE). This architecture is flexible and open for future enhancements. The Main tables are as following. The first table one will hold the fields on which the users can set up
various aggregation rules. This table is called
GROUP_FIELD_MASTER. This table is a metadata table giving the engine the needed information about the specific filed to be included in the calculation. This table will also serve as the main driver for various distinct values for each field. The next table is the DISTINCT_VALUES. This table will have the distinct values a field can have by polling the database tables dynamically every day.
This is a key values table. This table plays a vital role in converting the values to the keys and vice versa. The next table is the GROUP_MASTER. This table holds the rules to aggregation. This is the table which is accessible to the user to set up individual aggregation rules using the FIELD_MASTER table as the look up for the available fields. If a specific field is not available the user can request the administrator to add the field to the available
list to reflect in the FIELD_MASTER. The
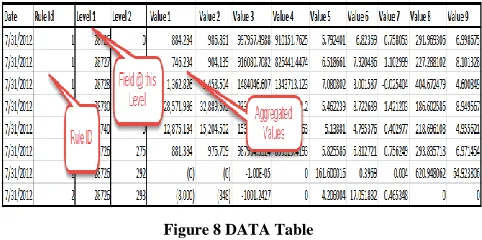
GROUP_MASTER table consists of the aggregation levels which current architecture provides is 12 level deep structure. The depth is defined as the last field for which the group calculation is done. In few cases the users may go to the depth of 12 and most cases we noticed the average depth calculation is at 5. This GROUP_MASTER also provides a filter condition which can be incorporated by the user to pick up or filter for specific data set from the overall DM1 View. The Last table is to hold the calculated values and it is called the FACT_DATA_MASTER. This aggregation engine will store the various user defined calculations in this table and this table will be exposed to the users with the proper link to the other 3 tables mentioned earlier to give the required calculated values. The structure of the tables and the output is shown below. These servers are not on any high performance [7] data clouds while we are doing our study.
[image:5.612.326.562.471.587.2]Figure 5 shows the Group Field Master table with sample data rows when set up for the user selection for the aggregation rule.
Figure 5 GROUP FIELD MASTER table
International Journal of Emerging Technology and Advanced Engineering
Website: www.ijetae.com (ISSN 2250-2459,ISO 9001:2008 Certified Journal, Volume 5, Issue 12, December 2015)
[image:6.612.55.287.135.281.2]21
Figure 6 DISTINCT VALUES table
[image:6.612.325.562.149.331.2]The next table shown in the Figure 7 is for the GROUP MASTER which holds the actual set up of the aggregation requested by the user.
Figure 7 GROUP MASTER Table
The final aggregated table which holds the rule id along with the data is shown in Figure 8.
Figure 8 DATA Table
[image:6.612.50.293.338.466.2]The overall table architecture is shown in Figure 9.
Figure 9 Overall Table structure with high level relationship
IV. IMPLEMENTATION
The overall implementation is divided into 3 parts. Part 1 is to create a procedure for the RBAE to read and use the user set up rules and calculate the desired values. Part 2 focus on the frontend for setting up individual rules by the end users. Due to the time limitations the current set up for the users will be done via the system administrator using the standard SQL tools for the updating the tables. The phase 2 will be the frontend for the users to set up the rules by themselves. Part 3 is to display the final aggregated results by the aggregation group set up by the users. For this step of implementation we used our existing BI reporting tools like (WEBFocus and SSRS).
[image:6.612.50.291.503.623.2]International Journal of Emerging Technology and Advanced Engineering
Website: www.ijetae.com (ISSN 2250-2459,ISO 9001:2008 Certified Journal, Volume 5, Issue 12, December 2015)
[image:7.612.56.283.131.388.2]22
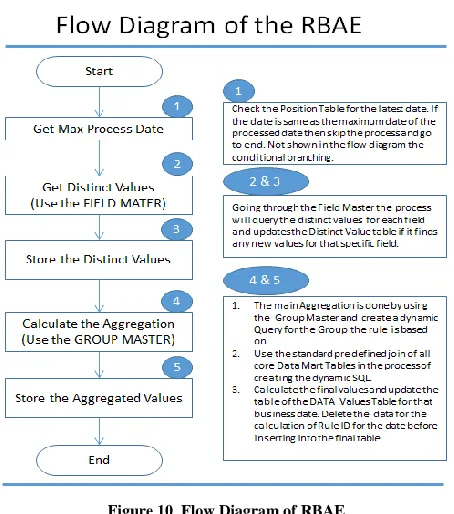
Figure 10 Flow Diagram of RBAE
The decision branch is not shown in the diagram above but branching logic is well incorporated in this phase of the project. All the steps are incorporated into a SQL Stored Procedure with parameter driven model to give the maximum flexibility for the end uses. On the fly calculations can be requested by individual uses by requesting a specific GROUP ID or Rule ID which will then initiate the calculation for the specific rule. The next 2 steps (2&3) in the process are designed to get the various distinct values for the fields for which the aggregation will be done. This step is necessary to speed up the code value conversion for the final data store. Example each field and the field value is denoted with a unique key in the distinct value table. Throughout the calculation the key is referenced either for calculation or for retrieval of the stored data. Currently field set up has 30+ fields and the distinct values in total are around 250,000+ values. The table design was optimised for future development. The growth of Distinct Values table won‘t have any performance drag on the actual process. In fact this will help in the calculation and helps in data storage capacity by converting the values to numerical values.
This Distinct Values table in future can be partitioned [6] by field groups if needed but with the stress test done on the table there won‘t be any need for this table for any further optimization than currently existing. The core logic for the actual aggregation is done in steps 4 & 5. The Step 4 will gather all the valid rules by going through the set up table (GROUP MASTER) and builds a dynamic query(s) in order to execute on the core building block of the related Data Mart (DM 1) tables. As mentioned earlier we have 6 core tables with defined joins to be used in order to access the Data Mart data. The current process will utilize the core Data Mart functionality and the relationship to run the various data slices needed for the end users. Currently we implemented this and gathering data for last 2 years to build the next step of our research project which is Data Mining.
V. RESULTS
International Journal of Emerging Technology and Advanced Engineering
Website: www.ijetae.com (ISSN 2250-2459,ISO 9001:2008 Certified Journal, Volume 5, Issue 12, December 2015)
[image:8.612.60.276.139.371.2]23
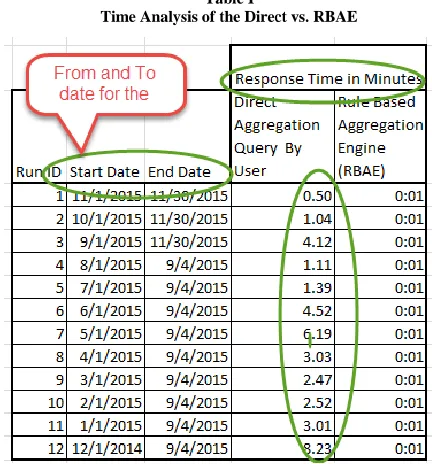
Table I
Time Analysis of the Direct vs. RBAE
[image:8.612.326.557.268.404.2]The timing graph is constructed using the observed data. On the X-Axis run id is plotted which represents the query run with a different date parameter to get the observations and on Y-Axis the time taken to observe the resulting output.
Figure 11 Time Analysis
VI. SUMMARY AND CONCLUSION
After going through several sets of executions and the observations made in the table I gives a clear picture of the Rule Based Aggregation Engine data architecture has a very fast response time compared to the non-aggregated DM structure even though the DM tables are very well related with the proper column keys.
The reason is clearly the RBAE aggregated the data for the end uses and is ready to be extracted using the regular query of by a business intelligence tool. The RBAE response time is negligible compared to the current model of data architecture. The pre aggregation saves lot of time in Data Mining if the users are trying to find any patterns. We also noticed the variation on timing taken on DM1 is not consistence compared to RBAE. This is due to the other users using the same data during our extraction period. This is a real simulation and we want to be as close as possible to the real world experience.
Figure 12 Data Mining Analysis
Apart from the timing analysis we also focused on the simple pattern recognition. Our research is also to see the validity of the Data Mining on an aggregated data. From our observations we see some outliers in the data set. This is shown in the figure 12. The figure 12 exposes the month end data for few month ends showing spike as there may be some correlation of market trends during the month ends to the holdings of the portfolios during the same period. This analysis is not easily possible by the end uses on the direct query method. The design of the RBAE this analysis on various data points are possible to mine into and understand the trends and correlation of the data vs the market conditions and also the portfolio characteristics. This analysis is a stepping stone for a better and wider data mining activities which can be used extensively in any organization.
VII. FUTURE WORK
[image:8.612.64.283.440.606.2]International Journal of Emerging Technology and Advanced Engineering
Website: www.ijetae.com (ISSN 2250-2459,ISO 9001:2008 Certified Journal, Volume 5, Issue 12, December 2015)
24 The Frontend build which will help managing the rules will be a good expansion to the existing framework even though it may not have any impact on the calculation engine or performance of the RBAE. During this research and implementation we found that the aggregation rules can be consolidated. Currently the same calculation can be set up by several individuals even though they can view the list of calculations already set up in the database by some other user. This duplication can be eliminated by prompting or restricting the user from setting up a duplicate calculation. Currently RBAE won‘t distinguish or filter the duplicate calculations as for the engine the unique setup is by Group ID not by the fields on with it should aggregate. This will save the processing time on RBAE.
The pattern algorithms are next step in the Data Mining [8]. Extending our research to the Data Mining Algorithms and machine learning is a natural progression. We are extending the project to cover the next steps in Data Mining which is pattern recognition. The final goal is to build the KDD framework using the existing infrastructure to be cost effective in the organization. The research can also be extended for other data bases like NoSQL [9] and MongoDB to see it our approach can be incorporated in with other vendor database systems like Oracle, MySQL etc.
REFERENCES
[1] Han, Jiawei, Kamber, Micheline, Pei, Jian. 3rd Edition. Data Mining Concepts and Techniques.
[2] Casturi, Rao, Design and Development of an Efficient Calculation Framework for Internal Rate of Return (IRR) of a Fixed Income Portfolio with SIMD Architecture, IJETAE, Volume 4, Issue 9, September 2014
[3] Fabozzi, F., Fabozzi, T. The Handbook of Fixed Income Securities Fourth Edition, IRWIN Professional Publishing, 1995.
[4] Esling, Philippe, Agon, Carlos, Time-Series Data Ming, Institu de Recherche et Coordination (IRCAM)
[5] Tijl De Bie, an Information Theoretic Framework for Data Mining, University of Bristol, Intelligent Systems Laboratory
[6] Zimmermann, Albrecht, The Data Problem in Data Mining LIRIS, INSA Lyon, France
[7] Thiagaraja, Arvind, Madden, Samuel, Querying Continous Functions in Database System. MIT CSAIL, USA
[8] Qamar, Sadaf , Adil, H Syed, FIT‘09, December 16–18, 2009, CIIT, Abbottabad, Pakistan Comparative Analysis of Data Mining Techniques for Financial Data using Parallel Processing
[9] Parker, Zachary, Poe, Scott, Vrbsky, Susan, Comparing NoSQL MongoDB to an SQL DB
Acknowledgement
First and foremost I wish to thank my Ph.D. advisor,
Professor Rajshekhar Suderraman, acting chair
department of Computer Science, Georgia State University for guiding me in the right direction during this project. I
also want to thank my company Voya Investment