The biomechanical effect of different types
of footwear on medial compartment knee
loading during stair ascent and descent
Sizhong Wang
School of Health Sciences
University of Salford, Salford, UK
Contents
Contents... i
List of figures...vi
List of tables...ix
List of abbreviations... x
Acknowledgements... xii
Abstract...xiii
Chapter 1: Introduction... 1
1.1. The anatomy of knee joint...1
1.2. Definition of knee OA...2
1.3. The prevalence of knee OA...2
1.4. The risk factors for knee OA...3
1.5. The management of knee OA... 3
1.6. The difference between level walking and stair walking...4
1.7. The framework of this study... 5
Chapter 2: Literature review... 6
2.1. The prevalence of knee OA...6
2.2. The economic burden of knee OA... 6
2.3. Risk factors for knee OA...7
2.3.1 Systemic factors... 8
2.3.1.1 Aging... 8
2.3.1.2 Genetics and Gender...9
2.3.1.3 Geography and nutritional factors... 9
2.3.2 Biomechanical factors...9
2.3.2.1 Obesity...9
2.3.2.2 Muscle weakness and joint laxity... 10
2.3.2.3 Injury...10
2.3.2.5 Malalignment...10
2.4. Biomechanical knee loading in level walking and stair walking...12
2.4.1 Level walking...12
2.4.2 Stair walking... 13
2.4.2.1 Ascending stair GC...14
2.4.2.2 Descending stair GC... 16
2.4.3 The difference between level walking and stair walking...17
2.4.4 Biomechanical knee loading assessment... 18
2.5. Clinical assessment of knee OA...20
2.5.1 Pain...20
2.5.2 X-ray... 21
2.5.3 Magnetic resonance imaging...22
2.6. Management of knee OA... 22
2.6.1 Self-management...23
2.6.2 Exercise...23
2.6.3 Pharmacological management of knee OA...23
2.6.4 Acupuncture... 24
2.6.5 Intra-articular injections...24
2.6.6 Operative treatment for knee OA...25
2.6.6.1 Arthroscopic surgery...25
2.6.6.2 High tibial osteotomy...25
2.6.6.3 Unicompartmental knee arthroplasty...27
2.6.6.4 Total knee arthroplasty... 27
2.6.7 Biomechanical treatments for medial knee OA... 28
2.6.7.1 Knee braces and sleeves... 29
2.6.7.2 Footwear and lateral wedge insoles...30
(i) Lateral wedge insole... 30
(ii) Variable stiffness shoe... 32
(iii) Melbourne OA shoe...33
(iv) Mobility shoe... 33
Chapter 3: Biomechanical method and test-retest reliability pilot study... 36
3.1. Instrumentation... 36
3.1.1 Cameras and force plates setting...36
3.1.2 System calibration and lab coordinate system set up...37
3.1.3 CalTester calibration... 38
3.2. Kinematic and kinetic data collection...41
3.2.1 Background... 41
3.2.2 Marker placement...42
3.2.3 Data collection... 44
3.2.3.1 Participants recruited... 44
3.2.3.2 The test procedure...44
3.2.4 Data processing... 45
3.2.5 The kinematic modelling...46
3.2.6 The calculations of the joint angle, joint moment and KAAI...48
3.3. A pilot study of test-retest reliability... 50
3.3.1 The assessment of data quality...50
3.3.2 Data analysis of the pilot study... 51
3.3.3 Statistics... 53
3.3.4 The results of the pilot study...53
3.3.5 The kinematic and kinetic results...53
3.3.5.1 Test-retest reliability of the knee and ankle kinetics and kinematics... 56
3.3.5.2 Test-retest reliability of walking speed and stance phase time and GRFs...57
3.3.6 The discussion of the pilot study...61
3.3.7 The conclusion of the test-retest reliability study... 62
Chapter 4: The biomechanical effect of different types of footwear on medial compartment knee loading during stair ascent and descent...63
4.1. Introduction...63
4.2.1 Research design...64
4.2.2 Staircase system set up...65
4.2.3 Test conditions and procedure... 66
4.2.3.1 Test conditions...67
(i) Condition 1: standard shoe...67
(ii) Condition 2: standard shoe + LWI...67
(iii) Condition 3: Melbourne OA shoe...68
(iv) Condition 4: variable stiffness shoe...68
(v) Condition 5: mobility shoe...69
4.2.3.2 Stiffness of the midsole and outsole of the footwear...69
4.2.3.3 The test procedure...70
4.2.4 AMTI stairway force structure...72
4.2.5 Data processing... 72
4.2.6 Statistical analysis... 74
4.3. The biomechanical results of the five footwear conditions... 74
4.3.1 Temporal-spatial parameters and Ground reaction forces... 75
4.3.2 External knee adduction moment...78
4.3.3 Knee adduction angular impulse...84
4.3.4 The response rate of the participants in terms of the reduction of the first peak of the EKAM and KAAI... 85
4.3.5 External knee flexion moment... 86
4.3.6 Knee joint kinematics in the sagittal plane... 87
4.3.7 Knee joint kinematics in the frontal plane... 88
4.3.8 External ankle eversion moment...90
4.3.9 Ankle eversion angle...91
4.3.10 Centre of pressure... 92
4.4. Discussion... 95
4.5. Conclusion...103
Chapter 5: Summary of the study and future works...105
5.2. Limitations... 105
5.3. Future works...106
Appendices...108
Appendix A: Research Governance and Ethics Committee approval letter... 108
Appendix B: Randomization Plan from (http://www.randomization.com)...109
List of figures
Figure 1- 1: The anatomy of the right knee joint. (A) Anterior view of the knee, and (B)
Posterior view of the knee) (Dutton, 2012)...1
Figure 2- 1: The number of annual knee replacements from 2003 to 2015 in the UK (Adapted from (National joint registry, 2016))...7
Figure 2- 2: The relationship between the prevalence of radiographic knee OA and age... 8
Figure 2- 3: The alignment of lower extremity, and the relationship between knee adduction angle (varus angle) and EKAM. (A) The alignment of lower extremity (Cooke et al., 2007), (B) Static knee varus angle (Andrews et al., 1996), and (C) Dynamic knee varus angle (Schmitz and Noehren, 2014)... 11
Figure 2- 4: Typical GC during level walking (Alam et al., 2014)...13
Figure 2- 5: (A) Step over step stair ascent, and (B) Step by step stair ascent (Aldridge Whitehead et al., 2014)... 14
Figure 2- 6: The GC of stair ascent (Novak et al., 2010)... 15
Figure 2- 7: The GC of stair descent (Novak et al., 2010)... 16
Figure 2- 8: The representation of the EKAM (Hinman and Bennell, 2009)...18
Figure 2- 9: The first and second peaks of the EKAM, and KAAI...19
Figure 2- 10: The grades of knee OA (Link et al., 2003)...21
Figure 2- 11: The radiograph of HTO for medial knee OA. (A) Opening wedge HTO, and (B) Closing wedge HTO) (Brouwer et al., 2006a)... 26
Figure 3- 1: The location of the fourteen OQUSTMinfra-red cameras and the four integrated AMTI force plates...36
Figure 3- 2: The position and orientation of the four force plates...37
Figure 3- 3: The L-frame, the calibration wand and the laboratory coordinate system... 37
Figure 3- 4: Calibration results of a successful calibration (with only nine cameras’ data shown)...38
Figure 3- 5: The tool of CalTester. (A) CalTester rod with two conical tips, (B) Wand with reflective marker, (C) Force application bar, and (D) Force base... 39
Figure 3- 6: The CalTester rod was used to apply forces to the force plate...40
Figure 3- 7: The CalTester report of the force plate 2...41
Figure 3- 9: Qualysis system and the wireless timing gates (Brower Timing Systems, USA).
...45
Figure 3- 10: (A) The digitized static markers in QTMTM, and (B) The linked segments model in Visual3DTM....46
Figure 3- 11: (A) The creation of Visual3D pelvis (https://www.c-motion.com), and (B) The creation of left Visual3D thigh...48
Figure 3- 12: Resolving the joint moment in a segment coordinate system... 50
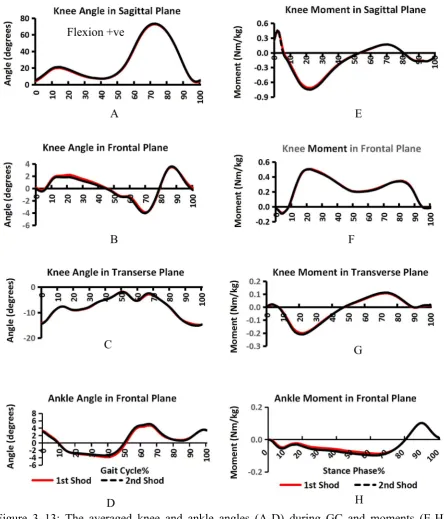
Figure 3- 13: The averaged knee and ankle angles (A-D) during GC and moments (E-H) during stance phase for the first session test (red line) in shod condition (own shoes) and second session test (dashed black line) in the same condition...54
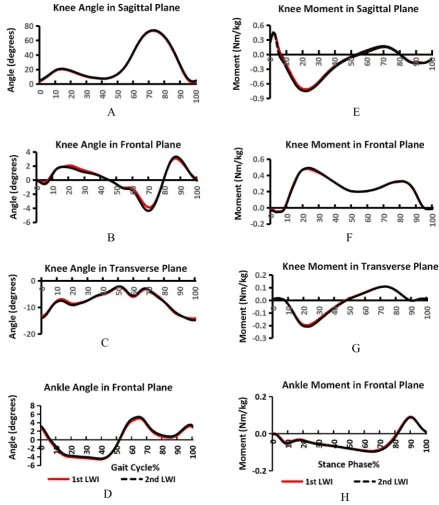
Figure 3- 14: The averaged knee and ankle angles (A-D) during GC and moments (E-H) during stance phase for the first session test (red line) in LWI condition and second test (dashed black line) in the same condition...55
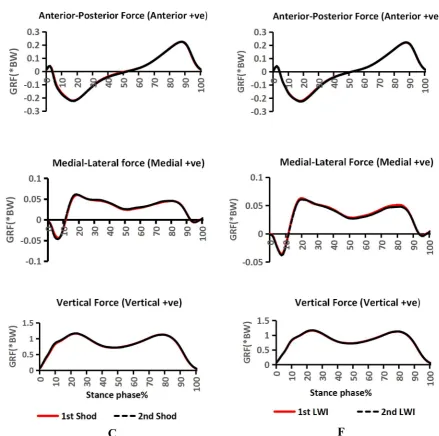
Figure 3- 15: The averaged GRFs in sagittal, frontal and transverse plane, in shod (own shoe) condition (A-C) and LWI condition (D-F) during stance phase. (The red line represents the first session test and the dashed black line represents the second session test)... 56
Figure 4- 1: (A) Interlaced handrail stairway (AMTI, USA), (B) Custom-built four-step wooden stair set, and (C) Combined stair set...66
Figure 4- 2: Standard shoe (Ecco Zen)...67
Figure 4- 3: Lateral wedge insole (SalfordInsoleTM, Nuneaton, UK)... 67
Figure 4- 4: Melbourne OA shoe (Gel Melbourne OA, ASICS Oceania Pty. Ltd.)... 68
Figure 4- 5: Variable stiffness shoe (ABEO SMART system® 3940)... 68
Figure 4- 6: Mobility shoe (Dr Comfort)... 69
Figure 4- 7: The four parts of the sole of the variable stiffness shoe... 70
Figure 4- 8: Ascending GC on step 2 (A-C), stance phase (A-B), swing phase (B-C)...71
Figure 4- 9: Descending GC on step 2 (D-F), stance phase (D-E), swing phase (E-F)... 71
Figure 4- 10: AMTI stairway structures...72
Figure 4- 11: Ascending GC on step 2 (A-C), stance phase (A-B), swing phase (B-C)...73
Figure 4- 12: Descending GC on step 2 (D-F), stance phase (D-E), swing phase (E-F)... 73
Figure 4- 13: The mean (SD) profiles of the medial-lateral GRF during stair ascent...75
Figure 4- 14: The mean (SD) profiles of the medial-lateral GRF during stair descent...76
Figure 4- 15: The mean (SD) profiles of the anterior-posterior GRF during stair ascent... 76
Figure 4- 16: The mean (SD) profiles of the anterior-posterior GRF during stair descent... 77
Figure 4- 18: The mean (SD) profiles of the vertical GRF during stair descent... 78
Figure 4- 19: The mean (SD) profiles of the EKAM during stair ascent...79
Figure 4- 20: The mean (SD) profiles of the EKAM during stair descent...83
Figure 4- 21: The mean (SD) profiles of the KAAI for the five conditions during stair ascent and descent (error bars denote SD and * indicates significant between-condition differences (p<0.05))...85
Figure 4- 22: The mean (SD) profiles of the EKFM during stair ascent...86
Figure 4- 23: The mean (SD) profiles of the EKFM during stair descent...87
Figure 4- 24: The mean (SD) profiles of the knee flexion angle during stair ascent... 88
Figure 4- 25: The mean (SD) profiles of the knee flexion angle during stair descent... 88
Figure 4- 26: The mean (SD) profiles of the knee adduction angle during stair ascent...89
Figure 4- 27: The mean (SD) profiles of the knee adduction angle during stair descent...89
Figure 4- 28: The mean (SD) profiles of the EAEM during stair ascent... 90
Figure 4- 29: The mean (SD) profiles of the EAEM during stair descent... 91
Figure 4- 30: The mean (SD) profiles of the ankle eversion angle during stair ascent...92
Figure 4- 31: The mean (SD) profiles of the ankle eversion angle during stair descent...92
Figure 4- 32: The mean (SD) profiles of the COP during stair ascent...94
List of tables
Table 2- 1: Level walking GC period and function (from (Rose and Gamble, 2006))... 13
Table 2- 2: Stair GC period (from (Zachazewski et al., 1993, McFadyen and Winter, 1988))14 Table 2- 3: Kellgren-Lawrence (K-L) grading scale...22
Table 3- 1: Visual3DTMmodel segments... 47
Table 3- 2: Conventions for gait measures...49
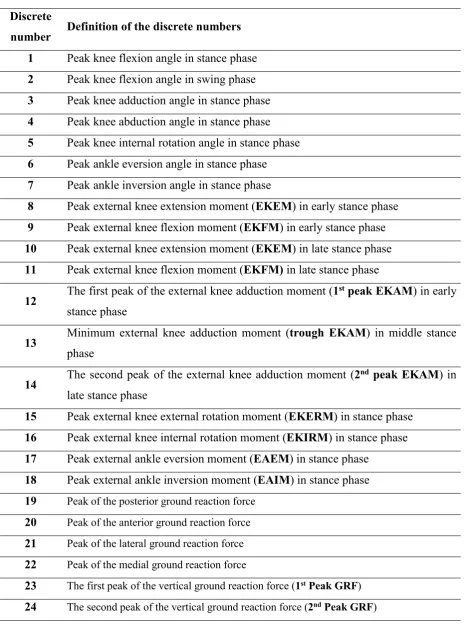
Table 3- 3: Description of the discrete parameters for knee and ankle angles, moments and GRFs... 52
Table 3- 4: Participants characteristics...53
Table 3- 5: The test-retest reliability of knee joint moments (Nm/kg) in sagittal, frontal and transverse planes... 58
Table 3- 6: The test-retest reliability of knee joint angles (Degree) in sagittal, frontal and transverse planes... 59
Table 3- 7: The test-retest reliability of ankle moments, angles and GRFs... 60
Table 4- 1: Hardness of the midsole and outsole... 70
Table 4- 2: Participants characteristics...75
Table 4- 3: Biomechanical outcomes (Mean±SD) of interest... 79
Table 4- 4: P-value of knee biomechanical parameters of interest between each condition...81
Table 4- 5: P-value of the GRF, single limb stance time and COP between each condition... 82
Table 4- 6: Effect sizes of knee biomechanical parameters of interest between each condition ...83
List of abbreviations
The following table describes the significance of various abbreviations used throughout the thesis and the page on which each one is defined or first used is also given.
Abbreviation Meaning Page
TF tibiofemoral 1
PF patellofemoral 1
PFP patellofemoral pain 2
OA osteoarthritis 2
ACL anterior cruciate ligament 2
PCL posterior cruciate ligament 2
EKAM external knee adduction moment 3
HTO high tibial osteotomy 3
UKA unicompartmental knee arthroplasty 3
TKA total knee arthroplasty 4
GC gait cycle 4
BW body weight 4
EKFM external knee flexion moment 4
LWI lateral wedge insole 4
DALYs disability-adjusted life years 6
FM mechanical axis of femur 10
TM mechanical axis of tibia 10
HKA hip-knee-ankle 10
LBA load bearing axis 11
GRF ground reaction force 18
KAAI knee adduction angular impulse 19
K-L Kellgren-Lawrence 20
VAS Visual Analogue Score 20
WOMAC Western Ontario and McMaster Universities Osteoarthritis Index 20 KOOS Knee Injury and Osteoarthritis Outcomes Score 20
WHO World Health Organization 21
MRI magnetic resonance imaging 22
BML bone marrow lesion 22
NSAIDs non-steroidal anti-inflammatory drugs 23
GI gastrointestinal 24
CV cardiovascular 24
ROM range of motion 27
EKEM external knee extension moment 27
NICE National Institute of Clinical Excellence 30
COP centre of pressure 30
EVA ethylene vinyl acetate 32
SD 3D
standard deviation 38
42 three-dimensional
ASIS anterior superior iliac supine 42
PSIS posterior superior iliac supine 42
DoF six-degree of freedom 46
ICC intra-class correlation 50
CI confidence interval 50
MDC minimal detectable change 51
SEM standard error of measurement 51
EKERM external knee external rotation moment 52 EKIRM external knee internal rotation moment 52
EAIM external ankle inversion moment 52
EAEM external ankle eversion moment 52
ANOVA analysis of variance 74
Acknowledgements
I am using this opportunity to express my gratitude and appreciation to everyone who had helped me throughout the research programme.
Firstly, I would like to express my deepest gratitude to my supervisors, Dr Anmin Liu and Prof. Richard Jones, for the guidance, encouragement and advice they provided during my research journey. Under their supervision, I am gradually entered into the field of biomechanics from physiotherapy, and realized the importance of using biomechanical interventions to treat musculoskeletal diseases from a perspective of biomechanics.
Secondly, I would like to thank all the participants who sacrificed their invaluable time to take part in my experiments. I would also thank the University of Salford for providing me available facilities and related software to collect and analysis data. I am grateful to staffs in the podiatry clinic, my friends from all over the world and colleagues in my office for providing me lots of help and advices in my study. I am also grateful to the statistician John and my friend Dr Angmorterh Seth who gave me a lot of help in statistics.
Thirdly, I would like to thank Dr Chris Bramah, who worked as a physiotherapist at the University of Salford’s running performance clinic, for allowing me to observe him assessing patients and showing me lots of biomechanical assessment and exercise prescription to patients with running-related injuries.
Most importantly, none of this could have happened without the support of my family. I am grateful to my families who have provided me spiritual and emotional support throughout the research project, especially my mother who is always encouraging me to keep moving.
Abstract
Introduction:
Biomechanical treatments for knee OA, especially the specially designed footwear and LWIs, are commonly investigated and used during level walking. The specially designed footwear and LWIs have been suggested to potentially prevent, delay or even halt knee OA progression by reducing knee loading during level walking. However, stair walking is more challenging for individuals with knee OA because the medial knee loading is greater than that in level walking, which is usually reflected as the first complaint for early to moderate knee OA patients during stair walking. The investigation of biomechanical load-reduction footwear on medial knee loading during stair walking is limited and there is no consensus on what kind of design parameters would definitely achieve the expected biomechanical effect. The purpose of this work was to investigate the biomechanical effect of the chosen footwear during stair walking.Method
:
3D motion analysis was collected on healthy individuals who were randomised to five different footwear conditions (standard shoe, LWI inserted into standard shoe, mobility shoe, Melbourne OA shoe and variable stiffness shoe) during stair ascent and descent. Each participant performed five valid trials of stair ascent and descent for both limbs under each condition. Repeated measures ANOVA and Friedman’s ANOVA were used for statistical analysis.Result:
Sixteen participants (eight male and eight female) took part in the study. The knee loading variables of the first and second peaks of the EKAM, and KAAI were significantly reduced when using LWI, Melbourne OA shoe and mobility shoe in comparison with the standard shoe during both stair ascent and descent. However, such reductions were not identified in the variable stiffness shoe.Chapter 1: Introduction
1.1. The anatomy of knee joint
[image:15.595.73.526.369.684.2]The knee joint is the largest and one of the most complicated joint in human body (Englund, 2010). It is composed of two separate joints: the tibiofemoral (TF) joint and the patellofemoral (PF) joint (Goldblatt and Richmond, 2003) (Figure 1- 1). The surfaces of these two joints are covered with articular cartilage which provides a low-friction gliding surface to decrease the friction forces. The stability of the knee joint requires static and dynamic stabilizers. The static stabilizer is primarily maintained by the collateral and cruciate ligaments, and the mainly muscular anatomy (quadriceps, hamstrings, and gastrocnemius) provides dynamic stability to the knee joint. Between the TF joint, the medial and lateral meniscus provide shock absorption and stability to the knee.
The knee plays an important role in human locomotion activities and daily performance. However, patellofemoral pain (PFP), meniscal injuries, anterior and posterior cruciate ligament (ACL and PCL) injuries can decrease both sporting and the level of daily physical activity. These musculoskeletal disorders also have common risk factors for future degenerative disease, such as knee osteoarthritis (OA) particularly when the individual progresses in age.
1.2. Definition of knee OA
OA is the most common type of arthritis among older people, defined as cartilage destruction and rebuilding of bone close to the joint (Das and Farooqi, 2008). OA can lead to joint pain, functional impairment and disability (Pouli et al., 2014). It is the fourth leading cause of disability worldwide with its incidence increasing in the last two decades (Woolf and Pfleger, 2003). One of the most commonly affected joints by OA is the knee, and knee OA can lead to functional limitations of lower extremity and is a major cause of disability globally (Guccione et al., 1994, Murray et al., 2012, Dillon et al., 2006).
1.3. The prevalence of knee OA
1.4. The risk factors for knee OA
Knee OA risk factors include both systemic and local biomechanical factors and whilst systemic risk factors (age, sex, genetics, hormones, bone mineral density, race/ethnicity) are generally unmodifiable (Sowers, 2001, Chaganti and Lane, 2011), the local biomechanical factors are modifiable (Chaganti and Lane, 2011, Guilak, 2011, Felson, 2004). These biomechanical factors (higher medial knee loading, knee malalignment, obesity, and muscle weakness) play an important role in both knee injuries and future knee OA. A detailed understanding of the knee biomechanics provides an essential framework to understand and assess the progress of knee OA. In order to relieve pain and improve function in individuals with knee OA, the biomechanical risk factors related to knee OA have increasingly gained attention. One of the primary factors related to the progression of knee OA is increased knee joint load (Andriacchi et al., 2009) and it is widely believed that medial compartment knee OA and its progression are caused by the excessive load on the medial side (Chang et al., 2007). The susceptibility of medial knee OA in Western populations is five to ten times higher than that in lateral knee OA (Felson et al., 2002, Ahlbäck, 1968). This may be caused by approximately 60-80% of compressive loading force transmitted to the medial side of the knee during walking (Chang et al., 2007). Since it is hard to measure the contact stress and joint force on medial knee compartment directly, the external knee adduction moment (EKAM) is a useful surrogate measurement of the relative load on the medial compartment knee and has been correlated with knee OA radiographic severity and severity of disease symptoms (Chang et al., 2015, Andriacchi et al., 2009). This has led to reducing the peak EKAM as a common goal to improve pain and delay the onset and/or progression of medial knee OA (Hunt and Bennell, 2011, Shull et al., 2013).
1.5. The management of knee OA
Management of knee OA is broadly divided into surgical and non-surgical treatments that depend on the patient’s stage of disease and individual characteristics. The common surgical treatments include:
arthroscopic surgery,
high tibial osteotomy (HTO),
and total knee arthroplasty (TKA).
The common conservative management options include: patient education,
weight control,
muscle strengthening exercise, acupuncture,
and using biomechanical load reducing treatments.
Biomechanical load-reduction treatments such as knee braces, knee sleeves, insoles and footwear may be effective interventions for medial knee OA, with the primary mechanism to reduce the EKAM (Ramsey and Russell, 2009). There are different types of footwear widely used as a treatment of medial knee OA and many studies have reported that lateral wedge insole (LWI) (Shimada et al., 2006, Hinman et al., 2012), variable stiffness shoe (Erhart et al., 2010a, Erhart et al., 2008), Melbourne OA shoe (Kean et al., 2013, Bennell et al., 2013), and Moleca shoe (Trombini-Souza et al., 2015) could reduce medial knee loading during level walking. Compared with other biomechanical treatments (such as knee bracing, knee sleeves, etc.), using a pair of biomechanical shoes is an inexpensive option for conservative treatment and could be used every day.
1.6. The difference between level walking and stair walking
during stair ascent, and a larger range of knee motion is required during stair ascent and descent (Andriacchi et al., 1980).
The effect of biomechanical load-reduction insoles or footwear during stair walking on knee loading in individuals with medial knee OA have been investigated by some researchers (Alshawabka et al., 2014, Sacco et al., 2012, Moyer et al., 2017, Al-Zahrani et al., 2013). However, no research has compared LWI and different biomechanical footwear during stair walking. Therefore, the main purpose of this thesis was to investigate the biomechanical effect of different types of footwear (including insoles within footwear) on knee medial joint loading during stair ascent and descent.
1.7. The framework of this study
Chapter 2: Literature review
2.1. The prevalence of knee OA
The lifetime risk of developing knee OA is about 46% (Murphy et al., 2008) and it is estimated that around 10-13% of individuals aged 60 years and over have symptomatic knee OA (Zhang and Jordan, 2010). Van Der Pas et al. (2013) reported that 20.2% community-dwelling residents aged 65-85 years had clinical knee OA among some European countries (Germany, Italy, the Netherlands, Spain, Sweden and the UK). In Spain, 10.2% of the adults aged 20 and over reported symptomatic knee OA in a health survey in 2000 (Carmona et al., 2001).
2.2. The economic burden of knee OA
Individuals with knee OA are more likely to increase their pain intensity, physical limitations, and functional restrictions with the progression of disease (Sutbeyaz et al., 2007) and the medial knee OA is one of the leading causes of pain and disability among older adults (Favre et al., 2016, Dillon et al., 2006). The limitations of daily activities (such as level walking, stair walking, and squatting) are common complaints to individuals with knee OA (Farr Ii et al., 2013). Knee OA affects not only the patients’ infected knee but also their mood and whole life, and ultimately changes their quality of life (Nyvang et al., 2016).
Given the high prevalence of knee OA in the population, its economic burden is large, and knee OA accounts for a high socio-economic burden in the western society (Neogi et al., 2009). Knee OA is a burden not only on individuals but also on healthcare systems and the overall economy (White and Waterman, 2012, Farr Ii et al., 2013). The economic costs of knee OA include direct costs and indirect costs. Direct costs consist of drug and non-drug treatments; indirect costs consist of lost work time, reduced work productivity, caregiver services, premature death as well as disability compensation (Chen et al., 2012).
2014). The economic cost of knee and hip OA in the general population of Spain was €4,738 million in 2007 which represented 0.5% of the gross national product in Spain (Loza et al., 2009). In Italy, the economic burden of a knee OA in 2004 contained: the direct costs added up to €934 and indirect costs came to €1236 for each patient within a year (Leardini et al., 2004). In the Netherlands, the costs of knee-related productivity and medical treatment for knee OA were averaged €871 per patient per month (Hermans et al., 2012). In the UK, the expenditure of total hip and knee replacements was £405 million in 2000, and £852 million in 2010 (Chen et al., 2012). According to the National Joint Registry’s (NJR) 13th Annual Report, the number of primary knee replacement operations in the UK was 871,472 between 2003 and 2015 and keeps increasing during these years (Figure 2- 1) (National joint registry, 2016). As both age and obesity are risk factors for the development of knee OA, it is estimated that the demand for joint replacements will continue to grow.
Figure 2- 1: The number of annual knee replacements from 2003 to 2015 in the UK (Adapted from (National joint registry, 2016)).
2.3. Risk factors for knee OA
and Lane, 2011). The biomechanical risk factors (altered joint loading), such as obesity, the adduction moment, malalignment, trauma, repetitive stress and muscle strength, play an important role in knee OA onset and/or progression, and may be modifiable (Chaganti and Lane, 2011, Guilak, 2011, Felson, 2004). A short summary of the risk factors is presented below.
2.3.1 Systemic factors
[image:22.595.106.439.288.551.2]2.3.1.1 Aging
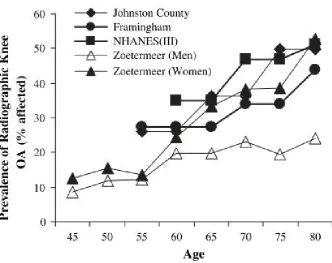
Figure 2- 2: The relationship between the prevalence of radiographic knee OA and age.
Data were extracted from the following studies: Johnston County (Jordan et al., 2007), Framingham (Felson et al., 1987), NHANES (III) (Dillon et al., 2006), and Zoetermeer (Van Saase et al., 1989). (Figure from (Shane Anderson and Loeser, 2010)).
those aged 55-64 to approximately 50% among those over 75 years old (Figure 2- 2) (Felson et al., 1987, Jordan et al., 2007, Van Saase et al., 1989, Dillon et al., 2006).
2.3.1.2 Genetics and Gender
The genetic factors have been shown to be a determinant of radiographic knee OA and the estimated heritability of knee OA was over 40% (Spector and MacGregor, 2004). Women are more likely to suffer from higher prevalence and greater severity of knee OA than men, especially after menopause (Srikanth et al., 2005). This gender disparity effect on knee OA may be explained by the oestrogen deficiency following menopause (Felson and Zhang, 1998).
2.3.1.3 Geography and nutritional factors
The incidence of symptomatic knee OA in rural areas are more likely to be higher than that in urban areas (Busija et al., 2010). The higher incidence of knee OA in rural areas may be explained by larger proportions of individuals occupied in heavy physical activities and repetitive use. Low calcium intake and low serum levels of vitamin D, which has direct effects upon cartilage metabolism and have been demonstrated to redevelop vitamin D receptors (Felson et al., 2000), appear to be associated with an increased risk for progression of knee OA (McAlindon et al., 1996).
2.3.2 Biomechanical factors
2.3.2.1 Obesity
2.3.2.2 Muscle weakness and joint laxity
It is generally accepted that the quadriceps muscle is a primary contributor to dynamic knee joint stability. This may be explained by quadriceps weakness leading to poor neuromuscular control and reducing the ability of knee shock absorption (Slemenda et al., 1998, Lewek et al., 2004). Van der Esch et al. (2006) demonstrated that individuals with knee OA with a high knee varus-valgus joint laxity and low flexor-extensor muscle strength were at highest risk of functional disability.
2.3.2.3 Injury
Knee injury is an important risk factor for early-onset and development of knee OA (Johnson and Hunter, 2014, Lohmander et al., 2007, Muthuri et al., 2011). Individuals with a major knee injury history are 3-6 times more likely to develop knee OA (Felson and Zhang, 1998) and are diagnosed almost 10 years earlier than those without a history of knee injuries (Brown et al., 2006). Felson and Zhang (1998) also reported that approximately 14-25% of the incidence of symptomatic knee OA could be reduced by preventing knee injuries.
2.3.2.4 Repetitive joint stress
It is reported that overload stress on the articular surface could lead to OA in uninjured joints and the physical demanding activities (running, jumping, and squatting, et al.) with repetitive stress on knee joint were more likely to cause early onset of knee OA (Buckwalter et al., 2013). A higher prevalence of knee OA has been found among athletes and this may be caused by repetitive impact loading on the articular surface of the knee joint and thus leading to knee cartilage degeneration (Caine and Golightly, 2011, Frizziero et al., 2012).
2.3.2.5 Malalignment
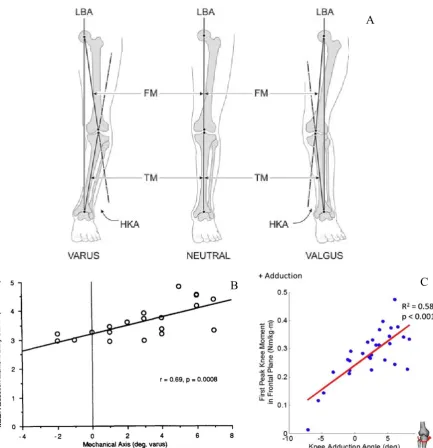
Figure 2- 3: The alignment of lower extremity, and the relationship between knee adduction angle (varus angle) and EKAM. (A) The alignment of lower extremity (Cooke et al., 2007), (B) Static knee varus angle (Andrews et al., 1996), and (C) Dynamic knee varus angle (Schmitz and Noehren, 2014).
Neutrally, the load bearing axis (LBA) is defined as the line goes through the hip centre to the ankle centre, and the LBA is coincident with the FM and TM; if the LBA goes through the medial knee, it is called the knee varus (bowlegged); and if the LBA goes through the lateral knee, it is called the knee valgus (knock-kneed) (Figure 2- 3 (A)) (Cooke et al., 2007). The higher static and dynamic knee adduction angles (Figure 2- 3 (B) and (C)) are, particularly the dynamic knee adduction angle during walking, the more likely will the knee be subject to the higher medial loading (Barrios et al., 2012, Andrews et al., 1996, Schmitz and Noehren,
A
2014). Andrews et al. (1996) found that individuals with static varus knee alignment had significantly higher peak of the EKAM during early stance phase, but those with knee valgus alignment significantly had lower peak of the EKAM during early stance phase. Furthermore, Barrios et al. (2012) found that the dynamic peak knee adduction angle was better than static radiographic knee alignment to predict the medial knee loading.
2.4. Biomechanical knee loading in level walking and stair
walking
It is widely believed that the biomechanical risk factors play an important role in the progression of knee OA. Although kneeling and squatting are critical conditions for the knee, level walking and stair walking are the most common daily activities and therefore they are the most focused conditions in all knee OA related researches (Reid et al., 2010). Before discussing the biomechanical knee loading in level walking and stair walking, it is necessary to review the normal level walking and stair walking firstly.
2.4.1 Level walking
Human walking is defined as the repetitive lower limb motions to provide weight transfer while also maintain support. The typical GC is the period from one foot initially contacts the ground to the following initial contact with the ground of the same foot (Perry and Burnfield, 2010). Each GC is divided into stance phase and swing phase: the stance phase (from initial contact to toe-off) accounts for about 60% (62% by some researchers) of the GC when the foot contacts with the ground and the swing phase (from toe off to initial contact) accounts for about 40% (38% by some researchers) of the GC when the foot is in the air (Perry and Burnfield, 2010). Furthermore, the stance phase of GC includes four sub-phases (loading response, mid stance, terminal stance, pre-swing) and the swing phase of GC includes three sub-phases (initial, mid and terminal swing) (Figure 2- 4 and Table 2- 1) (Levine et al., 2012, Perry and Burnfield, 2010).
Table 2- 1: Level walking GC period and function (from (Rose and Gamble, 2006))
Phase Sub-phase % GC Function
Stance phase
Loading response 0-12% Loading and weight transfer Mid stance 13-31% Support of entire BW;
centre of mass moving forward Terminal stance 32-50%
Pre-swing 51-62% Unloading and preparing for swing
Swing phase
Initial swing 63-75% Foot clearance
Mid swing 76-87% Limb advances in front of body Terminal swing 88-100% Limb deceleration, preparation forweight transfer
Figure 2- 4: Typical GC during level walking (Alam et al., 2014).
2.4.2 Stair walking
motor disability may walk with the compensatory step by step manner (Figure 2- 5 (B)) where both feet placed on the same step before stair ascent or descent (Reid et al., 2007). Table 2- 2: Stair GC period (from (Zachazewski et al., 1993, McFadyen and Winter, 1988))
Condition Phase Period % GC
Ascending Stair
Stance phase
Weight acceptance 0-17%
Pull up 18-37%
Forward continuance 38-65% Swing
phase
Foot clearance 66-82% Foot placement 83-100%
Descending Stair
Stance phase
Weight acceptance 0-14% Forward continuance 15-34%
Controlled lowering 35-68% Swing
phase
Leg pull through 69-84% Foot placement 85-100%
Figure 2- 5: (A) Step over step stair ascent, and (B) Step by step stair ascent (Aldridge Whitehead et al., 2014)
2.4.2.1 Ascending stair GC
.
Figure 2- 6: The GC of stair ascent (Novak et al., 2010)
(1) The first sub-phase of stair ascent is weight acceptance and occupies about 17% of the stair GC. Unlike level walking which using typical heel strike, the natural initial contact during stair ascent is the midfoot or forefoot strike (Au et al., 2008, Riener et al., 2002, McFadyen and Winter, 1988). During this phase, the ankle becomes more dorsiflexed (approximately 15°) whilst the hip and knee are in flexion position to prevent pelvic drop and prepare to pull up the body (Novak et al., 2010).
(2) Most of the progression made during stair ascent happens in the pull-up phase (vertical thrust phase) which represents the time of 18-37% of the stair GC. During this phase, the muscles of hip extensor, knee extensor, and the ankle plantar flexor concentrically contract to pull the body up and lift the other side foot into the air (McFadyen and Winter, 1988, Zachazewski et al., 1993).
(3) Forward continuance phase is the last stage of stance phase and occupies 38-65% of stair GC. After ascending one step, the forward progression will still continue by firing the muscles of hip extensor and knee extensor (Novak et al., 2010).
(4) Foot clearance occupies 66-82% of stair GC. During this phase, the lower limb is raised to clear the intermediate step by hip flexion, knee flexion and ankle dorsiflexion (McFadyen and Winter, 1988, Andriacchi et al., 1980).
2.4.2.2 Descending stair GC
The stance phase of descending stair GC, which accounts for approximately 68% of the stair GC, is also divided into three sub-phases: (1) weight acceptance, (2) forward continuance, and (3) controlled lowering; the swing phase can be divided into two sub-phases: (4) leg pull through, and (5) foot placement (Figure 2- 7 and Table 2- 2) (Novak et al., 2010, Zachazewski et al., 1993). Ascending stair requires higher demand for concentric muscle activities of lower limb to lift the body mass against gravity. Meanwhile, descending stair has higher demand for eccentric muscle activities of lower limb to control the lowering of the body (Costigan et al., 2002, McFadyen and Winter, 1988, Novak et al., 2010).
Figure 2- 7: The GC of stair descent (Novak et al., 2010)
(1) Weight acceptance occupies 0-14% of stair GC. Like stair ascent, using initial midfoot or forefoot contact at the beginning of weight acceptance (Au et al., 2008, Riener et al., 2002, McFadyen and Winter, 1988). When the foot starts to accept the BW and this weight is transferred to the leg as the opposite foot lifts off the step (McFadyen and Winter, 1988, Zachazewski et al., 1993).
(2) Forward continuance occupies 15-34% of stair GC. During this period, the ankle continues to increase dorsiflexion to start the single limb support and move the body forward (Novak et al., 2010, McFadyen and Winter, 1988).
to flex and reach the maximum degree of flexion (Zachazewski et al., 1993, Novak et al., 2010) and the foot also starts to dorsiflex and reach maximum degree of dorsiflexion (Andriacchi et al., 1980) at the same time to move the body’s mass from a higher position and lower onto the support limb (Novak et al., 2010).
(4) Leg pull through occupies 69-84% of the GC. The swing limb is pulled forward by ankle plantarflexion during this phase.
(5) The foot placement occupies 85-100% of stair GC and prepares for the next weight acceptance (McFadyen and Winter, 1988, Zachazewski et al., 1993).
2.4.3 The difference between level walking and stair walking
Firstly, unlike level walking where a traditional GC begins with heel strike in healthy people, both stair ascent and descent partially begins with a midfoot or forefoot strike (Au et al., 2008, Riener et al., 2002, McFadyen and Winter, 1988).
Secondly, the kinematics of stair ascent and descent are distinguished from that of level walking (Riener et al., 2002). Compared with level walking, stair ascent and descent require greater ROM of lower limb to negotiate stair (Andriacchi et al., 1980, Riener et al., 2002). The requirement of maximal knee flexion was considerably greater during both ascending (approximately 94°) and descending (approximately 91°) than during level walking (approximately 60°); the maximal ROM of ankle was greater during both ascending (approximately 43°) and descending (approximately 61°) than during level walking (approximately 25°) (Protopapadaki et al., 2007, Perry and Burnfield, 2010). However, the maximal hip ROM in sagittal plane was smaller during descending (approximately 25°) than ascending (approximately 58°) and level walking (approximately 41°) (Riener et al., 2002, Perry and Burnfield, 2010).
greater during stair descent and the maximum EKFM could be three times greater during stair ascent, and a larger range of knee motion would be required during stair walking (Andriacchi et al., 1980).
2.4.4 Biomechanical knee loading assessment
The excessive mechanical load on knee joint has adverse effects on the development and progression of knee OA (Miyazaki et al., 2002). The medial compartment of the knee is more likely to be affected by OA than the lateral compartment (Felson et al., 2002, Ahlbäck, 1968) and this caused by approximately 60-80% of compressive loading force transmitted to the medial side of the knee during walking (Chang et al., 2007). It is difficult to measure the TF contact forces in vivo directly and thus surrogate measures are used to infer the knee loads (Hall et al., 2016). One of the best ways to assess the medial TF contact force is to measure the EKAM which is the product of the moment arm and the value of ground reaction force (GRF) in frontal plane (Hinman and Bennell, 2009) (Figure 2- 8). The EKAM is a valid and reliable surrogate of dynamic medial knee loading during walking (Birmingham et al., 2007), and correlates to knee pain (Hurwitz et al., 2000) and radiographic disease severity (Kean et al., 2012).
Generally, the EKAM has two peaks (the 1st and 2nd peaks of the EKAM, Figure 2- 9), and
the first peak of the EKAM is usually higher than the second peak of the EKAM and used as a proxy measure of medial knee loading (Barrios et al., 2012, Baliunas et al., 2002, Hurwitz et al., 2002). The first peak of the EKAM is in the early stance (0–50% of stance phase) and the second one is in the late stance (51–100% of stance phase) (Thorp et al., 2006). It is reported that the risk of knee OA progression will increase by 6.46 times when every 1% increases in the EKAM (Miyazaki et al., 2002). Therefore, the treatment target is to lower the peak of the EKAM and Schmitz and Noehren (2014) found that the most effective way to reduce the first peak of the EKAM was to reduce the dynamic knee adduction angle in frontal plane, and followed by lowering the value of the vertical GRF.
However, Walter et al. (2010) found that reduction in the first peak of the EKAM did not guarantee the reduction in the medial knee contact force due to an increase in the peak of the EKFM, and suggested that it is better to predict the medial knee loading by using both the first and second peaks of EKAM and the peak of the EKFM. Trepczynski et al. (2014) also suggested that the peak of the EKFM need to be taken into consideration when predicting the medial knee contact force during over-flexed knee activities (such as stair walking, squatting and sit-to-stand).
Figure 2- 9: The first and second peaks of the EKAM, and KAAI.
curve and above zero line, Figure 2- 9), was firstly proposed by Thorp et al. (2006). The KAAI has been used as a complementary assessment to the peaks of the EKAM to measure knee loading since the first or second peak of the EKAM only represents a single time point during stance phase and cannot reflect the overall stance phase (Thorp et al., 2006). Additionally, the KAAI is more sensitive to detect the mild knee OA from the moderate knee OA than the first and second peaks of the EKAM (Thorp et al., 2006) and has been regarded as a cause for the medial cartilage volume loss (Bennell et al., 2011a). The individuals with medial knee OA have higher KAAI and peak EKAM than those without knee OA, and both of the peak EKAM and KAAI increased with Kellgren-Lawrence (K-L) grading (Thorp et al., 2006, Linley et al., 2010).
It is difficult for early to moderate knee OA patients when climbing stairs compared with level walking (Costigan et al., 2002). This may come from the differences of the knee kinetics and kinematics between the stair walking and level walking. Studies have revealed that individuals with medial knee OA have higher EKAM during stair walking than level walking; the highest peak of the EKAM was during stair descent followed by stair ascent and the lowest was level walking (Guo et al., 2007).
2.5.
Clinical assessment of knee OA
Individuals with knee OA demonstrate clinical signs either from a pain perspective and/or a radiological perspective. This allows clinicians to determine the severity of the disease and a short overview of this is presented below.
2.5.1 Pain
Index has been introduced in the OA literature (Roos et al., 1998). The KOOS is intended for adults with knee injury and/or knee OA, and can be used to monitor disease progression and outcomes following conservative and non-conservative interventions (Roos et al., 1998). The KOOS, which is free of charge and translated into more than 45 different language versions, has been used for clinical and research purposes internationally and is now becoming the most used instrument (Collins et al., 2016).
2.5.2 X-ray
The radiograph remains the most widely used tool in the diagnosis and grading of knee OA, although more advanced imaging techniques are available. Standard standing anteroposterior and lateral views of knee in extension are routinely used. Kellgren-Lawrence (K-L) grading scale (Table 2- 3 and Figure 2- 10) is the most often used and World Health Organization (WHO) accepted radiological classification system for the diagnosis of knee OA (Wright and Group, 2014, Lakkireddy et al., 2015, Kellegren and Lawrence, 1957). Although the radiography is the most common diagnosis choice for individuals with knee pain, the degree of disagreement between clinical criteria and the radiological classification of OA is high in the early stages (Lakkireddy et al., 2015, Hannan et al., 2000).
Table 2- 3: Kellgren-Lawrence (K-L) grading scale
Grade Definition
0 No radiologic features of OA
I Doubtful narrowing of joint space and possible osteophytic lipping II Definite osteophytes and possible narrowing of joint space
III Moderate multiple osteophytes, definite narrowing of joint space, some sclerosis and possible deformity of bone contour
IV Large osteophytes, marked narrowing of joint space, severe sclerosis, and definite deformity of bone contour.
2.5.3 Magnetic resonance imaging
Magnetic resonance imaging (MRI) is a non-invasive imaging measurement and has been successfully used to detect the changes of articular cartilage (Recht et al., 2001, Eckstein et al., 2001, Kornaat et al., 2005, Peterfy and Genant, 1996). MRI can visualize several knee OA related pathological features, including not only the volume of cartilage change, the structure of the meniscus, the joint effusion and synovitis, but also the subchondral bone marrow lesions (BMLs) (Kornaat et al., 2005, Hayashi et al., 2014), which are not easily detected by the traditional X-ray (McCauley et al., 2001). Although it has advantages in the diagnosis of knee OA, the MRI is not usually recommended as the initial screening tool and routine assessment for knee OA since its high cost.
2.6. Management of knee OA
biomechanical problems via knee bracing or foot orthoses (Nejati et al., 2015, Snijders et al., 2011).
2.6.1 Self-management
Self-management, which emphasize on teaching skills, has become increasingly popular in the management of chronic diseases (Walker et al., 2003). Weight control is one of the top priority of conservative treatment to knee OA (Jevsevar, 2013). As described before, both gaining weight and decreased muscle strength can lead to increase knee loading. Obesity is a strongly modifiable risk factor for the development of knee OA and weight loss should be addressed as part of the management of knee OA (Litwic et al., 2013, Blagojevic et al., 2010). However, a recent systematic review showed that self-management education programmes have little benefit to individuals with knee OA (Kroon et al., 2014).
2.6.2 Exercise
The muscle strengthening has played an important role in the management of knee OA (Fransen et al., 2015). Fransen et al. (2015) reports that land-based therapeutic exercise is beneficial to improving both knee pain and quality of life for individuals with knee OA. The combination of exercise and weight loss has greater reductions in knee loading than either treatment alone for overweight people with knee OA (Messier et al., 2013). However, it is difficult for patients to adhere to both exercise and weight loss in the long term (Jones et al., 2013a). Lim et al. (2008) found that quadriceps strengthening exercise did not have any effect on medial knee loading. Additionally, Bennell et al. (2010) found that the hip muscles strengthening could alleviate pain and improve function among individuals with medial knee OA, but it did not reduce the medial knee loading.
2.6.3 Pharmacological management of knee OA
associated with adverse side effects (Stacy et al., 2006, Lazzaroni and Bianchi Porro, 2004). Paracetamol has been recommended for the initial treatment for mild and moderate knee OA (Zhang et al., 2008), but the latest evidence showed that paracetamol might be less effective and might have greater risks (such as gastrointestinal (GI) adverse events and multi-organ failure) than previously thought (McAlindon et al., 2014, Kielly et al., 2017). NSAIDs are associated with an increased risk of serious GI, cardiovascular (CV), and renal injury (Chou et al., 2012). Additionally, pain improvement as the result of drug consumption is accompanied by an increase in the EKAM, which could indicate an increase in medial knee loading (Fantini Pagani et al., 2012, Henriksen et al., 2006).
2.6.4 Acupuncture
Acupuncture therapy has gained popularity in treating OA globally (Hou et al., 2015, Jong et al., 2012) and proved beneficial in the relief of pain from OA (Manheimer et al., 2010). The mechanisms of acupuncture analgesia have been widely explored and the endogenous opiate mechanism and descending inhibitory mechanism are accepted (Pomeranz and Chiu, 1976, Takeshige et al., 1992, Hou et al., 2015, Kim et al., 2013). Generally, the treatment of acupuncture can address muscle imbalance and fascial tension and reduce inflammation and pain in the early stage of OA (Tukmachi et al., 2004, Vas et al., 2004, Hou et al., 2015, Williamson et al., 2007). However, Hinman et al. (2014a) compared the effect of needle acupuncture and laser for chronic knee pain among individuals with knee OA for three months and found that neither laser nor needle acupuncture was better than sham laser for pain relieve or function improvement.
2.6.5 Intra-articular injections
2.6.6 Operative treatment for knee OA
Although surgical treatments for knee OA include arthroscopy, HTO, UKA and TKA, the best management of knee OA is still controversial. The management of medial knee OA aims to improve pain, physical function and quality of life (Longo et al., 2015). Both the HTO and UKA are the established treatment for moderate medial knee OA. TKA is the method of choice for symptomatic advanced knee OA. Moderate grade stages of knee OA require an individualized approach and are more based on patient’s choice and expertise of the consulting surgeon.
2.6.6.1 Arthroscopic surgery
Knee OA arthroscopic surgery is an operative treatment which inserts an arthroscope into the knee joint and examines inside of the knee and the main purpose of this treatment is to remove and/or repair any damaged articular surfaces (such as cartilage fragments and osteophytes) (Kirkley et al., 2008). However, studiesreported that arthroscopic surgery did not have additional benefits to individuals with knee OA when compared with conventional physical and medical therapy (Kirkley et al., 2008, Alshami, 2014). Additionally, the intervention of arthroscopic surgery is not effective for knee OA and the treatment efficacy for knee pain and physical function is similar to knee capsule injections of saline, joint lavage, and sham surgery (Moseley et al., 2002, Deyle et al., 2012, Laupattarakasem et al., 2008).
2.6.6.2 High tibial osteotomy
The intention of the HTO is to redistribute loads on the knee in individuals with medial knee OA and its mechanism is through the mechanical axis of the lower extremity laterally shifted from the medial compartment knee (Bonasia et al., 2014). The opening (medial, Figure 2- 11 (A)) and closing (lateral, Figure 2- 11 (B)) wedge HTO techniques are most commonly used to treat medial knee OA. The closing wedge HTO was first proposed by Jackson and Waugh (1961) and then further popularized by Coventry (1965). The closing wedge HTO has advantages over opening wedge HTO which includes faster healing, quicker to weight-bearing, and fewer problems of patella baja; however, compared with the opening wedge HTO, the closing wedge HTO has its own disadvantages including fibular osteotomy or proximal tibiofibular joint dislocation, lateral muscle detachment, possible of peroneal nerve injury, and more challenging for subsequent TKA (Bonasia et al., 2014). Additionally, the disadvantages of opening wedge HTO include the need for bone grafting, higher rates of nonunion and risk of collapse (Harris et al., 2013, Ferruzzi et al., 2014, Rossi et al., 2011, Bonasia et al., 2014).
A B
2.6.6.3 Unicompartmental knee arthroplasty
The UKA is a surgical procedure that replaces medial or lateral compartment of the knee. The UKA has several advantages over conventional TKA which include minimal access surgery, reduced blood loss, larger knee range of motion (ROM), rapid recovery as well as reduced hospital stay (Lyons et al., 2012, Saldanha et al., 2007, Newman et al., 2009). The individuals with UKA are more likely to have normal EKFM and external knee extension moment (EKEM) in the sagittal plane compared with individuals with TKA, partly due to the presentation of the ACL in the UKA (Chassin et al., 1996). Additionally, individuals who received UKA are more likely to forget their artificial knee joint and be happier with their daily life (Zuiderbaan et al., 2017). The UKA was performed frequently among patients aged 60-64 years, while the HTO was performed most frequently among patients aged 40-44 years (Zhang et al., 2010). However, the EKAM in individuals with UKA was larger than that in individuals with TKA due to the residual varus alignment (Chassin et al., 1996). Meanwhile, Koskinen et al. (2008) did not recommend the UKA to treat unicompartmental knee OA, due to the finding that the UKA had no longer survival than TKA and no cost-benefit over TKA.
2.6.6.4 Total knee arthroplasty
and even death (Solomon et al., 2006, SooHoo et al., 2006, Pinaroli et al., 2009, Parvizi et al., 2008, Abularrage et al., 2008). Additionally, Orishimo et al. (2012) found that the EKAM was still high at one year after TKA, despite the static knee alignment was corrected; and suggested that the dynamic knee adduction angle could be measured to predict the recurrence of the pre-surgical knee varus deformity.
When summarizing the operative management for medial knee OA, it is clear that the varus alignment and dynamic loading are being treated in order to reduce the individual’s pain and also to increase function. Whilst the conservative treatments aforementioned (exercise, acupuncture, pharmacological treatment, etc.) treat the clinical symptoms unfortunately the mechanical impairments persist and thus treatments that offer both a clinical and mechanical advantage, non-operatively, are essential.
2.6.7 Biomechanical treatments for medial knee OA
Biomechanical factors are associated with the pathogenesis of knee OA, although the causes of knee OA are complicated (Andriacchi and Mündermann, 2006, Yamaguchi et al., 2015, Block and Shakoor, 2010). Because local mechanical forces influence the initiation and progression of knee OA, load-modifying treatments are particularly appealing because of their acceptable costs and less adverse side effects compared with other pharmacological and operative treatments (Jones et al., 2013a).
An excessive EKAM not only has been associated with the severity and progression of radiographic knee OA but also with severity of knee pain (Fibel et al., 2015). Henriksen et al. (2014) reported that the relative odds of knee OA progression were increased by 1.9 times when each a unit increased in the peak EKAM (% BW*Ht). In order to reduce the EKAM in individuals with medial knee OA, either the GRF lever arm or the value of GRF should be reduced. Biomechanical treatments (knee braces, knee sleeves, foot orthoses, etc.) are potentially effective interventions for medial knee OA and will be briefly reviewed next.
2.6.7.1 Knee braces and sleeves
Unloader or off-loader knee braces have been used in knee OA patients to modulate mechanical stress on the symptomatic joint compartment and shift load from the affected compartment to the non-affected compartment (Laroche et al., 2014). Additionally, other mechanisms of knee braces may improve the stability, proprioception and warmth of the knee joint (Hunter, 2015). Valgus braces can unload the medial knee loading in patients with medial knee OA by reducing EKAM and a change in the alignment of the thigh and shank (Petersen et al., 2016). The clinical effects of valgus braces have been shown to be pain reduction and other biomechanical effects include increased walking speed, step length, and/or gait symmetry (Schmalz et al., 2010, Petersen et al., 2016). The cost-effective unloader braces treatment for knee OA has been shown to delay the requirement for surgery (Lindenfeld et al., 1997, Pollo et al., 2002, Horlick and Loomer, 1993). The impairment of proprioception in knee joint has been regarded as one of local factors in the initiation and progression of radiographic knee OA (Knoop et al., 2011, Sharma, 1999). Additionally, proprioceptive impairments could lead to knee pain and/or limitation of daily activities in knee OA patients (van Dijk et al., 2006, Bennell et al., 2003). The knee bandages may improve the proprioceptive accuracy of the knee joint by the stimulation of skin receptors around the knee (Knoop et al., 2011). Knee sleeves may improve the knee joint proprioception by providing warmth and compression to the knee joint (Miller et al., 2005, Perlau et al., 1995). Chuang et al. (2007) found that individuals with knee OA using knee sleeves improved their balance ability in both static and dynamic conditions when compared with those without sleeves. These relatively simple and inexpensive sleeves can be commonly recommended for individuals with medial knee OA to improve balance ability.
knee OA was uncertain due to limited controlled trials were published (Duivenvoorden et al., 2015).
There were no significant differences between using valgus brace and LWI treatments to medial knee OA; however, compared with knee braces treatment, the LWI treatment was more acceptable among individuals with medial knee OA (Fu et al., 2015, Jones et al., 2013b, Fantini Pagani et al., 2012). Similarly, Fitzgerald (2005) found that the compliance with LWI treatment was over 90%, but compliance for the valgus knee loading brace was only about 50%. Therefore, whilst braces do appear to have positive elements, the overall costs, low usage and also aesthetics other devices which increase wear time would be more favorable.
2.6.7.2 Footwear and lateral wedge insoles
The UK’s National Institute of Clinical Excellence (NICE) guidelines recommend footwear and insoles to be a part of the conservative management of knee OA (National Institute for Health and Care Excellence, 2014). The biomechanical treatments of footwear and LWI are both cheap and effective; therefore they could be utilized widely and regularly. Different types of biomechanical footwear are widely used to treat knee OA and can be broadly divided into LWI (worn within a shoe) (Hinman et al., 2012, Hinman et al., 2008b, Hinman et al., 2009, Jones et al., 2014, Chapman et al., 2015), variable stiffness shoe (Fisher et al., 2007, Erhart‐Hledik et al., 2012, Boyer et al., 2012, Erhart et al., 2010b, Jenkyn et al., 2011), Melbourne OA shoe (Kean et al., 2013, Van Ginckel et al., 2017, Bennell et al., 2013, Hinman et al., 2014b, Hinman et al., 2016), and the mobility shoe (Shakoor et al., 2013, Shakoor et al., 2008, Jones et al., 2015).
(i) Lateral wedge insole
because of its acceptable price, simple intervention, and absence of adverse effects (Zhang et al., 2008, Campos et al., 2015), and have been a recommended management strategy in numerous international clinical guidelines for medial knee OA (Lewinson et al., 2014). Individuals with medial knee OA had greater compliance with LWI (71%) than that with brace (45%) during six months’ treatment (van Raaij et al., 2010). A recent meta-analysis of randomized trials demonstrated that there was no significant improvement in pain when using the LWI compared with neutral comparator insole (Parkes et al., 2013). The reductions in pain may be relatively small when using LWI, but a small improvement in pain could generate large public health benefits. Meanwhile, this small reduction in pain is also linked with positive biomechanical effects.
and pronated feet. Jones et al. (2015) found that both the typical LWI and off-the-shelf medial supported LWI reduced the medial knee loading similarly, but the medial supported LWI improved pain more. However, the long term clinical effect of LWI has not been proven with null effects seen in trials (Bennell et al., 2011, Baker et al., 2007). One of the potential reasons for this is the biomechanical non-response to the treatment. Despite recommendations in several guidelines (Zhang et al., 2007), approximately 20-30% of patients with medial knee OA have no or even an adverse biomechanical response (Chapman et al., 2015, Hinman et al., 2012, Kakihana et al., 2005).
Whilst LWIs are a convenient choice, the concept of having these in every pair of daily used footwear is an interesting idea and researchers in the United States and Australia have developed shoes with the mechanism of an LWI as an integrated system. One type of these shoes was called the variable stiffness shoe (Fisher et al., 2007, Erhart‐Hledik et al., 2012, Boyer et al., 2012, Erhart et al., 2010b, Jenkyn et al., 2011), and the Melbourne OA shoe (Kean et al., 2013, Van Ginckel et al., 2017, Bennell et al., 2013, Hinman et al., 2014b). Additionally, another type of barefoot-mimicking walking shoe, the mobility shoe, was also used to reduce the medial knee loading (Shakoor et al., 2013, Shakoor et al., 2008, Jones et al., 2015).
(ii) Variable stiffness shoe
not consistent with the expected theory that the COP laterally shifted to reduce the EKAM. However, all these previous studies only compared the effect of variable stiffness shoe on medial knee loading with constant stiffness shoe or variable stiffness shoe with different lateral to medial side stiffness ratio, and no researchers have compared the variable stiffness shoe with LWI, Melbourne OA shoe and mobility before (Fisher et al., 2007, Erhart et al., 2008, Erhart et al., 2010a, Erhart et al., 2010b, Jenkyn et al., 2011).
(iii) Melbourne OA shoe
The Melbourne OA shoe (Gel Melbourne OA, ASICS Oceania Pty. Ltd.), which was developed and manufactured by Melbourne University and ASICS company, has integrated both a variable stiffness midsole and LWI with the idea this can significantly reduce medial knee loading immediately (Kean et al., 2013, Van Ginckel et al., 2017, Bennell et al., 2013, Hinman et al., 2014b, Hinman et al., 2016). The previous studies showed that the Melbourne OA shoe could reduce medial knee loading during walking when compared with control shoe (Asics Oceania) for individuals with medial knee OA (Kean et al., 2013, Bennell et al., 2013). However, Hinman et al. (2016) performed a randomized controlled trial study using Melbourne OA shoe to treat individuals with medial knee OA for six months, the effect of which was assessed by comparing the results with that from the conventional walking shoe, and found that pain and function improved in both Melbourne OA shoes and conventional shoe groups, but no additional improvement found in Melbourne OA shoe group.
(iv) Mobility shoe
The mobility shoe (a type of lightweight flexible shoe) has a series of grooves on the sole at crucial flexion points, which mimic natural barefoot walking (Shakoor et al., 2008, Shakoor et al., 2013). It has demonstrated that the inexpensive flexibility shoe could reduce medial knee loading immediately (Shakoor et al., 2008) and in longer term (Shakoor et al., 2013). However, the mobility shoe used in previous study showed no reduction in medial knee loading, though immediate knee pain and feeling of comfort significantly improved (Jones et al., 2015).
level walking (Costigan et al., 2002). More importantly, stair walking is more challenging for individuals with medial knee OA because the medial knee joint loading is about six times greater during stair descent than during level walking, and the maximum EKFM during stair ascent is about three times greater than level walking (Andriacchi et al., 1980). Pain has been the first complaint in individuals with medial knee OA during stair ascent and descent, devices should also be examined to whether reduce this loading during these activities (Costigan et al., 2002). Whilst there is an increase in the studies investigating this common daily activity (Vallabhajosula et al., 2012, Hicks-Little et al., 2011, Protopapadaki et al., 2007, Amirudin et al., 2014), few of them have investigated the effect of footwear on stair walking (Alshawabka et al., 2014, Sacco et al., 2012, Moyer et al., 2017, Al-Zahrani et al., 2013). Alshawabka et al. (2014) reported that LWI could reduce the EKAM during ascending and descending stairs among individuals with medial knee OA and Sacco et al. (2012) compared the Moleca shoe with heeled shoe and barefoot and found that the Moleca shoe could decrease knee loading during stair descent in knee OA patients. Al-Zahrani et al. (2013) and Moyer et al. (2017) found that a valgus knee brace and LWI combined could significantly reduce knee loading during stair walking. However, there is no study which has compared the different footwear available for individuals with knee OA when ascending or descending stairs. Different types of footwear may differ in their effect on dynamic knee loading during stair walking and thus understanding which type of footwear reduces medial knee loading best during stair walking may provide the most efficient biomechanical treatment guideline to medial knee OA. To gain a better understanding of footwear effect on medial compartment knee loading during stair walking is meaningful in this first step.
2.7. Summary of the review and the focus of this study
Chapter 3: Biomechanical
method
and
test-retest
reliability pilot study
3.1. Instrumentation
3.1.1 Cameras and force plates setting
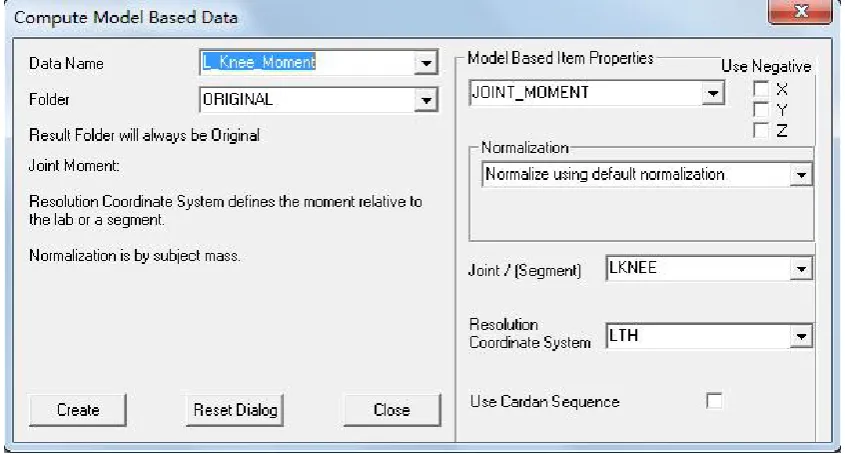
The environment for the work was the Podiatry Clinic’s gait laboratory at the University of Salford, Salford, M6 6PU, UK. Kinematic data were collected for the lower limbs using 14 Qualisys OQUSTM infra-red motion capture cameras, Qualisys AB, Sweden) at a sampling
rate of 100 Hz (Figure 3- 1), and four force plates (AMTI: Advanced Mechanical Technology Incorporation, Watertown, USA, model BP600400, Figure 3- 2) embedded flush in the ground were used to measure the GRF at a frequency of 1000 Hz. In our study, only force plate 2 and 3 (Figure 3- 2) were used to collect data as the interlaced stair used in the following primary study must be installed in these two force plates.
Figure 3- 1: The location of the fourteen OQUSTMinfra-red cameras and the four integrated
Figure 3- 2: The position and orientation of the four force plates.
3.1.2 System calibration and lab coordinate system set up
The system calibration incorporates data derived from the force plate and data generated from the camera measurement system. The well set and synchronized force plates with the camera system provide an accurate measurement of the motion data of tracking markers and GRF data.
Figure 3- 3: The L-frame, the calibration wand and the laboratory coordinate system.
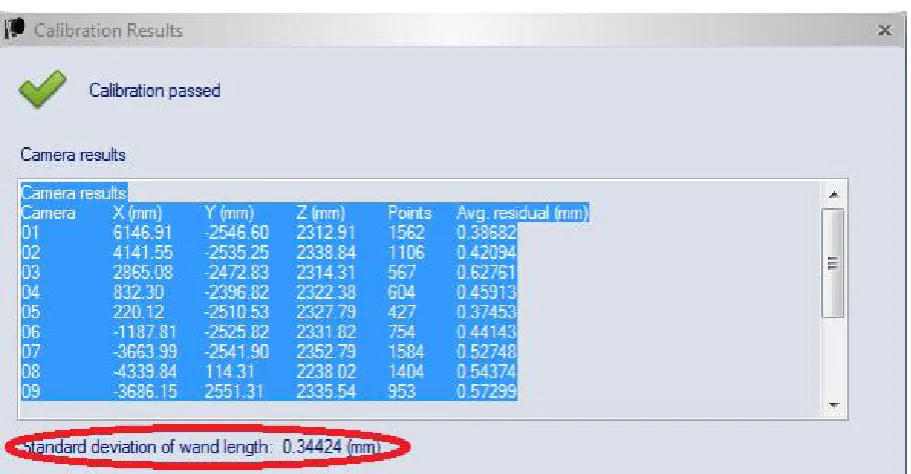
calibration wand. The L-frame contains four markers: two markers are attached to form the X-axis and another two markers determine the Y-axis (Figure 3- 3). The L-frame was placed at the original corner of force plate 1 with both frames aligned with the two sides of the force plates, the L-shaped reference structure determined the laboratory coordinate system. In this study, X-axis was set as anterior-posterior, Y-axis was set along medial lateral direction and Z-axis was the vertical axis. The calibration wand (with two markers on both ends of the wand, the distance between the two markers was exactly 601.7 mm, Figure 3- 3) was waved inside the measurement volume in all three directions for 60 seconds. This is to ensure that all of the space of data capture (Figure 3- 4) will be calibrated with the wand that has an accurate distance. The calibration would be passed once the calibration results (capture points of each camera and average residue of each camera) achieved a certain level. During this study in the lab, the standard deviation (SD) of the wand (601.7mm) was normally less than one mm.
Figure 3- 4: Calibration results of a successful calibration (with only nine cameras’ data shown).
3.1.3 CalTester calibration
researcher after camera calibration and before test. The CalTester test procedure is as described below:
Figure 3- 5: The tool of CalTester. (A) CalTester rod with two conical tips, (B) Wand with reflective marker, (C) Force application bar, and (D) Force base.
Placing the base plate on the force plate and zero the force plate;
Placing the CalTester rod in the centre of base plate's divot and press down firmly on the bar over the top of the rod with a load of at least 100 N;
Keeping the CalTester rod aligned vertically and motionless during the trial and at least last for one second;
Then moving the upper portion of the rod from vertical to 30 degrees from vertical, back to vertical and then 30 degrees in the opposite direction in either the frontal or sagittal direction and no less three seconds (Figure 3- 6);
Repeating the test at least three trials in force plate 2 and 3, respectively.
D
C A
Figure 3- 6: The CalTester rod was used to apply forces to the force plate